


-01.webp?width=400)


Guiding Private Equity Through Turbulence
The last few years have been turbulent by any measure, and the turbulence caused by economic uncertainty and geopolitical unrest in 2023 is expected to continue for the foreseeable future. Although less volatile than the public markets, private market activity has not been immune to the challenges impacting the broader market. Both venture capital and buyout managers have been affected by higher interest rates, persistent inflation, and earnings headwinds. Achieving multiple arbitrage at exit is becoming increasingly challenging. The lack of deal activity as the market adjusts to new conditions means exit valuations are becoming more difficult to reach and holding periods are getting longer.
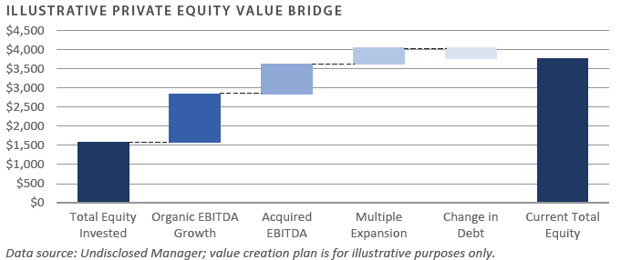
Given the current market fluctuations, investors are understandably curious about the strategies private equity managers use to manage portfolios in challenging times. Fortunately, private equity firms have a range of tactics they can use to adjust to the current situation. Many of these tactics are included in the private equity value bridge, a model that pinpoints factors that create value.1 This issue of Private Capital Quarterly will cover some of the methods general partners can use to weather the storm and create value, as well as strategies private equity firms can use to generate liquidity for their limited partners during tough times.
ORGANIC GROWTH INITIATIVES
When the economy is unstable, the usual ways of creating value through financial engineering are less effective. Debt financing, or leverage, becomes more costly and lowers the potential returns on equity when interest rates are high. Valuation multiples are already at a peak and likely to drop, shrinking the potential for multiple growth. Instead, private firms must depend more on their management teams’ ability to execute organic growth initiatives to create value. These plans mainly focus on increasing revenue and improving margins. Private equity firms can work with management teams to help raise the revenues of portfolio companies by optimizing pricing strategies, increasing sales volume growth, and adjusting the customer and product mix.
Attaining an increase in margins can be challenging, particularly in periods of continuous inflation; however, private equity firms can improve efficiency through strategic cost-cutting and inventory management. Recently, private equity portfolio management teams have been exploring leveraging automation and technology to enhance various processes. For instance, certain venture capital-backed biopharmaceutical firms have begun utilizing artificial intelligence (AI) to improve patient interaction, streamline documentation, and simplify billing procedures. This is anticipated to increase productivity throughout the organization, from production to commercialization, and reduce expenses.
STRATEGIC ACQUISITIONS
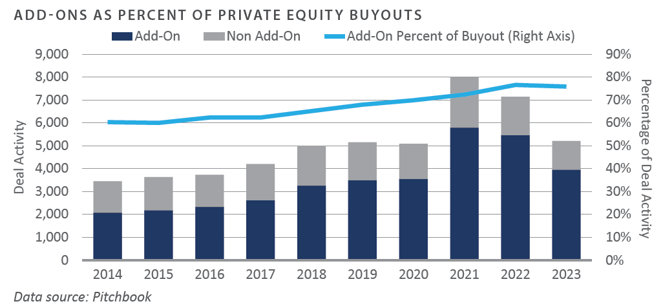
Private equity firms often utilize strategic add-on acquisitions as an instrument for value creation. These acquisitions usually occur after a core portfolio company, also known as a platform, has been acquired. The platform company then aims to purchase smaller targets, called add-ons, which can be assimilated into the larger platform operations. Add-on acquisition is a strategy private equity firms employ to scale businesses and rapidly seize a larger market share. Additionally, these acquisitions can enhance the platform by offering advanced technical capabilities, diversifying income streams, and broadening market prospects, among other benefits.
In the recent market environment, add-on acquisitions have played a crucial role. During 2023, add-ons held a significant position, constituting roughly 76% of all private equity buyouts.2 Despite a minor decrease of 69 basis points from 2022, this proportion is still close to a record high.3
CASH MANAGEMENT
Effective cash management can also help private equity-backed portfolio companies navigate challenging environments. This involves actively collecting and managing cash flow to support portfolio companies’ financial stability and liquidity. This may include reducing debt, working capital, and capital expenditure spending for buyout-oriented private equity firms. Given the tight lending market, private equity firms are unlikely to refinance existing debt. Instead, portfolio companies may seek to negotiate with lenders to extend maturities to reduce near-term financing expenses.
Venture-backed businesses may need to closely monitor their burn rate, or the rate at which they exhaust their cash reserves. To manage this rate, companies can implement various strategies focused on waste reduction, improved sales methods, and prioritization of accounts receivable. Decreasing the burn rate might necessitate cutting overhead expenses like rent, utilities, and office supplies. It could also involve reducing the number of employees through a systematic reduction in force (RIF). One recent example of this is the technology industry, which saw significant RIF in the past year. According to Crunchbase, more than 191,000 workers at U.S.-based technology companies were laid off in 2023.4
Businesses supported by private equity are expected to prioritize enhancing their accounts receivable collections. Some healthcare service businesses with private equity backing opt to automate their revenue cycle management (RCM) processes to expedite the collection process. This involves collaborating with external vendors to monitor daily charges, modify claims, and bolster patient outreach initiatives. By maintaining a low level of receivables, businesses backed by private equity can generate a higher free cash flow, thereby enhancing their valuation. Having discussed how private equity managers add value in these challenging times, the next area of focus is managers’ strategies for creating liquidity and, most importantly, distributions.
TRADE SALES
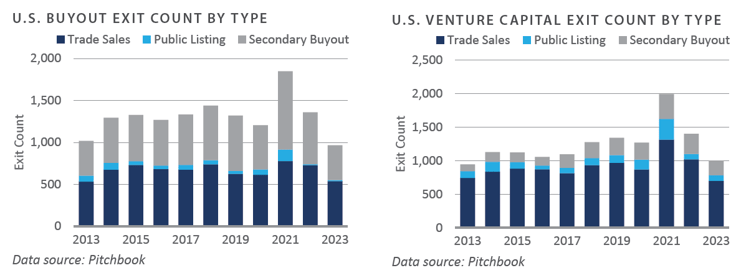
One of the main ways private equity investors can cash out their investments is through trade sales, which involve selling a portfolio company to another firm. This type of exit is also known as a strategic acquisition. According to Pitchbook, trade sales were the dominant exit option for private equity-focused strategies in the U.S. in 2023, making up over 60% of the exit value.5 Higher interest rates, earnings volatility, and economic uncertainty could make trade sales more challenging to execute in the near term.
SECONDARY BUYOUTS
A secondary buyout occurs when a company is sold from one private equity firm’s portfolio to another. This process allows the seller to exit its investment while the buyer acquires a company with the potential for further expansion. Secondary buyouts are particularly prevalent among firms focusing on buyouts, accounting for about 43% of all private equity exits in 2023.6 However, increased regulatory scrutiny, valuation concerns, and tighter lending standards have led to a 56% drop in secondary buyout transactions since the peak in 2021.7
INITIAL PUBLIC OFFERINGS (IPO)
An initial public offering (IPO) is another liquidity route for businesses backed by private equity. This exit strategy is typically more common with venture capital-backed businesses than those oriented toward buyouts. The IPO process entails the private equity firm transferring company ownership to the public by listing the company’s shares on a stock exchange. However, IPOs can be resource-intensive and time-consuming due to the extensive regulatory filings required. The market adjustment and valuation recalibration in 2023 diminished investors’ enthusiasm and expectations for IPOs. As a result, public listings backed by venture capital have fallen 73% from the highest recorded volume in 2021.8
DIVIDEND RECAPITALIZATION
Dividend recapitalization is a strategy private equity firms use to get cash back from their portfolio companies without selling them or going public. Essentially, companies borrow money to pay large dividends to investors. This allows investors to recover some of their initial investment and helps lower their risk. It also lets investors cash out without a complicated exit process. However, dividend recapitalization has its drawbacks. It adds more debt to the company, which means more interest payments and less room to maneuver. Also, if the company’s profits fall, it could face serious financial problems.
GP-LED SECONDARIES OR CONTINUATION VEHICLES
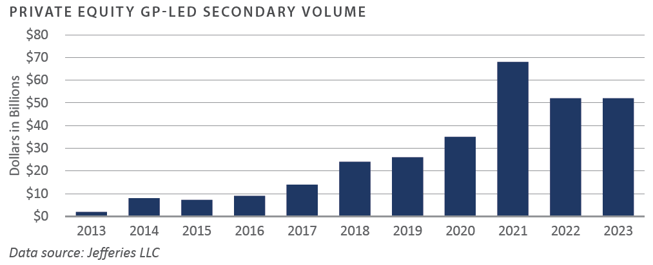
As noted in FEG’s Fourth Quarter 2022 Private Capital Quarterly Review, GP-led secondaries are another tool private equity firms can use to generate liquidity. GP-led secondaries—often via continuation funds—are transactions where a private equity fund's general partner initiates the sale of one or more portfolio companies to a new fund or a secondary buyer, aiming to raise additional capital and maximize asset returns.
GP-led secondaries have become more prevalent and sophisticated in recent years as the private equity industry has matured and faced challenges with providing liquidity solutions for its investors. According to Jefferies LLC, secondary activity in 2023 increased roughly 7% compared to total transaction volume from the previous year.9 GP-led secondaries accounted for approximately 46% of the total transaction volume.10 This trend is expected to persist and grow, with private equity firms using GP-led secondaries as continuation vehicles to provide liquidity to their investors in an anemic deal making market.
CONCLUSION
Private equity is a long-term investment that can generate premium returns compared to public markets. However, recent economic uncertainties and valuation concerns have impacted private equity firms’ ability to harvest portfolio companies. To mitigate this risk, FEG recommends that clients continue to build diversified private equity portfolios by vintage year, strategy, and manager. FEG has long encouraged clients to partner with operationally focused private equity firms that can leverage their expertise to identify and execute vital operating initiatives, accelerate performance, and drive long-term value creation.
1 Undisclosed Manager; Value creation plan is for illustrative purposes only. This case study has been used for that purpose only. The portfolio may contain a more significant number of positions than the case study set forth. Accordingly, the case study should not be viewed as an indication of overall past or future portfolio performance.
2, 3, 5, 6, 7 Pitchbook; 2023 Annual U.S. PE Breakdown, December 31, 2023
4 Crunchbase News, The Crunchbase Tech Layoffs Tracker, January 19, 2024
8 Pitchbook, Q4 2023 NVCA Venture Monitoring Summary, December 31, 2023
9, 10 Jefferies LLC, 2024 Secondary Market Update, January 2024
PRIVATE EQUITY
Venture Capital
-
During 2023, U.S. venture capital fundraising activity retreated to post-pandemic lows. In total, $67 billion was raised across 474 venture capital funds.1 Year-over-year that represents 61% and 65% declines, respectively.2
-
U.S. venture capital deal activity was also down from the prior year but remained in line with recent historical averages. The total U.S. venture capital aggregate deal value was $171 billion, 30% below the value in 2022.3 Year-over-year, deal volumes fell roughly 10%.4
-
During 2023, U.S. venture capital pre-money valuations witnessed intriguing shifts, especially in later-stage financing rounds. Year-over-year, series C and series D pre-money valuations were down 32% and 48%, respectively.5 Pre-seed and seed-stage valuations were less affected as they have been somewhat insulated from the broader market decreases.
-
Lackluster demand for initial public offerings (IPOs), weak merger and acquisition (M&A) environment, and economic uncertainty continue to negatively impact exit activity. Exit value in 2023 was down more than 90% from the 2021 peak.6 During 2023, annual exit value and volume were off 22% and 19%, respectively.7
-
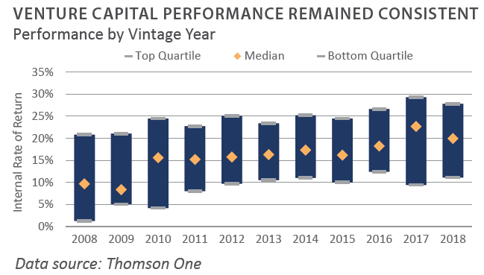
U.S venture capital performance contracted during the second quarter of 2023. The spread between the top and bottom quartiles was above 1,000 basis points.8
INVESTOR IMPLICATIONS
FEG believes fundraising, deal activity, and exit activity will likely remain below recent historical averages. If the macroeconomic environment persists, the coming quarters will probably include down rounds and lower carrying values. FEG, therefore, encourages clients to be cautious with new commitments.
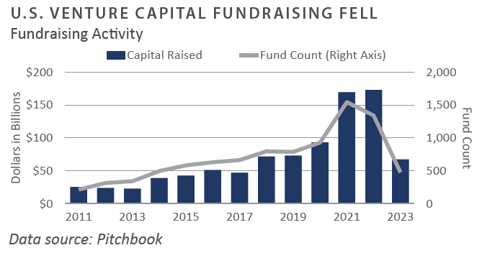
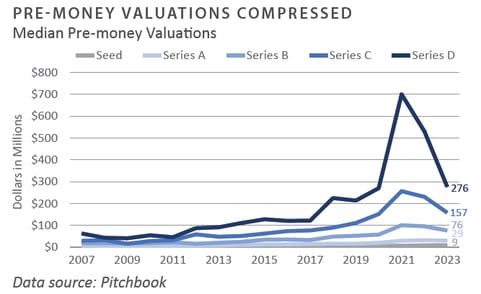
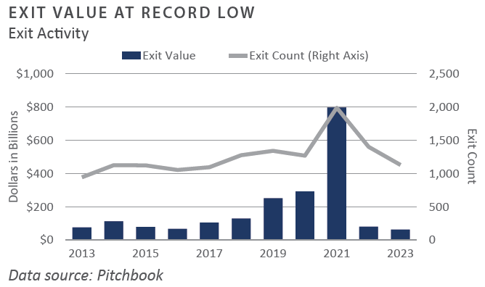
1-7 Pitchbook; NVCA Venture Monitor Q4 2023; December 31, 2023
8 Thomson One; June 30, 2023 (most recent available)
Leveraged Buyouts
-
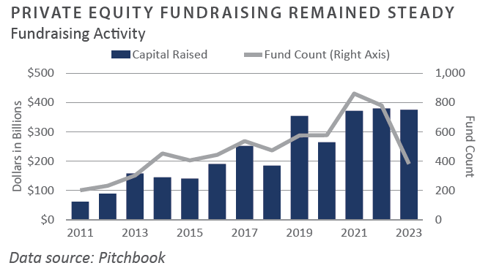
U.S. private equity (PE) raised nearly $375 billion in 2023, in line with the prior year.1 However, fundraising was concentrated when compared to 2022, with fund counts down roughly 50%.2
-
U.S. private equity deal activity declined during 2023. Deal value and volume fell 23% and 16%, respectively, from the same period in the prior year.3 Nearly two-thirds of deal volume was in transactions with less than $100 million of enterprise value (EV).4 Add-on transactions represented roughly 76% of U.S. PE deal activity in 2023.5
-
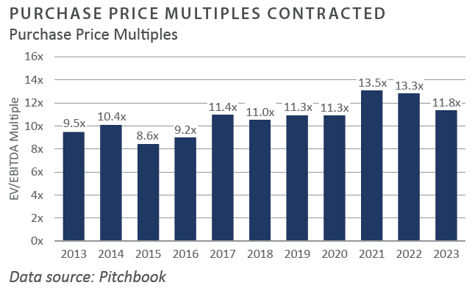
During 2023, North American PE purchase price multiples contracted marginally from 2022 levels. As of December 31, 2023, the median private equity buyout purchase price multiple was 11.8x earnings before interest, taxes, depreciation, and amortization (EBITDA).6 The median Debt/EBITDA ratio was roughly 5.0x EBITDA.7
-
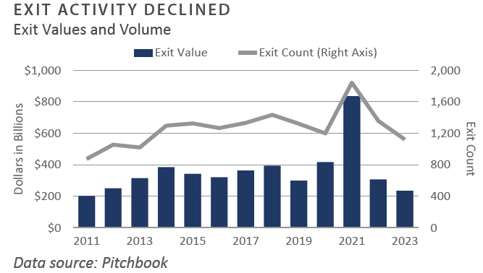
U.S. PE exit activity fell during 2023 compared to the prior year. Exit value and volume were negatively impacted by higher interest rates and the elevated cost of financing, with exit value and volume off 24% and 17%, respectively.8
-
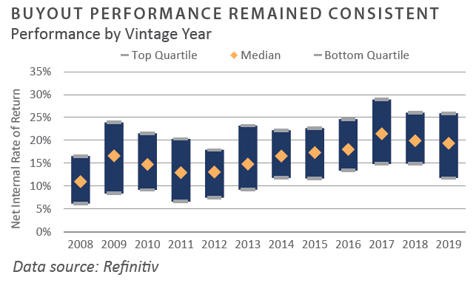
Private equity performance was strong through the second quarter of 2023, the most recent available. The spread between the top and bottom quartiles was above 1,000 basis points.9
INVESTOR IMPLICATIONS
Higher interest rates and concerns about an economic recession dampened private equity activity in 2023. Increasing public market volatility and geopolitical risks may present near-term performance headwinds for the asset class. FEG recommends that clients continue to remain cautious with new commitments.
1-8 Pitchbook; December 31, 2023
9 Refinitiv; June 30, 2023 (most recent available)
Private Debt
-
The fourth quarter of 2023 saw a strong rally in the public credit markets, with high yield meaningfully outperforming the bank loan market. High yield generated a return of 7.1% for the quarter, while bank loans returned approximately 3%.1 This action pushed high yield past bank loans for the year, as investors anticipated a Federal Reserve (Fed) policy pivot.
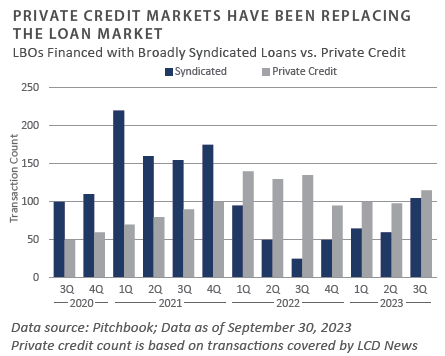
- The higher rate environment of the last two years further increased the attractiveness of private lending, as higher base rates drove senior secured private loan yields to low double digits. Private lending has taken market share from the bank loan market in recent years, a trend expected to continue as large corporate issuers look for capital in both formats.
-
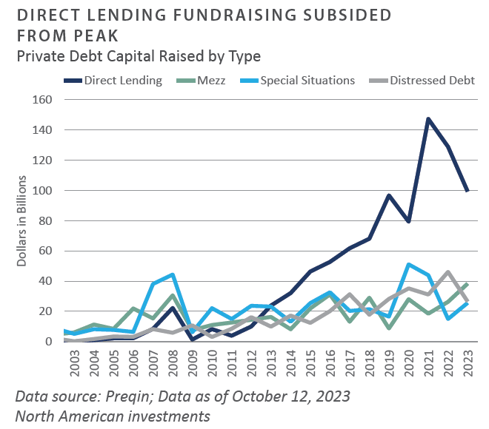
Private debt fundraising was off its 2021 high for the second year in a row due in part to weaker performance in the broader public markets over the last two years. The domestic economy's resilience has kept a wholesale distressed opportunity at bay while direct lending and mezzanine debt continue to garner investor interest.2
INVESTOR IMPLICATIONS
The economy has been more resilient than anticipated, and inflation has decreased. The Fed has shifted from higher for longer to pause and pivot, with the expectation of three to five rate cuts by the end of 2024. Should base rates decline, investor demand for floating-rate loans may diminish in favor of fixed-rate junior debt at the margin.
1 Pitchbook – LCD data through September 30, 2023
2 Preqin Private Debt Report 4Q 2023
Private Real Estate
-
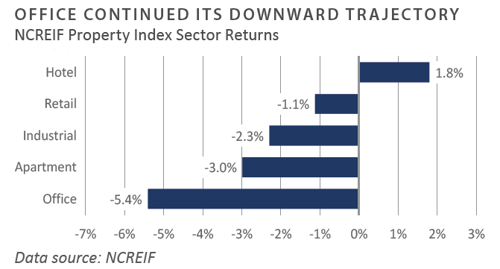
The National Council of Real Estate Investment Fiduciaries (NCREIF) Property Index (NPI) declined 3.0% during the fourth quarter and 7.9% for the year. Market value-weighted cap rates based on appraisals for unsold properties in the index increased to 4.6%, compared to 4.3% in the prior quarter. However, the average cap rate was significantly higher at 5.5% for properties that sold during the quarter.1
-
Public REITs declined sharply through 2022 in response to higher interest rates, while private real estate funds have been slower to mark down assets. Consequently, REITs may have reached a near-term bottom and should benefit from their more conservative balance sheets and fixed-rate debt. While still early, private real estate funds are expected to report lower year-end valuations, reflecting the impact of higher cap rates on property values.2
-
Private real estate transaction volume remained low as the industry struggled with the challenges of higher interest rates, limited price discovery, and the impact of pandemic-induced demographic shifts such as remote work. As such, cumulative transaction volume in the U.S. in 2023 reached the lowest level since 2013, at approximately $190 billion. Transaction volume declined significantly on a year-over-year basis, and while overall levels for 2023 remained depressed, the fourth quarter reflected an increase compared to the third quarter.3
-
According to Preqin, 72 private real-estate funds closed during the fourth quarter, raising approximately $20.8 billion. Comparably, 82 funds raised $27.8 billion in the third quarter. Private real estate fundraising peaked in the fourth quarter of 2021 when 309 funds raised $95 billion. Regarding primary strategies, fundraising was concentrated in opportunistic and value-add funds—40 total.
-
The mantra being adopted by property owners is “stay alive until ’25,” which reflects the challenging commercial real estate debt market and the need to manage looming debt maturities over the coming years. Credit for commercial real estate remains constrained, with many traditional lenders on the sidelines. With the current interest rate and investment sales environments making loan refinancing and property sale exit strategies more difficult, many borrowers may seek to exercise loan extension options.
INVESTOR IMPLICATIONS
Private real estate faces multiple challenges going into 2024, with what may be persistently high interest rates and slowing property fundamentals. In this environment, managers will be forced to balance distressed assets in their existing funds with pursuing compelling distressed opportunities in the current market. The real estate sector remains in the early stages of a multi-year downturn. As always, individual property types and regions vary in their fundamentals, which has the potential to benefit managers with a flexible mandate who can take advantage of shifting market dynamics. Given the reliance of real estate on debt financing, the narrative around interest rates will likely remain a key concern.
1 NCREIF; data as of December 31, 2023
2 NAREIT; data as of December 31, 2023
3 Altus Group, U.S. CRE Transaction Analysis; data as of February 1, 2024
Natural Resources
-
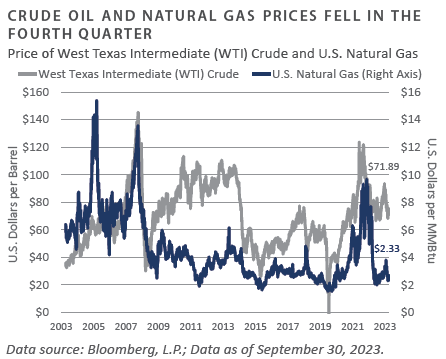
Oil prices fell 21% during the fourth quarter, closing at approximately $72/barrel, down from $91/barrel. Growing turmoil in the Middle East beginning in early October was overshadowed by record U.S. production.1 At its November meeting, OPEC+ made additional voluntary cuts to support prices; however, a lack of consensus led to doubts about OPEC+’s ability to maintain cuts. Additionally, the announcement of Brazil’s plans to join OPEC+ impacted prices. Brazilian oil production reached all-time records, and state-owned Petrobras issued guidance of even higher production, conflicting with the broader group.2
-
Natural gas prices fell 14.2% in the fourth quarter to close at $2.51/MMBtu, compared to $2.93 at the end of the third quarter. For the full year, gas prices fell 44%. Record levels of natural gas storage across North America and Europe put downward pressure on natural gas prices through the fourth quarter of 2023 and into 2024. Expectations are for weaker natural gas prices until liquid natural gas (LNG) export capacity begins to come online later in the decade, which could be delayed by the Biden administration’s decision to pause the permitting process for LNG export terminals.3
-
Multiple upstream private energy firms were actively raising capital at the end of the year. The recovery in commodity prices since 2020 has led some investors to reconsider traditional energy; however, fundraising remains challenging. Several significant realizations by private equity energy funds year-to-date have increased distributions to limited partners. Also noteworthy is that groups have emerged specifically targeting secondary interests in upstream funds, a niche area not widely pursued by larger private equity secondary funds.
-
Three major upstream M&A deals in the fourth quarter set a new record for transaction volume. The deal flow continued to be concentrated in the Permian Basin with ExxonMobil’s $65 billion acquisition of Pioneer Natural Resources announced in October. Shortly thereafter, Chevron announced it would acquire Hess in a $60 billion deal. The result was the strongest year for upstream M&A activity in a decade.4 Most analysts expect continued merger and acquisition activity into 2024 as larger companies seek to expand their presence in the Permian.
-
According to Baker Hughes, the U.S. oil and gas rig count dropped in 2023 after rising in the previous two years. The total count was down 157 rigs at year-end, or 20.1% year-over-year, as upstream energy companies remained cautious about capital spending. It was also the first time since 2020 that the overall rig count declined for a fourth consecutive quarter.
INVESTOR IMPLICATIONS
Merger and acquisition activity in public upstream energy continued into the year's end and early 2024. The result may be the sale of non-core assets, creating acquisition opportunities for private buyers. Within renewable energy, recent head-lines have centered on downward earnings revisions for solar companies and canceled projects in offshore wind. Inevitably, these challenges will begin to show up in the private markets, where capital has flooded into energy transition funds over the past several years and where projects may see similar challenges. FEG sees an ongoing “reality check for renewables” on the horizon through 2024 as rates remain persistently high. FEG believes the evolving energy landscape, however, continues to present a robust opportunity set for investors.
1, 3 Energy Information Administration, www.eia.gov; December 31, 2023
2 Reuters, OPEC oil output drops in November, in the first fall since July, December 6, 2023
4 ExxonMobil, Hess, Occidental Petroleum
INDICES
Bloomberg US Corporate High Yield Index represents the universe of fixed rate, non-investment grade debt. Eurobonds and debt issues from countries designated as emerging markets are excluded, but Canadian and global bonds (SEC registered) of issuers in non-EMG countries are included. The index includes the corporate sectors: Industrials, Utilities, and Finance, encompassing both U.S. and non-U.S. Corporations. See www.bloomberg.com for more information.
The Russell Indices are constructed by Russell Investment. There are a wide range of indices created by Russell covering companies with different market capitalizations, fundamental characteristics, and style tilts. See www.russellinvestments.com for more information.
The FTSE NAREIT Composite Index (NAREIT) includes only those companies that meet minimum size, liquidity and free float criteria as set forth by FTSE and is meant as a broad representation of publicly traded REIT securities in the U.S. Relevant real estate activities are defined as the ownership, disposure, and development of income-producing real estate. See www.ftse.com/Indices for more information.
The S&P 500 Index is capitalization-weighted index of 500 stocks. The S&P 500 Index is designed to measure performance of the broad domestic economy through changes in the aggregate market value of 500 stocks representing all major industries.
The NCREIF Property Index is a quarterly time series composite total rate of return measure of investment performance of a very large pool of individual commercial real estate properties acquired in the private market for investment purposes only.
HFRI ED: Distressed/Restructuring Index — Distressed/Restructuring strategies which employ an investment process focused on corporate fixed income instruments, primarily on corporate credit instruments of companies trading at significant discounts to their value at issuance or obliged (par value) at maturity as a result of either formal bankruptcy proceeding or financial market perception of near term proceedings. Managers are typically actively involved with the management of these companies, frequently involved on creditors' committees in negotiating the exchange of securities for alternative obligations, either swaps of debt, equity or hybrid securities. Managers employ fundamental credit processes focused on valuation and asset coverage of securities of distressed firms; in most cases portfolio exposures are concentrated in instruments which are publicly traded, in some cases actively and in others under reduced liquidity but in general for which a reasonable public market exists. In contrast to Special Situations, Distressed Strategies employ primarily debt (greater than 60%) but also may maintain related equity exposure.
Information on any indices mentioned can be obtained either through your advisor or by written request to information@feg.com.
DISCLOSURES
This report was prepared by Fund Evaluation Group, LLC (FEG), a federally registered investment adviser under the Investment Advisers Act of 1940, as amended, providing non-discretionary and discretionary investment advice to its clients on an individual basis. Registration as an investment adviser does not imply a certain level of skill or training. The oral and written communications of an adviser provide you with information about which you determine to hire or retain an adviser. Fund Evaluation Group, LLC, Form ADV Part 2A & 2B can be obtained by written request directly to: Fund Evaluation Group, LLC, 201 East Fifth Street, Suite 1600, Cincinnati, OH 45202, Attention: Compliance Department.
The information herein was obtained from various sources. FEG does not guarantee the accuracy or completeness of such information provided by third parties. The information in this report is given as of the date indicated and believed to be reliable. FEG assumes no obligation to update this information, or to advise on further developments relating to it. FEG, its affiliates, directors, officers, employees, employee benefit programs and client accounts may have a long position in any securities of issuers discussed in this report.
Index performance results do not represent any managed portfolio returns. An investor cannot invest directly in a presented index, as an investment vehicle replicating an index would be required. An index does not charge management fees or brokerage expenses, and no such fees or expenses were deducted from the performance shown.
Bloomberg Data Disclosure: Source- Bloomberg Index Services Limited. BLOOMBERG® is a trademark and service mark of Bloomberg Finance L.P. and its affiliates (collectively “Bloomberg”). Bloomberg or Bloomberg’s licensors own all proprietary rights in the Bloomberg Indices. Bloomberg does not approve or endorse this material or guarantee the accuracy or completeness of any information herein, nor does Bloomberg make any warranty, express or implied, as to the results to be obtained therefrom, and, to the maximum extent allowed by law, Bloomberg shall not have any liability or responsibility for injury or damages arising in connection therewith.
Neither the information nor any opinion expressed in this report constitutes an offer, or an invitation to make an offer, to buy or sell any securities.
Any return expectations provided are not intended as, and must not be regarded as, a representation, warranty or predication that the investment will achieve any particular rate of return over any particular time period or that investors will not incur losses.
Past performance is not indicative of future results.
Investments in private funds are speculative, involve a high degree of risk, and are designed for sophisticated investors.
An investor could lose all or a substantial amount of his or her investment. Private capital funds’ fees and expenses may offset private capital funds’ profits. Private capital funds are not required to provide periodic pricing or valuation information to investors except as defined in the fund documents. Private capital funds may involve complex tax structures and delays in distributing important tax information. Private capital funds are not subject to the same regulatory requirements as mutual funds. Private capital funds are not liquid and require investors to commit to funding capital calls over a period of several years; any default on a capital call may result in substantial penalties and/or legal action. Private capital fund managers have total authority over the private capital funds. The use of a single advisor applying similar strategies could mean lack of diversification and, consequently, higher risk.
All data is as of September 30, 2023 unless otherwise noted.