Secondaries: Private Capital's Utility Player
Major League Baseball spring training kicks off in a few weeks, where players will report to camp and be considered for key roles on baseball teams. One valuable role managers will seek to fill is the utility player. In baseball, a utility player is able to play several positions well despite not having a strong enough skillset to be a starter. The utility player is crucial to and helps form the foundation of a successful team. They give starters a break, fill in when players are injured, and offer crucial defense in late innings.
Secondaries can be utility players on your private capital portfolio’s roster. A pending recession and tighter debt markets are projected to dampen private capital deal activity in 2023. Higher interest rates and multiple compressions are expected to impact valuations for legacy private equity investments. With fewer opportunities to generate liquidity, some private capital firms may be forced to hold on to their investments longer to grow into their valuations. A corresponding slowdown in exit activity and the resulting decline in distributions may force overallocated limited partners (LP) and motivated general partners (GP) to actively manage their illiquid portfolios.
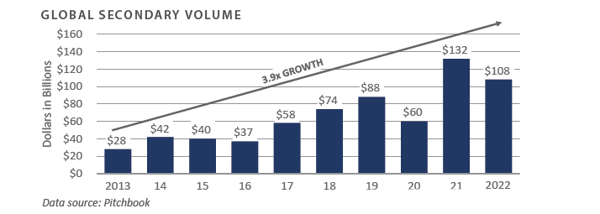
Private capital secondary markets can provide LP and GP portfolios with increased options for early liquidity. For investors in secondary funds, the strategy provides an attractive, risk-adjusted return that complements an existing portfolio of primary commitments. Once viewed as a safe haven for distressed sales, the secondary market has since grown in size and complexity. Jefferies estimates that secondary volume topped $108 billion in 2022, a 3.9x increase from 2013.1 In the future, FEG expects the market to evolve further to provide stakeholders with even more flexibility.
What are secondary transactions? How could they be leveraged to manage liquidity in a portfolio? Why consider investing in secondary strategies?
WHAT ARE SECONDARIES?
Secondaries refer to buying and selling existing LP interests in a private capital fund, a portfolio of funds, or their underlying assets before the holdings have been fully liquidated. In a typical secondary deal, the purchaser acquires the assets from the seller at a predetermined price and assume the seller’s rights and responsibilities.
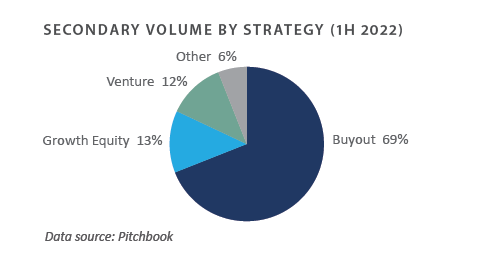
The structure can provide liquidity solutions for a wide range of strategies. During the first half of 2022, more than two-thirds of private capital secondary volume consisted of buyout-oriented assets.2 The market has grown to include venture capital, growth equity, mezzanine, and real assets pools.
Though it seems simple, secondary transactions can be complicated due to varying motivations among private fund constituents and concerns about price discovery. To ensure that only suitable investors replace departing investors, the GP of the private equity fund typically has to consent to the transfer. There are generally two types of secondary transactions: LP-led secondaries and GP-led secondaries.
LP-LED SECONDARIES
LP-led secondary transactions occur when a limited partner sells its existing interest in a private equity fund or a portfolio of interests in multiple funds. Sellers in LP-led transactions transfer not only their interest in the fund but also their remaining unfunded commitment. The buyer, typically another limited partner or a private equity fund, often purchases the fund interests at a discount to net asset value (NAV) and agrees to take on any future funding obligations related to the fund commitment in exchange for future distributions associated with the underlying assets. There are several reasons why an investor may consider executing an LP-led secondary before a fund’s underlying assets are fully realized.
- Portfolio Rebalancing: Private capital valuations report on a time lag. This can create asset allocation issues when public markets are volatile. As the value of public holdings falls, private capital markets only change quarter by quarter, and even then valuations do not swing too wildly. During bear markets, the NAV of illiquid assets can represent a more significant percentage of an overall portfolio. This is often referred to as the “denominator effect.” Organizations with strict allocation limits may be forced to sell a portion of their exposure to ensure their portfolios align with policy.
- Liquidity Management: LPs may use the secondary market to raise cash to fund unexpected capital expenditures, pay down debt or other outstanding liabilities, or meet capital calls for other illiquid obligations.
- Change in Strategy or Policy: Over time, target allocations to specific strategies (e.g., venture capital, real assets), geographies (e.g., U.S., China), or sectors (e.g., energy, defense) may change. Investors can use the secondary market to reduce unwanted exposures.
GP-LED SECONDARIES
GP-led transactions occur when the private equity firm, not the LP, initiates the secondary sale of existing interests in funds or portfolio companies. GPs utilize these transactions to provide multiple LPs with an early liquidity option, recapitalize existing assets, provide management teams with more time to execute value-creation plans, or re-incentivize the sponsor. GP-led transactions can include several assets or be structured around a single asset. Limited partners in GP-led transactions are usually given the option to sell their interests or to remain a limited partner in the new special purpose vehicle (SPV).
The most common GP-led transaction types are fund restructurings and LP tender offers.
- Fund Restructuring: In a fund restructuring, the general partner creates an SPV to acquire a predetermined asset or assets from a predecessor fund. These transactions are often referred to as “continuation vehicles.” In most cases, the GP will work with an outside limited partner or secondary private capital firm to create the SPV, purchase the assets, and reset the key economic terms—e.g., monitoring fees, distribution waterfalls, carried interest.
- Tender Offer: In a tender offer, a GP arranges for a secondary buyer to buy multiple LP interests in an existing private equity fund. A liquidity offer is presented to all LPs to sell their interests in a private equity fund with no substantial changes to the current fund structure.
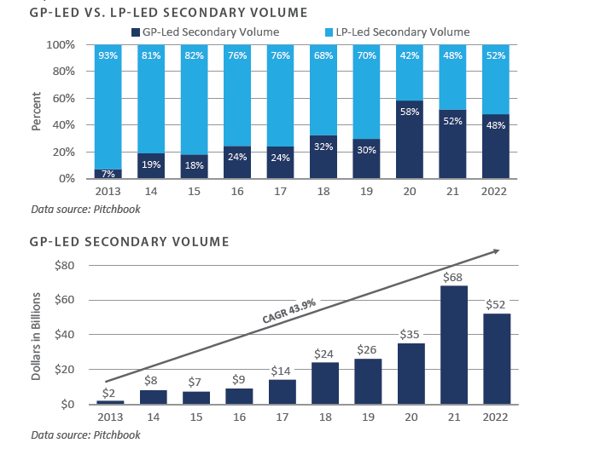
Historically, LP-led secondaries have represented most of the annual secondary market activity; however, during the onset of the pandemic, GP-led transaction volume spiked. In 2020, GP-led secondaries accounted for more than half of the overall volume. Private capital managers used fund restructurings to raise capital and give them more time to pursue value-creation strategies at portfolio companies. Jefferies estimates that GP-led transactions accounted for roughly $52 billion of total secondary deal volume in 2022, a 43.9% Compound Annual Growth Rate (CAGR) since 2013.3 Single and multi-asset continuation vehicles represented 85% of the GP-led secondary volume.4
The growth in GP-led secondary transaction volume is likely attributable to investors becoming more accepting of the structure. Previously, GP-led transactions were reserved for troubled assets with few attractive liquidity options. Today, GPs can use the secondary market to recapitalize their “high quality” assets, retain economic control, and garner more time to execute value-creation plans at portfolio companies they would have otherwise been forced to sell prematurely.
BUYER MOTIVATIONS
- There are various reasons buy-side participants may be attracted to the secondary market. Secondaries offer several potential benefits for investors and may represent an attractive entry point relative to primary private equity funds because of their unique risk-return characteristics.
- Diversification: Secondary transactions may include a portfolio of private capital funds across a wide range of managers, industries, geographies, strategies, and vintage years. Purchasing a well-diversified portfolio of funds provides a buyer with illiquid exposure with less risk than an investment in a single primary fund.
- Reduced Blind Pool Risk: Investors in primary funds do not know in advance what investments the fund manager will make. This is known as blind pool risk. Secondaries mitigate blind pool risk by investing in existing commitments. In other words, investors know which assets they are acquiring, enhancing the potential for due diligence and providing visibility into potential future performance.
- "J-Curve” Mitigation: Secondaries allow the buyer to deploy capital immediately and gain exposure to mature assets. Holding periods for the underlying assets tend to be shorter than most primary capital commitments. Distribution activity can begin quickly, which in turn helps mitigate the J-curve, or apparent negative performance, earlier in a private capital fund’s life cycle.
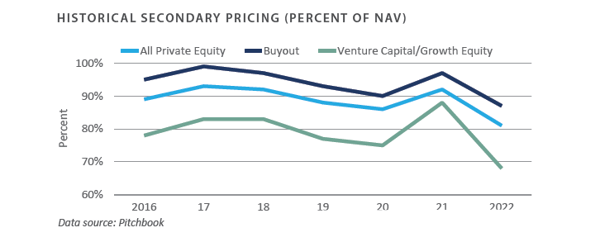
- Discounted Entry: Buyers can often purchase limited partnership interests at a discount to the investment’s current NAV. Per Jefferies, the average discount for private equity commitments has ranged between 7% and 20% over the last seven years.5 Due to their perceived higher risk profile, venture capital and growth equity strategies tend to price at deeper discounts than buyout funds. The increased valuation may provide buyers with additional downside protection when marked to market.
LOOKING FORWARD
Economic uncertainty, a hawkish Federal Reserve, and continued geopolitical tensions are expected to weigh heavily on liquidity in 2023. The sustained slowdown in distribution activity will likely fuel investor concerns about the denominator effect. As a result, overallocated investors may be forced to consider LP-led secondary sales to rebalance portfolios to targeted levels. Disagreements related to valuation may keep activity relatively muted in the near term; however, once annual audited valuations are complete, FEG expects bid-ask spreads to narrow and LP-led secondary deal making to increase.
GP-led transaction volume is likely to remain consistent throughout the year. There is increasing pressure for private capital sponsors with seasoned portfolios to generate liquidity. If public market volatility continues, weaker mergers and acquisitions and initial public offerings activities will likely persist. Sponsors reluctant or unable to fully exit portfolio companies may turn to the GP-led secondary market for an equitable solution.
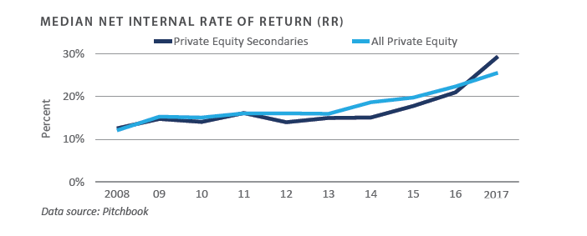
FEG believes the near-term economic environment provides compelling investment opportunities for buy-side participants in secondary transactions. Previous periods of prolonged market dislocations resulted in higher discounts for LP-led transactions, which means opportunistic buyers will likely be able to gain exposure to a diversified pool of high-performing assets at reasonably appealing valuations. The result should be attractive, risk-adjusted returns consistent with historical trends. Notably, since 2008, the median net IRR for private equity secondaries has been roughly in line with all private equity strategies.
FEG INVESTOR IMPLICATIONS
Every successful team needs a strong utility player; someone who can step up when things do not go as planned. For both GPs and LPs, the private capital secondaries can be a versatile utility player. Over the last two decades, the secondary market has matured to include a variety of structures that may provide liquidity solutions for various stakeholders. FEG encourages investors to include secondary strategies as part of a well-diversified portfolio. Under the right circumstances, secondaries can be an attractive, risk-adjusted complement to existing primary fund portfolios.
1, 3, 4 Jefferies; Global Secondary Market Review January 2023
2 Campbell Lutyens; Secondary Market Overview (December 2022)
5 Greenhill; Global Secondary Market Review August 2022
PRIVATE EQUITY
Venture Capital
- Venture capital fundraising and investment activity continued at elevated levels in 2022 despite the public market volatility in recent quarters. Exit activity ground to a halt as participants grappled with falling valuations. Anecdotally, venture capitalists indicate they are preparing companies for a very different economic environment in the coming years. There is also a greater emphasis on capital efficiency and profitability than the growth at all costs mindset in recent years.
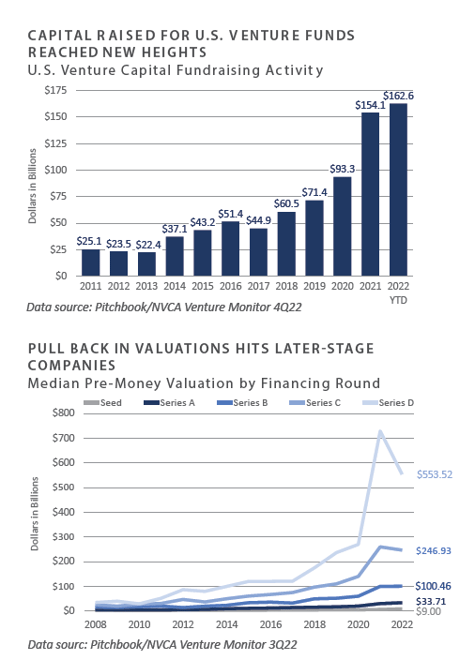
- U.S. venture funds raised $163 billion in 2022, exceeding the annual amount raised in 2021. Large funds drove the fundraising data, as funds with over $1 billion of assets accounted for more than half of the capital raised in 2022. Of the $163 billion raised, $121 billion (74%) occurred in the year’s first half. Fundraising slowed in the second half of the year as investors reacted to public market declines.
- Investment activity was robust in 2022, with over $238 billion invested across more than 15,800 companies. Similar to fundraising, however, investment activity fell sharply in the year’s second half. The $36.2 billion invested in the fourth quarter was less than half of the $79.8 billion invested in the first quarter.
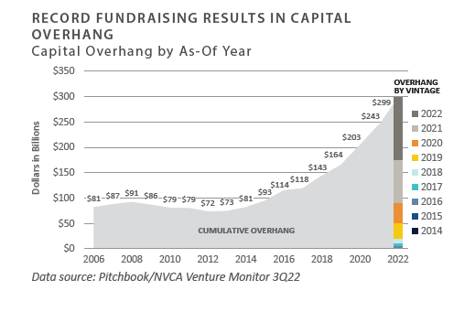
- Pre-money valuations have not yet fully reflected the new environment. Late-stage (Series D) valuations pulled back while other stages were flat or little changed. FEG expects valuations to trend lower as there is typically a lag in the private markets from the public market trends.
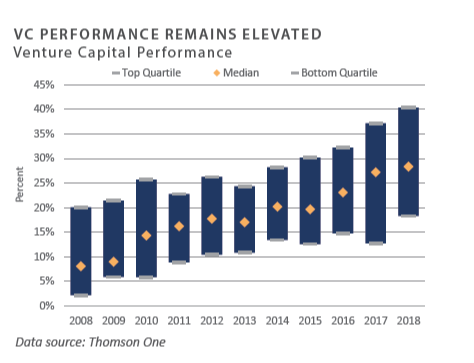
- The record amount of dry powder is a contributing factor in investment activity and high valuations. As of September 30, 2022, venture capital funds held $299 billion of uncalled capital, more than twice that of 2018.
- The pullback in 2022’s exit market was swift and robust. Exit activity reached its lowest level in a decade as the initial public offering (IPO) window shut.
- Venture performance through the third quarter was down from recent highs. FEG believes returns will likely be affected if exit markets remain closed and hold periods extend.
INVESTOR IMPLICATIONS
Given the high valuations and capital flows, we believe investors should be prepared for future volatility.
Leveraged Buyouts
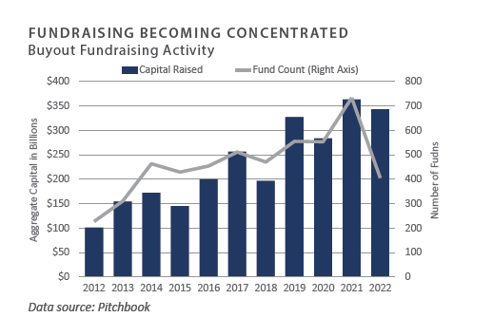
- Despite a fourth-quarter slowdown, U.S.- based private equity fundraising remained resilient last year. During 2022, private equity funds raised more than $343 billion, a decrease of only 5% from the prior year.1 However, fund counts fell 45% year- over-year, reflecting investors’ desire to concentrate fund commitments.2
- Deal activity fell during 2022. Year-over- year, annual deal value, and volume were down 19% and 2%, respectively.3 Fourth quarter deal value and volume were off 36% and 16%, respectively, relative to the same period last year.4 Add-on activity jumped to roughly 78% of overall transaction volume.5
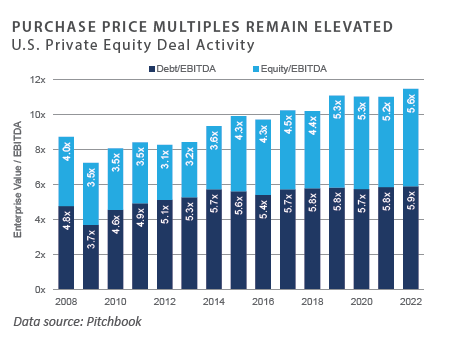
- Purchase prices remain at historically high levels. In 2022, the median U.S. private equity buyout purchase price multiple was 11.5x earnings before interest, taxes, depreciation, and amortization (EBITDA).6
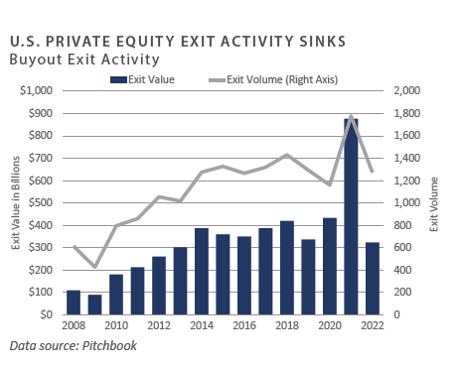
- Following record exit activity in 2021, year- over-year U.S. private equity exit value and volume fell 63% and 28%, respectively.7 Annualized volume was in line with historical averages. Trade sales to strategic or financial acquirers represented most of the U.S. private equity-backed exits by volume.8
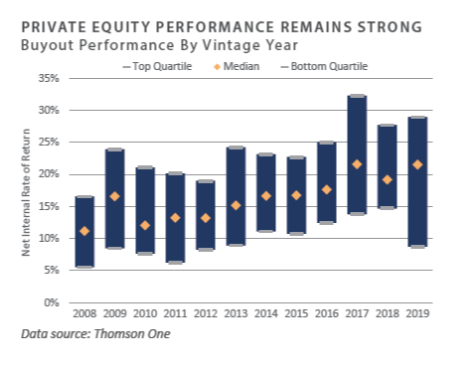
- Private equity performance was strong through the third quarter of 2022. Performance was disparate, with the spread between top quartile and bottom quartile performance above 1,000 basis points.9
INVESTOR IMPLICATIONS
Private equity activity is expected to slow in the coming year. Following an active fundraising year, dry powder levels remain elevated. FEG remains cautious with new private equity commitments in the near term.
1, 2, 3, 4, 5, 6, 7, 8 Pitchbook; Data of December 31, 2022 9 Refinitiv; Data as of September 30, 2022 (Most Recent Available)
9 Refinitiv; Data as of September 30, 2022 (Most Recent Available)
Private Debt
-
The fourth quarter of 2022 saw a rally in the public credit markets, with high yield bonds gaining 4% and bank loans gaining 3%. The rally was insufficient to offset a full-year decline of approximately 11% for high yield bonds. Bank loans gained 0.7% for the year, which proved to be one of the few bright spots in the market in 2022.1
-
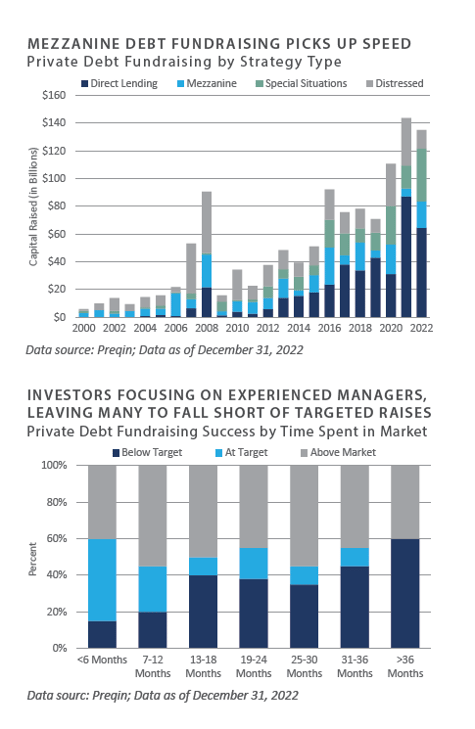
Market volatility and economic uncertainty have managers planning to raise distressed debt funds, but 2022 was soft in terms of actual funds raised versus 2020-2021. Undeployed capital raised for distressed in these years continues to slow the formation of new funds, as dry powder is waiting to be put to work.2
-
Mezzanine debt saw new highs for fundraising, according to Preqin, capturing more than $43.5 billion through the third quarter of 2022, exceeding calendar year figures for each year since 2001. Investors were attracted to higher risk/ reward strategies, such as mezzanine debt, given the potential need for fresh capital in an economic downturn.3
-
Market uncertainty has led to bifurcation among managers as investors focus on in- demand managers who raise or exceed their targets. Many of these managers have shown strong performance and are benefitting from re-ups. In contrast, others deal with fundraising headwinds in the private debt space, with many coming in below their target—particularly those in the 31-to-36-month category and beyond.4
INVESTOR IMPLICATIONS
Private debt investors are favoring experienced managers and choosing to re-up with proven winners. Distressed debt managers continue to come to market, but they face a backlog of dry powder ready to be deployed on periods of weakness in 2023.
1 Bloomberg High Yield Index and CSFB Leveraged Loan Index
2, 3, 4 Preqin Global Report 2023: Private Debt
PRIVATE REAL ESTATE
-
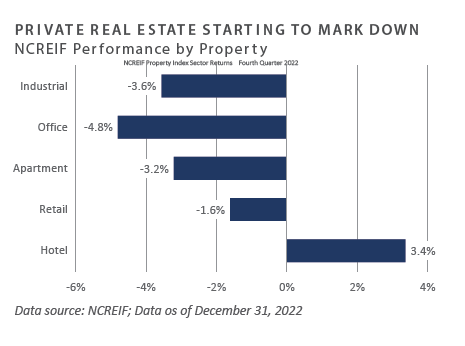
The National Council of Real Estate Investment Fiduciaries (NCREIF) Property Index (NPI) declined 3.5% during the fourth quarter. This followed a slight gain of 0.6% in the third quarter.
-
Hotel properties continued to benefit from higher occupancy rates and were the only sector with positive returns in the index. Conversely, office properties continued to decline in the face of headwinds from remote working trends and high vacancy rates.
-
Market value-weighted capitalization rates for the index rose slightly during the quarter to 4.3%, compared to 3.8% in the prior quarter. Net operating income growth, however, saw a 2.1% increase for the quarter, up from a slight decline in the prior quarter.1
-
One of the most notable trends in real estate during 2022 was the vast disparity between the performance of public and private markets. As measured by the FTSE NAREIT Index, public real estate securities declined 25% for the year compared to a positive return for the NCREIF Property Index.2 This trend was most apparent in the performance of industrial REITs, which declined 28.6% for the year, compared to a gain of 14.6% for the industrial portion of the NCREIF Property Index.3 This disparity likely portends declines in private market valuations over the coming quarters.
-
Transaction volume declined 35% year-over- year from $366 billion in 2021 to $235 billion in 2022. The rapid rise in interest rates led to wide spreads between expectations of buyers and sellers of commercial real estate, with many deals retrading based on shifting return expectations and the lack of available financing.4
- Private equity real estate funds raised approximately $167 billion in 2022, a significant decline compared to 2021, when fundraising totaled $214 billion. The number of funds closed also declined year-over-year from 594 in 2021 to 376 in 2022.5 Funds in the market, however, remained at a record high, with 1,179 funds seeking to raise $512 billion as of January 2023.
-
Availability of credit for commercial real estate tightened significantly through the second half of 2022. Total commercial mortgage-backed security (CMBS) issuance dropped approximately 36%, reaching $70 billion in 2022 compared to $109 billion in 2021.6 Banks continue to lend on multifamily and industrial properties; however, financing for office properties is limited or unavailable.
INVESTOR IMPLICATIONS
Heading into 2023, investors will likely be assessing year-end valuations as a barometer for the direction of the property market. The impact of higher interest rates will remain front and center, with debt maturities a key concern for property owners with floating rate debt. While key real estate metrics— i.e., net operating income and occupancies—remain stable for most property types, a slowdown is underway, and the decade-plus bull market has ended. FEG believes the availability of capital in the form of dry powder to be deployed in private real estate should put a floor on valuations and limit widespread distress in the market.
1 NCREIF; Data of December 31, 2022
2 NCREIT; Data of December 31, 2022
3 NCREIT and NCREIF; Data of December 31, 2022
4, 5 Preqin; Data as of December 31, 2022
6 Trepp, January 2023
NATURAL RESOURCES
-
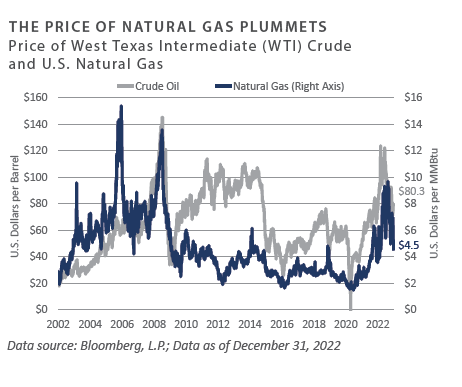
Oil prices rose only 1% during the fourth quarter, closing at $80.26/barrel, compared to $79.50/barrel at the end of the third quarter. For the full year, oil prices rose 6.9%. After reaching a record high of approximately $120/barrel following the Russian invasion of Ukraine, oil prices fell during the year’s second half on concerns about slower global economic growth.1
-
Nevertheless, in January 2023, the International Energy Agency released a forecast for global oil demand to reach an all-time high of 101.7 million barrels per day. The gain is expected to be driven partly by demand from China as the country eases COVID lockdowns.2 Releases from the Strategic Petroleum Reserve heading into the midterm elections also put downward pressure on prices. U.S. oil and gas companies remain reluctant to pursue new drilling, in part due to pressure from shareholders to return capital in the form of dividends and share buybacks.
-
Natural gas prices fell 34% in the fourth quarter, closing at $4.48/MMBtu, but gained approximately 20% over the entire year. European sanctions due to the Russia- Ukraine War were a significant factor driving natural gas prices during the year. By late summer, natural gas prices traded above $9/MMBtu—a multi-year high—but fell through the fourth quarter due to growing supplies in the U.S. and warmer weather.3
-
The most notable trend in the fourth quarter was the return of private equity energy managers to the market, launching funds targeting upstream investments in an effort to capitalize on the recovery in the broad energy sector. The ability of these managers to raise new capital will be a key indicator of the appetite among institutional investors for upstream energy funds, which has been limited by fossil fuel divestment initiatives and a focus on renewables or energy transition strategies.4
-
According to Baker Hughes, the U.S. natural gas rig count finished the quarter at 156, down slightly from 159 at the end of the third quarter. The U.S. oil rig count rose 2.6% over the quarter to 620, compared to 604 rigs at the end of the third quarter. As a frame of reference, the U.S. oil rig count peaked at 1,600 in the fall of 2014. Rig counts reflect the reluctance of energy companies to increase capital expenditures despite higher commodity prices.5
INVESTOR IMPLICATIONS
While there are indications that some investors may be open to considering allocations to traditional upstream private energy into 2023, uncertainty remains. This is due in part to the “denominator effect,” in which the improvement in the performance of private energy has ironically led to some investors being overweight relative to their targets. Energy remains one of the only sectors in the private capital landscape that has not seen significant inflows. The ongoing focus remains on energy transition, and investors continue to divest from fossil fuels. This is also the case in the public markets. Despite the S&P 500 Energy sector gaining 65% in 2022, fund flows from public equity investors have been limited relative to other sectors, such as information technology.
1, 3, 4 Energy Information Administration, www.eia.gov, December 31, 2022
2 International Energy Agency, January 2023
5 Baker Hughes; Data of December 31, 2022
INDICES
Bloomberg US Corporate High Yield Index represents the universe of fixed rate, non-investment grade debt. Eurobonds and debt issues from countries designated as emerging markets are excluded, but Canadian and global bonds (SEC registered) of issuers in non-EMG countries are included. The index includes the corporate sectors: Industrials, Utilities, and Finance, encompassing both U.S. and non-U.S. Corporations. See www.bloomberg.com for more information.
The Russell Indices are constructed by Russell Investment. There are a wide range of indices created by Russell covering companies with different market capitalizations, fundamental characteristics, and style tilts. See www.russellinvestments.com for more information.
The FTSE NAREIT Composite Index (NAREIT) includes only those companies that meet minimum size, liquidity and free float criteria as set forth by FTSE and is meant as a broad representation of publicly traded REIT securities in the U.S. Relevant real estate activities are defined as the ownership, disposure, and development of income-producing real estate. See www.ftse.com/Indices for more information.
The S&P 500 Index is capitalization-weighted index of 500 stocks. The S&P 500 Index is designed to measure performance of the broad domestic economy through changes in the aggregate market value of 500 stocks representing all major industries.
The NCREIF Property Index is a quarterly time series composite total rate of return measure of investment performance of a very large pool of individual commercial real estate properties acquired in the private market for investment purposes only.
HFRI ED: Distressed/Restructuring Index — Distressed/Restructuring strategies which employ an investment process focused on corporate fixed income instruments, primarily on corporate credit instruments of companies trading at significant discounts to their value at issuance or obliged (par value) at maturity as a result of either formal bankruptcy proceeding or financial market perception of near term proceedings. Managers are typically actively involved with the management of these companies, frequently involved on creditors' committees in negotiating the exchange of securities for alternative obligations, either swaps of debt, equity or hybrid securities. Managers employ fundamental credit processes focused on valuation and asset coverage of securities of distressed firms; in most cases portfolio exposures are concentrated in instruments which are publicly traded, in some cases actively and in others under reduced liquidity but in general for which a reasonable public market exists. In contrast to Special Situations, Distressed Strategies employ primarily debt (greater than 60%) but also may maintain related equity exposure.
Information on any indices mentioned can be obtained either through your advisor or by written request to information@feg.com.
DISCLOSURES
This report was prepared by Fund Evaluation Group, LLC (FEG), a federally registered investment adviser under the Investment Advisers Act of 1940, as amended, providing non-discretionary and discretionary investment advice to its clients on an individual basis. Registration as an investment adviser does not imply a certain level of skill or training. The oral and written communications of an adviser provide you with information about which you determine to hire or retain an adviser. Fund Evaluation Group, LLC, Form ADV Part 2A & 2B can be obtained by written request directly to: Fund Evaluation Group, LLC, 201 East Fifth Street, Suite 1600, Cincinnati, OH 45202, Attention: Compliance Department.
The information herein was obtained from various sources. FEG does not guarantee the accuracy or completeness of such information provided by third parties. The information in this report is given as of the date indicated and believed to be reliable. FEG assumes no obligation to update this information, or to advise on further developments relating to it. FEG, its affiliates, directors, officers, employees, employee benefit programs and client accounts may have a long position in any securities of issuers discussed in this report.
Index performance results do not represent any managed portfolio returns. An investor cannot invest directly in a presented index, as an investment vehicle replicating an index would be required. An index does not charge management fees or brokerage expenses, and no such fees or expenses were deducted from the performance shown.
Bloomberg Data Disclosure: Source- Bloomberg Index Services Limited. BLOOMBERG® is a trademark and service mark of Bloomberg Finance L.P. and its affiliates (collectively “Bloomberg”). Bloomberg or Bloomberg’s licensors own all proprietary rights in the Bloomberg Indices. Bloomberg does not approve or endorse this material or guarantee the accuracy or completeness of any information herein, nor does Bloomberg make any warranty, express or implied, as to the results to be obtained therefrom, and, to the maximum extent allowed by law, Bloomberg shall not have any liability or responsibility for injury or damages arising in connection therewith.
Neither the information nor any opinion expressed in this report constitutes an offer, or an invitation to make an offer, to buy or sell any securities.
Any return expectations provided are not intended as, and must not be regarded as, a representation, warranty or predication that the investment will achieve any particular rate of return over any particular time period or that investors will not incur losses.
Past performance is not indicative of future results.
Investments in private funds are speculative, involve a high degree of risk, and are designed for sophisticated investors.
An investor could lose all or a substantial amount of his or her investment. Private capital funds’ fees and expenses may offset private capital funds’ profits. Private capital funds are not required to provide periodic pricing or valuation information to investors except as defined in the fund documents. Private capital funds may involve complex tax structures and delays in distributing important tax information. Private capital funds are not subject to the same regulatory requirements as mutual funds. Private capital funds are not liquid and require investors to commit to funding capital calls over a period of several years; any default on a capital call may result in substantial penalties and/or legal action. Private capital fund managers have total authority over the private capital funds. The use of a single advisor applying similar strategies could mean lack of diversification and, consequently, higher risk.
All data is as of September 30, 2022 unless otherwise noted.