


-01.webp?width=400)


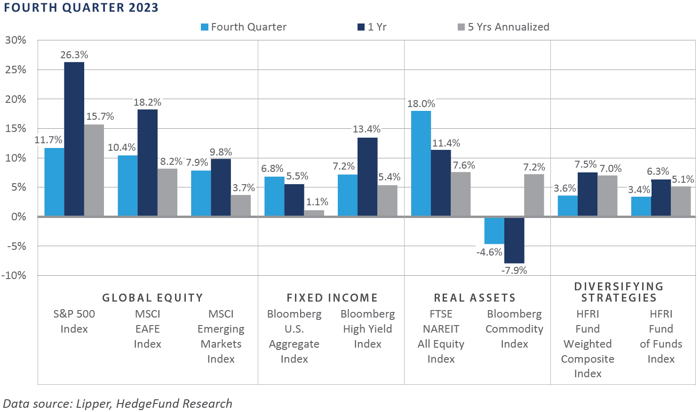
Strong performance tailwinds that supported the financial markets in November persisted in December, punctuating a year marked by performance gains out of nearly every asset class and category. With the worst cyclical inflationary pressures likely in the rearview mirror, market participants embraced the Federal Reserve’s (Fed) mid-December implicit confirmation of an anticipated easing in its current restrictive stance. Across the equity markets, small capitalization U.S. stocks outperformed their larger cap counterparts in the fourth quarter. While positive in absolute terms, both international developed and emerging market equity gains underperformed domestic in the quarter, despite a meaningful move lower in the U.S. dollar in the year’s final two months. After appearing on the verge of posting an unprecedented third consecutive calendar year decline, core bond returns rallied during the quarter, with the Bloomberg U.S. Aggregate Bond Index notching a 6.8% total return in the fourth quarter and a 5.5% gain for 2023. Similar to the equity and bond markets, real asset returns were generally positive, particularly for the interest-rate-sensitive real estate sector. In contrast, commodity futures faced performance headwinds amid global growth uncertainty.
Economic Update
Fed Gives Nod to Bond Market Positioning Suggesting Near-Term Easing Bias
A prevailing theme throughout 2023 was the growing narrative that the Fed has potentially successfully achieved its “soft landing,” as inflation cooled from multi-decade high levels, the economy expanded at a healthy pace throughout the year, interest rates moved sharply lower in the final two months of the year, and the labor market has yet to display obvious signs of deterioration. Against this backdrop, the Fed’s final policy meeting of the year on December 12-13 provided those in the soft landing camp with subtle confirmation the Fed indeed is on the path towards a less-restrictive policy stance.
As discounted by the bond market leading up to the Fed meeting, the Fed kept the policy rate level in the range of 5.25% to 5.50%— a level first reached during the current tightening cycle in July— while also updating its summary of economic projections to reflect a policy rate projection that implied 75 basis points of rate cuts throughout 2024. The formal acknowledgement by the Fed that the current restrictive policy stance is likely unwarranted in the coming months added a policy expectation tailwind to an already upward-trending equity market, the rally of which saw U.S. large cap equities (S&P 500 Index) ascend to a fresh record nominal high on a total return index level basis, established December 28.
While on the surface it appears the U.S. has entered a goldilocks environment, one characterized by recent robust financial market performance, cooling inflationary pressures, moderating interest rates, solid economic growth, and a resilient labor market, a forensic analysis is not necessary to ascertain the economic gains generated in 2023 came with an asterisk.
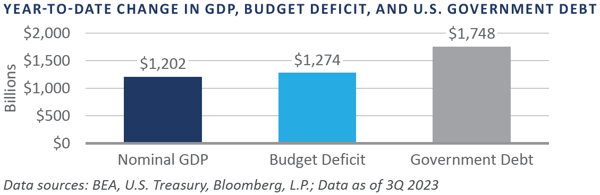
The latest updates to gross domestic product (GDP) through the third quarter showed that in the first nine months of the year, the U.S. economy grew an impressive $1.2 trillion in nominal dollars, from $26.4 trillion at the end of 2022 to $27.6 trillion as of the third quarter 2023. Unfortunately, this prosperity came at the expense of digging an even deeper fiscal hole, as the Treasury budget deficit widened nearly $1.3 trillion and the government’s debt burden ballooned more than $1.7 trillion. The two are, of course, related.
While headline measures of the U.S. economy displayed a remarkable amount of resiliency in the face significant Fed monetary restraint in 2023, the expense of generating this growth not only required digging a deeper fiscal hole, but also came with a higher price tag, as the Fed’s task of quelling inflation required hiking the federal funds rate to the highest level in more than two decades.
In summary, unlike 2022, performance across the majority of global investment markets appeared notably strong in 2023, with the U.S. economy shrugging off a further tightening in monetary conditions by the Fed and displaying economic leadership on the global stage. Underneath the hood, however, this fortune appears to have been produced by plunging deeper into the fiscal abyss. The longer-run implications of this move will likely demand investors’ attention for the foreseeable future.
Market Summary
Global Equity
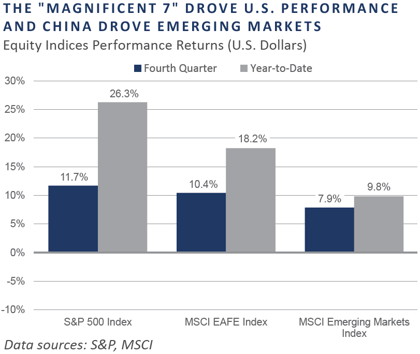
Global equity markets finished the fourth quarter with a strong rally. The U.S. equity market was a top performer against the developed and emerging markets indices.
Throughout 2023, the U.S. equity market was consistently impacted by top-down influences. Most significant was the expectation of a Fed pivot to a less hawkish monetary policy. In December, equities rallied in response to a more dovish tone from the Fed, which led the market to expect multiple interest rate cuts next year.
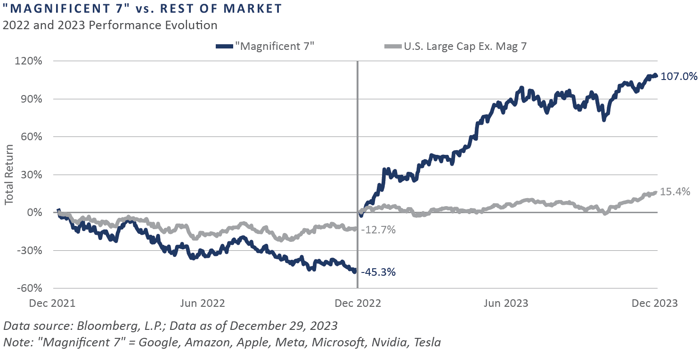
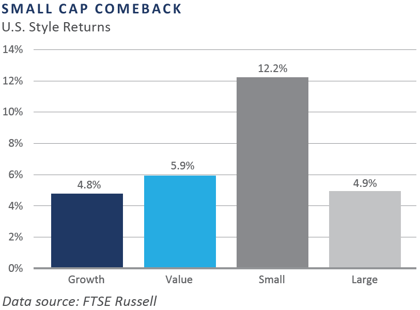
The late-year rally benefited interest rate-sensitive sectors like real estate and information technology, which were up over 17% in the fourth quarter. While these sectors benefited most, the rally showed breadth relative to most of 2023, in which performance was driven heavily by the top-performing mega-cap stocks. Over the quarter, however, small caps outperformed large caps across both growth and value styles and more than doubled the performance of large cap during December’s rally.
European equities finished the quarter higher. Like the U.S., real estate and information technology were the top-performing sectors. Economically sensitive sectors like industrials and materials performed well as annual inflation fell to 2.4%. The United Kingdom similarly benefited from falling inflation. The decline of the U.S. dollar against both the euro and the pound was particularly beneficial to U.S. investors, contributing materially to international equity returns in dollar terms.
Japanese stocks produced positive returns but underperformed the MSCI EAFE Index. Even more dramatically than in Europe, U.S. dollar investors experienced a significant tailwind as the dollar weakened against the yen, almost quadrupling Japan’s local currency return.
Emerging market equity returns were positive but underperformed developed markets. Chinese equities were the primary cause of underperformance as weak economic conditions weighed on Chinese equities throughout 2023. Taiwan, South Korea, and India were the strongest- performing markets in the fourth quarter. Technology and semiconductor stocks continued to appreciate as the theme of artificial intelligence remains a catalyst for outperformance.
Fixed Income
In the fourth quarter, interest rates reverted considerably, rallying on anticipated rate cuts. The long and intermediate segments of the yield curve fell in tandem. The 2-year and 10-year Treasury yields fell 0.80% and 0.72% to 4.23% and 3.88%, respectively. Continuing with this theme, the 30-year Treasury fell nearly 75 bps to 4.09%, highlighting the magnitude of the rally throughout the yield curve.
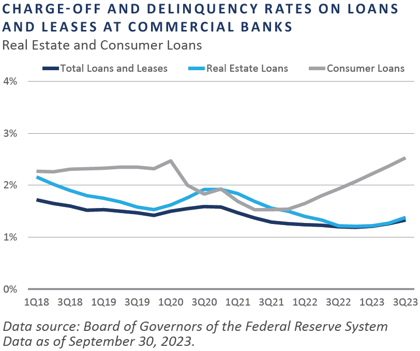
Correlations between equities and fixed income remained high as the curve continued to move in line with equities. The higher-for-longer narrative quickly changed in the fourth quarter, as the soft-landing narrative gained further traction, triggering spread compression. However, delinquency rates for real estate and consumer loans rose modestly from the second quarter to the third quarter. Of particular concern, credit card delinquencies hit their highest level since the first quarter of 2012.
As rates fell, risk appetites rose. High yield corporate spreads, already tight by historical standards, tightened to below 3.5 percentage points. This is the tightest high yield spread since the beginning of the second quarter of 2022 and similar to pre-pandemic levels. This left the HY yield- to-worst (YTW) at 7.7% to end the year, as base rates fell with the declining credit spread. For comparison, the investment grade YTW sits at 5.2%.
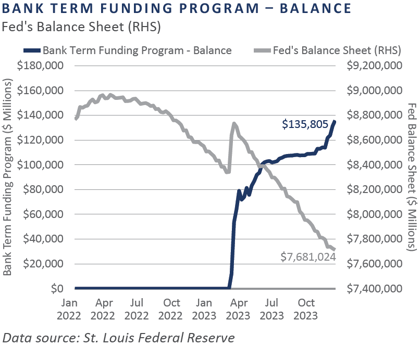
As desired by the Fed, their quantitative tightening (QT) program has steadily played out in the background. Securities holdings at the Fed peaked in mid-2022 at roughly $5.8 trillion and decreased roughly $1 trillion through the end of September.
Real Assets
REAL ESTATE
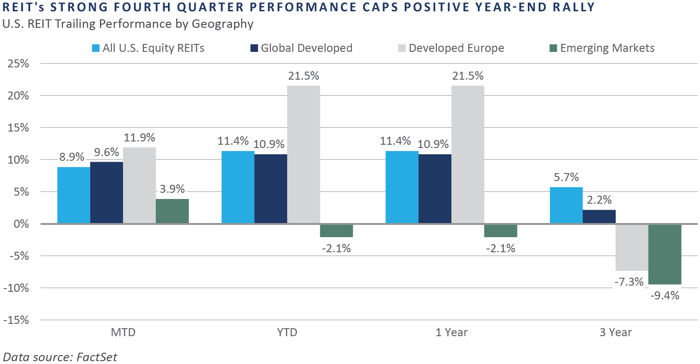
U.S. and global Real Estate Investment Trusts (REITs) rebounded strongly in December following Federal Reserve Chairman Jerome Powell's announcement that the Fed will likely issue interest rate cuts in 2024. Until the announcement of potential cuts, higher interest rates had negatively impacted REITs from 2022 through 2023.
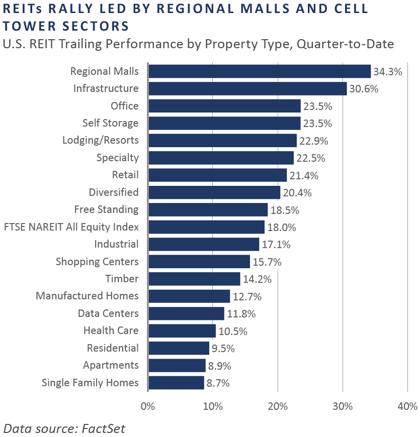
Both global and U.S. REITs underperformed the broader equity markets in 2023 despite the market-leading rebound in the fourth quarter. U.S. REITs returned nearly 18% during the quarter, measured by the FTSE NAREIT All Equity Index, and Global REITs returned 15.6%, measured by the FTSE EPRA/NAREIT Developed Index. The regional malls and infrastructure REIT sectors were the top-performing sectors during the fourth quarter, while data centers led for the year.
NATURAL RESOURCES
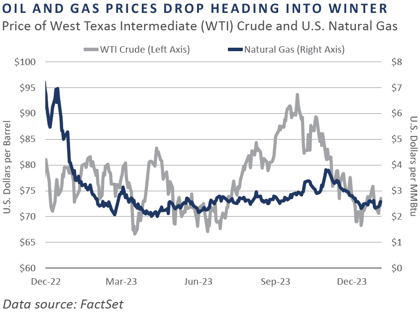
Oil prices, as measured by West Texas Intermediate (WTI), declined roughly 5% in December. Despite Houthis attacks on cargo vessels in the Red Sea and increased geopolitical tension in the Middle East, global oil prices declined during the fourth quarter. U.S. crude oil production remained strong, driven by productivity gains and efficient operations, even as producers took rigs offline. Mergers and acquisitions activity also remained strong, with Occidental Petroleum acquiring Crown Rock for $12 billion in December.
INFRASTRUCTURE
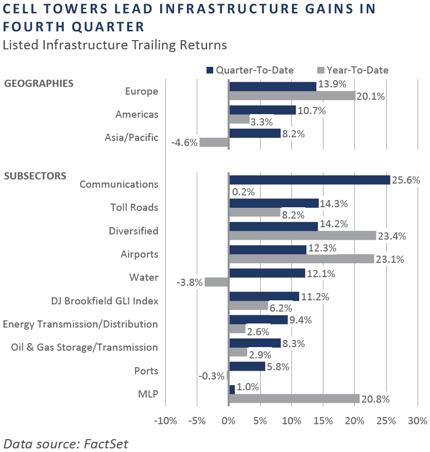
Global infrastructure rallied in December, as measured by the Dow Jones Brookfield Global Infrastructure Index. The sector experienced poor performance throughout 2023 as it was viewed as less attractive relative to other yield-focused securities. Powell’s announcement of potential rate cuts in 2024 drew attention back to the sector, however, and the index finished the year up roughly 6%.
Midstream energy was a standout in 2023, up more than 26% as measured by the Alerian MLP Index. Midstream companies had strong performance due to their ability to generate free cash flow and return excess cash to investors through dividends and stock repurchases.
Diversifying Strategies
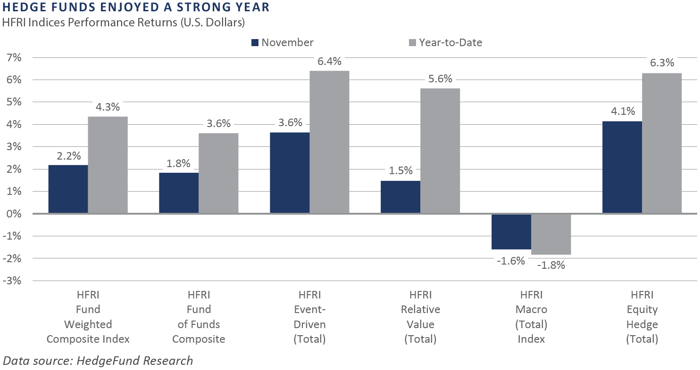
Hedge funds, outside of global macro, produced strong gains across most strategies during the fourth quarter. Equity hedge and event-driven approaches were the best performers.
Hedge fund strategies ended the year on a high note due to a combination of strong tailwinds, including falling inflation, improving mergers and acquisitions, and the general economic outlook for the upcoming year.
Systematic trend-following strategies faced continued trend reversals across asset classes, most notably within currencies and commodities. Weakness in the U.S. dollar was a key contributor to losses within foreign exchange markets. Broadly, uncertainty triggered by dynamic economic data, including inflation and rate expectations, resulted in a lack of clarity for numerous assets.
INDICES
The Alerian MLP Index is a composite of the 50 most prominent energy Master Limited Partnerships that provides investors with an unbiased, comprehensive benchmark for this emerging asset class.
Bloomberg Fixed Income Indices is an index family comprised of the Bloomberg US Aggregate Index, Government/Corporate Bond Index, Mortgage-Backed Securities Index, and Asset-Backed Securities Index, Municipal Index, High-Yield Index, Commodity Index and others designed to represent the broad fixed income markets and sectors. On August 24, 2016, Bloomberg acquired these long-standing assets from Barclays Bank PLC. and on August 24, 2021, they were rebranded as the Bloomberg Fixed Income Indices. See https://www.bloomberg.com/markets/rates-bonds/bloomberg-fixed-income-indices for more information.
The CBOE Volatility Index (VIX) is an up-to-the-minute market estimate of expected volatility that is calculated by using real-time S&P 500 Index option bid/ask quotes. The Index uses nearby and second nearby options with at least eight days left to expiration and then weights them to yield a constant, 30-day measure of the expected volatility of the S&P 500 Index.
FTSE Real Estate Indices (NAREIT Index and EPRA/NAREIT Index) includes only those companies that meet minimum size, liquidity and free float criteria as set forth by FTSE and is meant as a broad representation of publicly traded real estate securities. Relevant real estate activities are defined as the ownership, disposure, and development of income-producing real estate. See https://www.ftserussell.com/index/category/real-estate for more information.
HFRI Monthly Indices (HFRI) are equally weighted performance indexes, compiled by Hedge Fund Research Inc. (HFX), and are used by numerous hedge fund managers as a benchmark for their own hedge funds. The HFRI are broken down into 37 different categories by strategy, including the HFRI Fund Weighted Composite, which accounts for over 2,000 funds listed on the internal HFR Database. The HFRI Fund of Funds Composite Index is an equal weighted, net of fee, index composed of approximately 800 fund- of- funds which report to HFR. See www.hedgefundresearch.com for more information on index construction.
J.P. Morgan’s Global Index Research group produces proprietary index products that track emerging markets, government debt, and corporate debt asset classes. Some of these indices include the JPMorgan Emerging Market Bond Plus Index, JPMorgan Emerging Market Local Plus Index, JPMorgan Global Bond Non-U.S. Index and JPMorgan Global Bond Non-U.S. Index. See www.jpmorgan.com for more information.
Merrill Lynch high yield indices measure the performance of securities that pay interest in cash and have a credit rating of below investment grade. Merrill Lynch uses a composite of Fitch Ratings, Moody’s and Standard and Poor’s credit ratings in selecting bonds for these indices. These ratings measure the risk that the bond issuer will fail to pay interest or to repay principal in full. See www.ml.com for more information.
Morgan Stanley Capital International – MSCI is a series of indices constructed by Morgan Stanley to help institutional investors benchmark their returns. There are a wide range of indices created by Morgan Stanley covering a multitude of developed and emerging economies and economic sectors. See www.morganstanley.com for more information.
The FTSE Nareit All Equity REITs Index is a free-float adjusted, market capitalization-weighted index of U.S. equity REITs.
Russell Investments rank U.S. common stocks from largest to smallest market capitalization at each annual reconstitution period (May 31). The primary Russell Indices are defined as follows: 1) the top 3,000 stocks become the Russell 3000 Index, 2) the largest 1,000 stocks become the Russell 1000 Index, 3) the smallest 800 stocks in the Russell 1000 Index become the Russell Midcap index, 4) the next 2,000 stocks become the Russell 2000 Index, 5) the smallest 1,000 in the Russell 2000 Index plus the next smallest 1,000 comprise the Russell Microcap Index, and 6) U.S. Equity REITs comprise the FTSE Nareit All Equity REIT Index. See www.russell.com for more information.
S&P 500 Index consists of 500 stocks chosen for market size, liquidity and industry group representation, among other factors by the S&P Index Committee, which is a team of analysts and economists at Standard and Poor’s. The S&P 500 is a market-value weighted index, which means each stock’s weight in the index is proportionate to its market value and is designed to be a leading indicator of U.S. equities, and meant to reflect the risk/return characteristics of the large cap universe. See www.standardandpoors.com for more information.
Information on any indices mentioned can be obtained either through your advisor or by written request to information@feg.com.
DISCLOSURES
This report was prepared by FEG (also known as Fund Evaluation Group, LLC), a federally registered investment adviser under the Investment Advisers Act of 1940, as amended, providing non-discretionary and discretionary investment advice to its clients on an individual basis. Registration as an investment adviser does not imply a certain level of skill or training. The oral and written communications of an adviser provide you with information about which you determine to hire or retain an adviser. Fund Evaluation Group, LLC, Form ADV Part 2A & 2B can be obtained by written request directly to: Fund Evaluation Group, LLC, 201 East Fifth Street, Suite 1600, Cincinnati, OH 45202, Attention: Compliance Department.
The information herein was obtained from various sources. FEG does not guarantee the accuracy or completeness of such information provided by third parties. The information in this report is given as of the date indicated and believed to be reliable. FEG assumes no obligation to update this information, or to advise on further developments relating to it. FEG, its affiliates, directors, officers, employees, employee benefit programs and client accounts may have a long position in any securities of issuers discussed in this report.
Index performance results do not represent any managed portfolio returns. An investor cannot invest directly in a presented index, as an investment vehicle replicating an index would be required. An index does not charge management fees or brokerage expenses, and no such fees or expenses were deducted from the performance shown.
Bloomberg Index Services Limited. BLOOMBERG® is a trademark and service mark of Bloomberg Finance L.P. and its affiliates (collectively “Bloomberg”). Bloomberg or Bloomberg’s licensors own all proprietary rights in the Bloomberg Indices. Bloomberg does not approve or endorse this material or guarantee the accuracy or completeness of any information herein, nor does Bloomberg make any warranty, express or implied, as to the results to be obtained therefrom, and, to the maximum extent allowed by law, Bloomberg shall not have any liability or responsibility for injury or damages arising in connection therewith.
Neither the information nor any opinion expressed in this report constitutes an offer, or an invitation to make an offer, to buy or sell any securities.
Any return expectations provided are not intended as, and must not be regarded as, a representation, warranty or predication that the investment will achieve any particular rate of return over any particular time period or that investors will not incur losses.
Past performance is not indicative of future results.
Investments in private funds are speculative, involve a high degree of risk, and are designed for sophisticated investors.
All data is as of December 31, 2023 unless otherwise noted.