The Great Reset - Implications for Private Debt
In October, FEG penned an insight piece titled “Interest Rates and The Great Reset” which discussed the significance of the increase in 10-year U.S. Treasury yields relative to the “Great Bond Massacre” of 1994. To summarize key points from that missive, by October of this year, the increase in the 10-year U.S. Treasury had reached 83 basis points above the full year increase in 1994. Higher coupons in 1994 buttressed fixed income investors via interest income, leading to a decline of just 2.9% for the Bloomberg U.S. Aggregate Bond Index (BAGG).
In comparison, 2022 has been a much more challenging environment, due in part to low starting coupons. The sharp increase in rates year-to-date has led to a BAGG decline of almost 16% through October after the U.S. 10-year Treasury yield peaked mid-month. With the BAGG set for a decline of more than six times that of the Great Bond Massacre and given the significance of the 10-year U.S. Treasury yield as a key reference rate for pricing of risky assets, it makes sense to consider the implications of the Great Reset on the private debt markets, both distressed debt and private lending.
Distressed debt strategies tend to invest in bank loans and high yield bonds as their primary entry point. With interest rates rising, bank loan prices reset from near par at the beginning of 2022 to the low 90s at the end of October. Because loans are floating rate instruments with coupons tied to a spread to the Secured Overnight Financing Rate (SOFR), higher short-term rates, which are controlled by the Federal Reserve, have offset price declines in the loan market, leading to a loss for the S&P/LSTA Leveraged Loan Index of ~2%. While down for the year, the decline in loans is a bright spot relative to what has been experienced in the high yield bond market, which had declined 12.4% through the end of October. Fixed rate coupons of ~5.4% for high yield bonds as an asset class have not provided enough income to offset the reset in high yield bond prices, which fell to the low $80s.
DISTRESSED DEBT
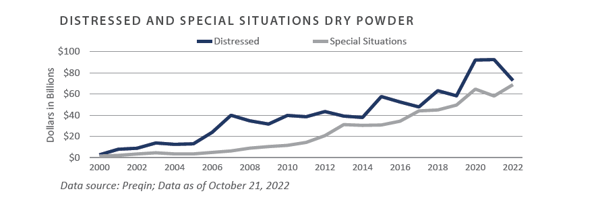
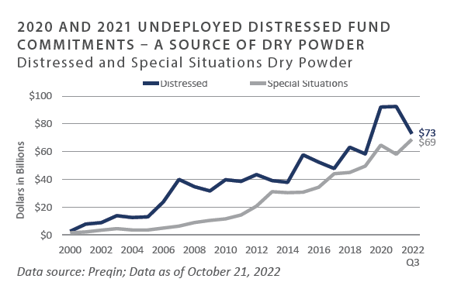
Like sharks, distressed investors smell blood in the water. Led by a hawkish Federal Reserve determined to bring inflation under control through demand destruction, market volatility in 2022 resulted in lower prices for risk assets. Macro uncertainty due to the lingering Russia-Ukraine war, concerns regarding China and Taiwan, and the U.S. mid-term elections have all cast a cloud over markets. These issues have driven managers to come to the market with new distressed funds, with the velocity of this activity accelerating over the summer. Preqin places
existing distressed dry powder at approximately $70 billion. This number includes both new funds being raised and undeployed capital raised for distressed opportunities in 2020 and 2021. While $70 billion is a large number, within the context of a $3 trillion market for bank loans and high yield bonds, this sum could easily be overwhelmed by another repricing of risk assets if the economy further contracts.
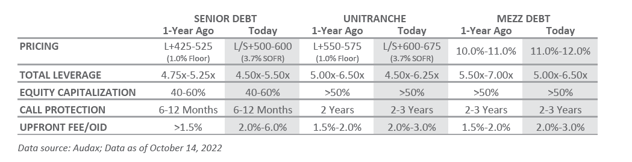
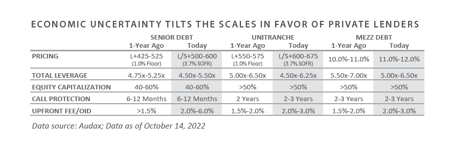
Although not directly tied to the public credit markets, private lending—roughly 85% of which is floating rate—is directly impacted by higher short-term rates and rising SOFR. There is a good news/bad news element in play for private lending amid the higher short-term rate/late credit cycle theme currently in play in the markets. On the good news side, private lenders with new funds that have not yet committed to many deals are in a strong position, as they can lend at higher rates—which means better pricing—and they can also secure lower leverage points, better call protection, higher upfront fees, and tighter covenants.
The bad news side for private lenders involves fully invested funds where the manager must now weather late-cycle elements or possibly a recession, which could lead to higher default risk for companies in their portfolios. This can act as a distraction for managers in terms of putting out new loans, as they may need to become more active with existing borrowers. A byproduct of late-cycle or recessionary issues facing existing funds is the lengthening of exits, which tends to negatively impact the internal rates of return (IRRs) for these funds. This impact has been witnessed through multiple cycles, and while IRRs tend to experience weakness for those vintages impacted by recession, the multiples of invested capital (MOICs) tend to hold up over time.
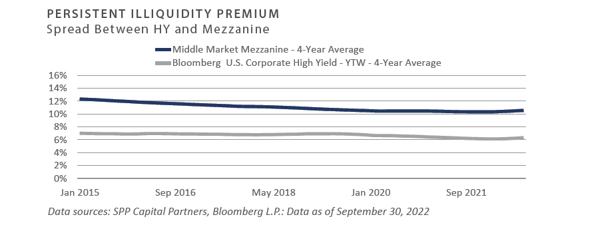
Dialogue with clients and advisors over the years has revealed that there are points in time when spreads on public credit trade tight with private loans, leading investors to consider allocating to distressed debt over new private lending funds. There is no perfect answer regarding either of these choices. On the one hand, it is critical to allocate to a distressed debt manager prior to a meaningful dislocation in public credit markets, as failure to do so can lead to return-chasing if the bottom in prices has been put in. On the other hand, these environments often create attractive entry points for private lenders to provide fresh capital to companies. Given the longer
investment periods of private lenders and the use of mezzanine debt as a proxy, FEG uses a rolling four-year average to show the persistence of the illiquidity premium for mezzanine debt strategies over time, regardless of entry point.
CONCLUSION
The Great Reset of 2022 has had a meaningful impact on private debt markets. Lower prices for bank loans and high yield bonds have ushered in a wave of new distressed debt funds as managers look to build war chests for a potential downturn. On the private lending side, managers with fresh capital to deploy to companies can secure better terms and pricing than a year ago, but fully invested portfolios may struggle as companies experience downward pressure on earnings, should the cycle turn lower, negatively impacting fund IRRs. While the markets may be approaching juncture in which spreads narrow between public and private credit and investors may opt for distressed debt over mezzanine debt, it is worth noting that the persistent illiquidity premium for mezzanine debt augurs well for allocating to either style of private debt manager in the current environment.
Private Equity
Venture Capital
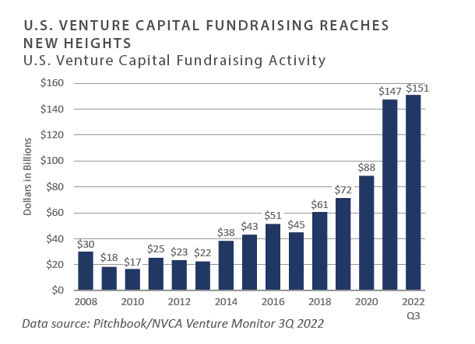
- Venture capital fundraising and investment activity has continued at elevated levels in 2022 despite the public market volatility in recent quarters. Exit activity ground to a halt as participants grappled with falling valuations. Anecdotally, venture capitalists indicate they are preparing companies for a very different economic environment in the coming years, with a greater emphasis on capital efficiency and profitability compared to the growth-at-all-costs mindset of recent years.
- U.S. venture funds raised $151 billion through September 30, exceeding the annual amount raised in 2021.1 Large funds drove the fundraising data, as funds with over $1.0 billion of assets accounted for over half of the capital raised in 2022.
- Investment activity was robust in the third quarter, with over $195 billion invested across more than 11,800 companies through September 30. This investment activity is ahead of the 2020 annual amount, though off 2021’s record-setting level.
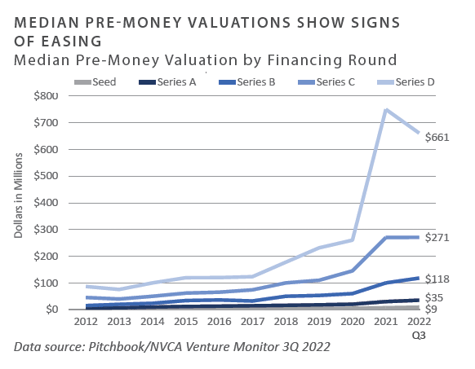
- Pre-money valuations have not yet fully reflected the new environment. Late-stage (Series D) valuations pulled back while other stages were flat to little changed. FEG expects valuations to trend lower, as there is typically a lag in the private markets from the public market trends.
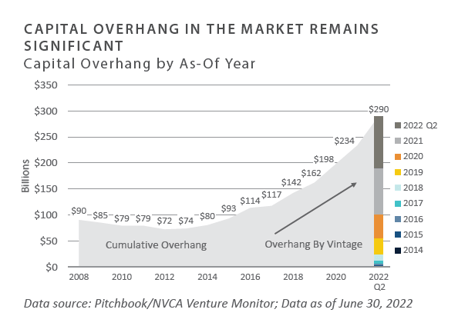
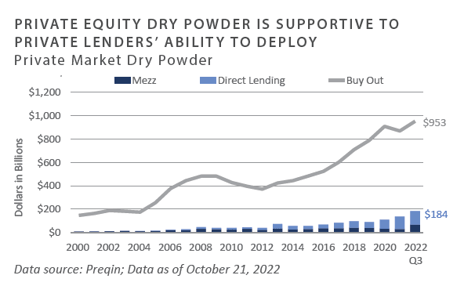
- The record amount of available dry powder is a contributing factor in investment activity and high valuations. As of September 30, 2022, venture capital funds held $290 billion of uncalled capital, more than twice that of 2018.
- The pullback in the exit market was swift and robust. Exit activity remains muted and is not expected to return in 2022. This year could be the slowest year for exits in the past decade.
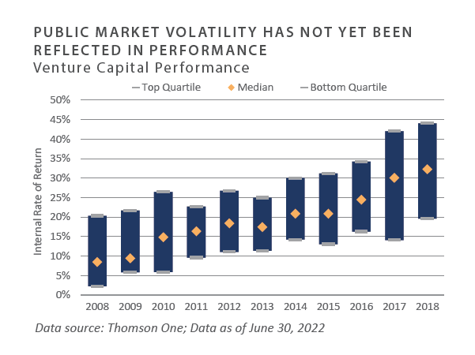
- Venture performance through the first quarter remained strong. Returns will be affected if the exit markets remain closed and hold periods extend.
1 Pitchbook/NVCA Venture Monitor 3Q 2022
INVESTOR IMPLICATIONS
We believe investors should be prepared for volatility due to high valuations and capital flows.
Leveraged Buyouts
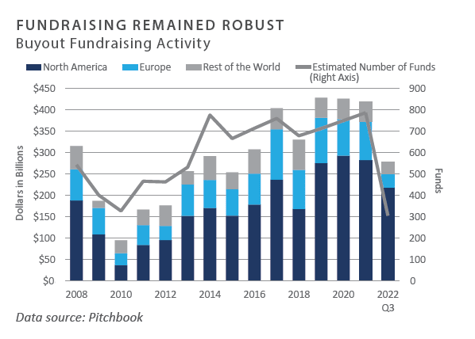
- Through the third quarter of 2022, global fundraising was down roughly 13% from last year.1 As of September 30, 2022, approximately $278 billion was raised for global buyout funds2. Roughly 79% of these commitments were to U.S.-based private equity funds.3 Year-to-date, U.S. fundraising remains flat from the same time period last year. Unlike in prior years, fundraising in the fourth quarter is likely to cool due to fewer expected closings.
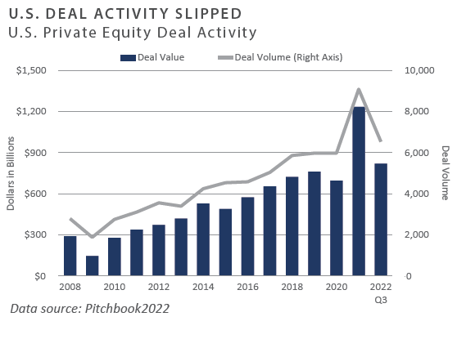
- Quarterly deal value fell roughly 20% from the same period last year.4 Despite a slowdown in the third quarter, year-to-date deal value and deal volume remained in line with 2021. Add-ons accounted for nearly 78% of transaction volume.5
- Purchase price multiples contracted during the quarter but remain relatively elevated compared to historical averages. As of September 30, 2022, the average leveraged buyout multiple was 11.9x earnings before interest, taxes, depreciation, and amortization (EBITDA). The average debt/EBITDA ratio was 6.1x EBITDA, which is also elevated from a historical perspective.6
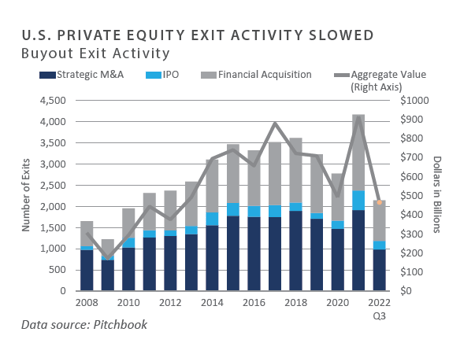
- Private equity exit activity fell sharply during the third quarter. Year-to-date, exit values and exit volume are down 54% and 19%, respectively, from the same time last year.7 Initial public offering (IPO) activity remained cool. Sales to strategic or financial acquirers represented most of the U.S. private equity backed exits by volume.8
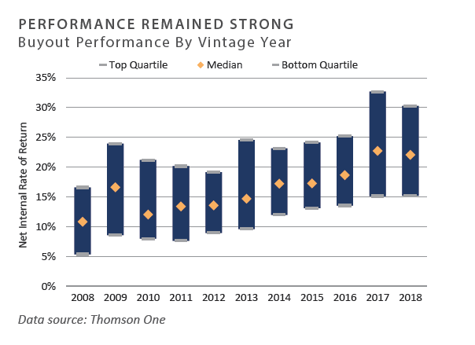
- Private equity performance contracted during the second quarter of 2022, which is the most recent data available. Overall, absolute performance remained strong and the spread between the top and bottom quartile manager remained above 1,000 basis points.9
INVESTOR IMPLICATIONS
Tightening monetary policy and an uncertain economic outlook are likely to negatively impact private equity markets in the fourth quarter. Investors are encouraged to take a prudent approach to allocating capital to the asset class. Managers will need to rely less on financial engineering and more on operational improvements to generate outperformance.
1, 2, 3, 4, 5, 7, 8, 9 Pitchbook; Data of September 30, 2022
6 S&P Capital IQ; “Q3 2022 Leveraged Buyout Review”; Data as of September 30, 2022
4 Refinitiv; Data as of June 30, 2022 (Most Recent Available)
Private Debt
-
The third quarter of 2022 saw continued volatility and deterioration in the public credit markets as high yield bonds continued to decline. Bank loans bucked the trend, however, and were positive for the quarter due to their floating rate nature and investors’ desire to move up in capital structure late in the cycle.
-
Market volatility, macro uncertainty, and financial asset price declines have led to managers raising distressed/dislocation funds, the velocity of which accelerated over the summer. Undeployed capital raised for distressed opportunities in 2020 and 2021 provides ample dry powder in addition to any new capital being raised in the event of a more profound downturn.
-
Economic uncertainty has tilted the scales in favor of lenders with creditor-friendly terms, increased pricing, and improved deal quality. Exit timelines for existing lending funds tend to extend in a prolonged downturn, pressuring IRRs lower, while multiples tend to remain intact.
-
The vast amount of private equity dry powder is supportive of lenders’ abilities to continue to deploy capital, even in a downturn. The deal pace has dissipated in 2022, with lenders noting that only the highest quality deals are being closed and more marginal transactions are being shelved.
INVESTOR IMPLICATIONS
Capital raised by distressed/special situations funds is likely to be deployed within their respective investment periods. This capital deployment may act as a floor for markets, providing liquidity and aiding in price discovery. FEG continues to prepare for distressed opportunity to further develop in 2023, which should also benefit lenders with fresh balance sheets to deploy capital.
1 Ice BofA US High Yield Master II Index
2,3 Preqin Alternatives 2Q22
4 Pitchbook
Private Real Estate
-
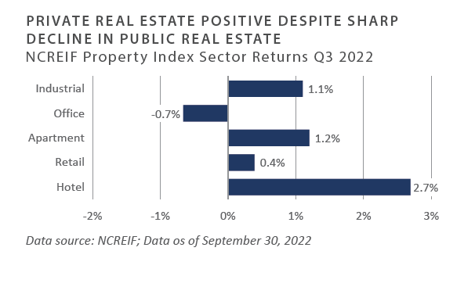
The National Council of Real Estate Investment Fiduciaries (NCREIF) Property Index (NPI) posted a slight gain of 0.6% during the third quarter and returned 16% on a trailing 1-year basis. Hotel properties outperformed, benefiting from higher occupancy rates over the summer months. Alternatively, office properties continue to face headwinds from remote working trends and high vacancy rates. Market value-weighted capitalization rates for the index held steady at 3.8% during the quarter; however, net operating income growth was negative at -0.4% for the quarter, down significantly from the 4% growth of the prior quarter.1
-
One of the most noteworthy trends in real estate year-to-date has been the wide disparity between the performance of public and private markets. As measured by the FTSE NAREIT Index, public real estate securities declined 12% in the third quarter and 29% year-to-date.2 For example, industrial REITs declined 14.3% on a trailing 1-year basis compared to a gain of 34% for the industrial portion of the NCREIF Property Index. Moreover, implied cap rates in public REITs are higher than those reported in private markets.3 This disparity suggests the private markets may face declines in the coming quarters.
-
Transaction volume declined sharply, as the impact of higher interest rates led to wide spreads between expectations of buyers and sellers of commercial real estate. Overall, transaction volume totaled $172 billion in the third quarter, down 21% from the same period last year. Many deals are re-trading based on shifting return expectations and the availability of financing. Publicly traded REITs could become a target for private real estate, given their significant declines year-to- date.
-
Private equity real estate funds raised approximately $112 billion globally as of late October, compared with $158 billion in the same period last year. Expectations are for fourth-quarter fundraising to come in below the record $80 billion raised in the fourth quarter of 2021.4
- Availability of credit for commercial real estate tightened significantly. Total commercial mortgage-backed security (CMBS) issuance dropped by approximately 35% compared to the same period in 2021 and is expected to fall further through year-end.5 Looming debt maturities on commercial real estate loans and refinancing risk will be a key issue as borrowers confront higher borrowing costs on lower asset values. Banks continue to lend on multifamily and industrial properties; however, financing for office, retail, and hotels is limited or not available.
INVESTOR IMPLICATIONS
Real estate is facing headwinds on multiple fronts: higher interest rates, inflation, and fears of a potential recession. Investors are facing “negative leverage” with borrowing costs above cap rates in some sectors. Industrial and multifamily properties remain the most favored property types among institutional investors but could also be most vulnerable to rising cap rates. FEG expects private real estate valuations to trend lower into year-end as investors reassess the impact of higher interest rates on property values. Transaction volumes have slowed significantly after peaking in 2021. While selective distressed opportunities in real estate could begin to emerge, some managers will be focused on distressed assets in their active funds.
1 NCREIF
2 Blackstone, May 6, 2022
3 Preqin, July 2022
Natural Resources
-
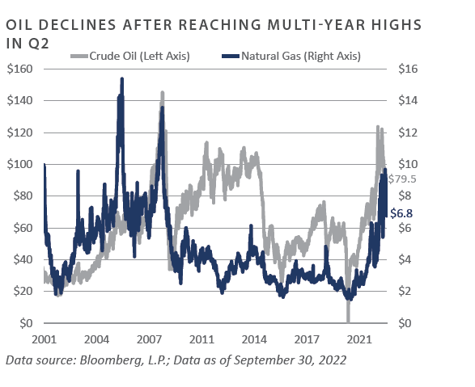
Oil prices fell 25% during the third quarter, closing at $79.50/ barrel, compared to $105.76/barrel at the end of the second quarter. After quarter-end, OPEC announced plans to cut production by two million barrels per day, which led to a rebound in prices to the mid-high $80/barrel range. This action effectively thwarted efforts by the Biden Administration to bring prices down through releases from the Strategic Petroleum Reserve heading into the midterm elections. U.S. oil and gas companies remain reluctant to pursue new drilling, in part due to pressure from shareholders to return capital in the form of dividends and share buybacks.1
-
Natural gas prices rose 25% in the third quarter to close at $6.77/MMBtu. Concerns about natural gas supplies in Europe were a key factor driving natural gas prices to multi-year highs, as Russia cut deliveries through the Nord Stream pipeline.2 As Europe seeks to reduce its dependence on Russian natural gas imports, the region has limited options apart from liquid natural gas imports, but it lacks sufficient infrastructure to support additional imports.
-
Despite improving oil and natural gas prices, the appetite among institutional investors for upstream energy funds remains relatively limited. Many endowments and foundations continue pledging to divest from fossil fuels, unwind their existing private energy investments, and commit to making no new upstream energy investments. However, several private energy groups launched upstream energy funds in an effort to capitalize on the recovery in oil and gas prices. Among these groups were Natural Gas Partners, Lime Rock Partners, Urban Oil and Gas, and Scout Energy Partners. Meanwhile, Silver Hill Energy Partners closed its inaugural fund on approximately $1 billion in capital commitments in the third quarter.3
-
According to Baker Hughes, the total U.S. rig count increased 12% during the third quarter to 765 rigs. As a frame of reference, the U.S. oil rig count peaked at 1,600 in the fall of 2014. Rig counts reflect the reluctance of energy companies to significantly increase capital expenditures despite record-high commodity prices.4
INVESTOR IMPLICATIONS
While there are indications that some investors may be open to considering allocations to traditional upstream private energy into 2023, uncertainty remains. This is due in part to the “denominator effect,” which could lead to limited new commitments to private capital because of declines in the public markets year-to-date. As a result, energy still remains one of the only sectors in the private capital landscape that has not seen significant inflows. The ongoing focus remains on energy transition, and investors continue to divest from fossil fuels. This is also the case in the public markets, where, despite the S&P 500 Energy sector gaining 68% year-to-date through October, fund flows from public equity investors have been limited.
1, 2, 3 Energy Information Administration, www.eia.gov
4 EnCap, March 20222
5 Baker Hughes
INDICES
Bloomberg US Corporate High Yield Index represents the universe of fixed rate, non-investment grade debt. Eurobonds and debt issues from countries designated as emerging markets are excluded, but Canadian and global bonds (SEC registered) of issuers in non-EMG countries are included. The index includes the corporate sectors: Industrials, Utilities, and Finance, encompassing both U.S. and non-U.S. Corporations. See www.bloomberg.com for more information.
The Russell Indices are constructed by Russell Investment. There are a wide range of indices created by Russell covering companies with different market capitalizations, fundamental characteristics, and style tilts. See www.russellinvestments.com for more information.
The FTSE NAREIT Composite Index (NAREIT) includes only those companies that meet minimum size, liquidity and free float criteria as set forth by FTSE and is meant as a broad representation of publicly traded REIT securities in the U.S. Relevant real estate activities are defined as the ownership, disposure, and development of income-producing real estate. See www.ftse.com/Indices for more information.
The S&P 500 Index is capitalization-weighted index of 500 stocks. The S&P 500 Index is designed to measure performance of the broad domestic economy through changes in the aggregate market value of 500 stocks representing all major industries.
The NCREIF Property Index is a quarterly time series composite total rate of return measure of investment performance of a very large pool of individual commercial real estate properties acquired in the private market for investment purposes only.
HFRI ED: Distressed/Restructuring Index — Distressed/Restructuring strategies which employ an investment process focused on corporate fixed income instruments, primarily on corporate credit instruments of companies trading at significant discounts to their value at issuance or obliged (par value) at maturity as a result of either formal bankruptcy proceeding or financial market perception of near term proceedings. Managers are typically actively involved with the management of these companies, frequently involved on creditors' committees in negotiating the exchange of securities for alternative obligations, either swaps of debt, equity or hybrid securities. Managers employ fundamental credit processes focused on valuation and asset coverage of securities of distressed firms; in most cases portfolio exposures are concentrated in instruments which are publicly traded, in some cases actively and in others under reduced liquidity but in general for which a reasonable public market exists. In contrast to Special Situations, Distressed Strategies employ primarily debt (greater than 60%) but also may maintain related equity exposure.
Information on any indices mentioned can be obtained either through your advisor or by written request to information@feg.com.
DISCLOSURES
This report was prepared by Fund Evaluation Group, LLC (FEG), a federally registered investment adviser under the Investment Advisers Act of 1940, as amended, providing non-discretionary and discretionary investment advice to its clients on an individual basis. Registration as an investment adviser does not imply a certain level of skill or training. The oral and written communications of an adviser provide you with information about which you determine to hire or retain an adviser. Fund Evaluation Group, LLC, Form ADV Part 2A & 2B can be obtained by written request directly to: Fund Evaluation Group, LLC, 201 East Fifth Street, Suite 1600, Cincinnati, OH 45202, Attention: Compliance Department.
The information herein was obtained from various sources. FEG does not guarantee the accuracy or completeness of such information provided by third parties. The information in this report is given as of the date indicated and believed to be reliable. FEG assumes no obligation to update this information, or to advise on further developments relating to it. FEG, its affiliates, directors, officers, employees, employee benefit programs and client accounts may have a long position in any securities of issuers discussed in this report.
Index performance results do not represent any managed portfolio returns. An investor cannot invest directly in a presented index, as an investment vehicle replicating an index would be required. An index does not charge management fees or brokerage expenses, and no such fees or expenses were deducted from the performance shown.
Bloomberg Data Disclosure: Source- Bloomberg Index Services Limited. BLOOMBERG® is a trademark and service mark of Bloomberg Finance L.P. and its affiliates (collectively “Bloomberg”). Bloomberg or Bloomberg’s licensors own all proprietary rights in the Bloomberg Indices. Bloomberg does not approve or endorse this material or guarantee the accuracy or completeness of any information herein, nor does Bloomberg make any warranty, express or implied, as to the results to be obtained therefrom, and, to the maximum extent allowed by law, Bloomberg shall not have any liability or responsibility for injury or damages arising in connection therewith.
Neither the information nor any opinion expressed in this report constitutes an offer, or an invitation to make an offer, to buy or sell any securities.
Any return expectations provided are not intended as, and must not be regarded as, a representation, warranty or predication that the investment will achieve any particular rate of return over any particular time period or that investors will not incur losses.
Past performance is not indicative of future results.
Investments in private funds are speculative, involve a high degree of risk, and are designed for sophisticated investors.
An investor could lose all or a substantial amount of his or her investment. Private capital funds’ fees and expenses may offset private capital funds’ profits. Private capital funds are not required to provide periodic pricing or valuation information to investors except as defined in the fund documents. Private capital funds may involve complex tax structures and delays in distributing important tax information. Private capital funds are not subject to the same regulatory requirements as mutual funds. Private capital funds are not liquid and require investors to commit to funding capital calls over a period of several years; any default on a capital call may result in substantial penalties and/or legal action. Private capital fund managers have total authority over the private capital funds. The use of a single advisor applying similar strategies could mean lack of diversification and, consequently, higher risk.
All data is as of September 30, 2022 unless otherwise noted.