The third quarter of 2022 provided little respite for investors hoping to see a change in trend across the financial markets after significant downside volatility in the year’s first half. While a relief rally was witnessed in July, the positive sentiment spanning both risk-oriented and high-quality assets during the month reversed course in August and September, with most major equity index levels establishing fresh year-to-date lows and interest rates ascending to the highest level in more than a decade. Stubbornly high inflation, historically tight labor market conditions, and a continued imbalance between aggregate demand and available supply were critical factors behind increased tightening efforts by the Federal Reserve (Fed) during the quarter.
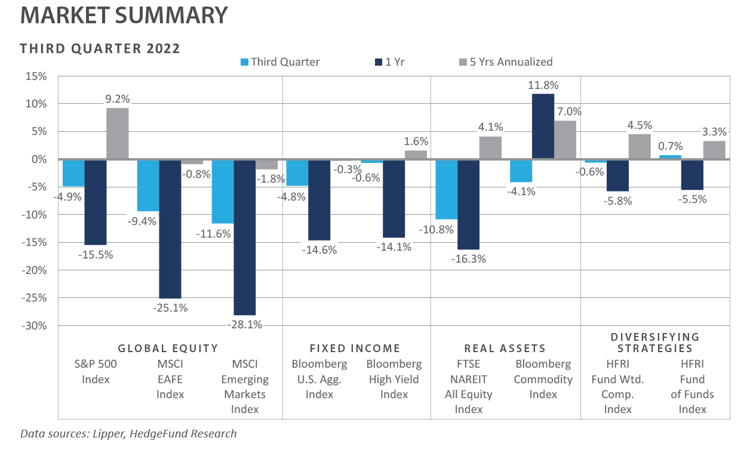
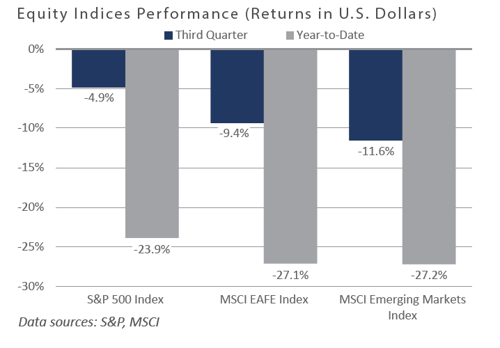
Key policy actions by the Fed during the quarter included a doubling of the pace of quantitative tightening through a reduction in balance sheet assets and a 75-basis-point hike to the federal funds rate in September, formally placing the policy rate into restrictive territory. Global equity returns were overwhelmingly negative in the third quarter, as domestic equities witnessed solid relative outperformance versus their international developed and emerging market counterparts.
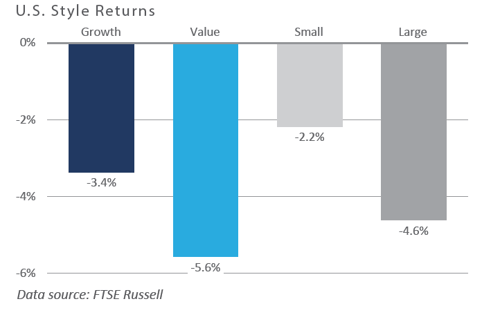
From a capitalization perspective, despite a general risk-off tone, small and microcap generated meaningful relative outperformance versus large cap, while stylistically, growth outperformed value. Bond sentiment deteriorated further—particularly among rate-sensitive sectors—as the combination of Fed rate hikes and a sticky inflationary backdrop supported a further increase in interest rates. However, a slight quarterly decline in high yield credit spreads provided a modest bright spot. Real assets were not spared from the sell-off pressures that plagued the financial markets during the quarter, with double-digit declines experienced across real estate investment trusts (REITs), global listed infrastructure, and commodity futures.
Economic Update
Steep Declines Beset Financials Markets in the Third Quarter as the Fed Pumps the Brakes
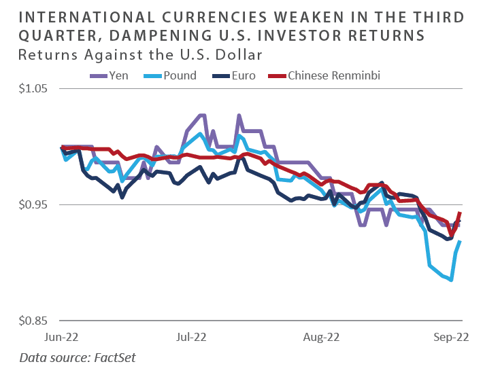
The final month of the third quarter of 2022 presented market participants with much to digest. Notable events included geopolitical developments such as the Bank of Japan’s (BOJ) intervention in the currency market to help stem the yen’s decline versus the U.S. dollar (USD)—a move not observed in nearly a quarter of a century—as well as new quantitative easing efforts by the Bank of England (BOE) aimed at restoring financial market stability amid a sharp increase in UK gilt yields, double-digit inflation, and the weakest exchange rate value of the pound versus the USD since the mid-1980s.
While the aforementioned policy moves of the BOJ and BOE in September were directed at easing monetary conditions, in the U.S., the Fed took several steps to tighten monetary conditions. On the policy rate front, the Fed hiked the federal funds rate by 75 bps at its late September meeting, placing the new upper bound on the target rate at 3.25%, a rate that exceeds the long-run neutral level by 75 bps, formally placing this key interest rate into restrictive territory. Additionally, the Fed increased the size of its quantitative tightening campaign by doubling the monthly balance sheet runoff pace, increasing from a previous pace of $47.5 billion per month to a new targeted rate of $95 billion per month.
Diverging policy trajectories between the Fed and other major global central bank players has been a key driver behind the USD’s sharp year-to-date appreciation. According to the commonly cited ICE U.S. Dollar Index (DXY), the USD stood at +17.2% by quarter-end—a nearly 20% gain year-to-date following a 6.4% increase in 2021. Various measures of the USD’s global exchange rate value stand at multi-decade highs. The Bank for International Settlements’ real effective exchange rate for the USD, an inflation-adjusted and trade-weighted proxy of the currency’s relative value, increased to the highest reading since 1985 during the quarter, sitting more than two standard deviations above its long-run trend.
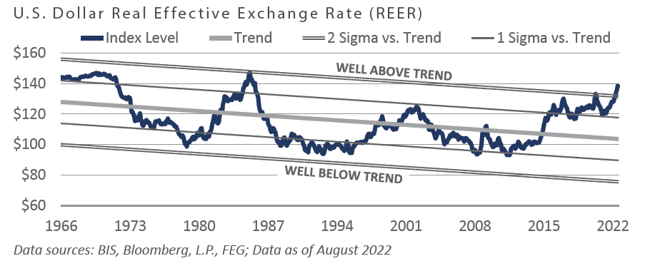
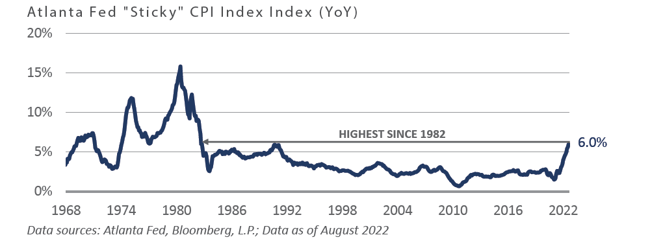
While the U.S. continues to grapple with one of the most severe cost-of-living crises of the modern era, the sharply appreciating USD has likely contained some of the inflationary impulses that often accompany a significantly depreciating local currency. Moreover, while financial market performance in the early trading days of the fourth quarter has taken on a more upbeat tone—likely due to early indications that some key major global central banks have had to prematurely reverse course on their policy tightening initiatives—recent U.S. inflationary data likely points to even further tightening in the coming months, given that the stickiness of the current inflationary regime has shown little evidence of reversing course.
To conclude, third-quarter performance across most global asset classes and sub-asset categories was significantly negative, with diverging policy trajectories among some of the most critical central banking authorities dominating financial media headlines. While actions taken by the BOJ and BOE took on an easing bias, the Fed remained steadfast in its campaign to restore price stability by doubling the pace of quantitative tightening and hiking the federal funds rate into restrictive territory.
Market Summary
Global Equity
-
U.S. equities returns were negative for the quarter amid ongoing inflationary pressures and concerns of an economic recession. To start the quarter, equity returns rebounded until the Fed’s Jackson Hole summit, when central bankers reiterated that their primary goal was taming inflation as opposed to supporting economic growth.
-
The cyclical sectors of energy, which led market performance despite falling energy prices, and consumer discretionary, provided
positive performance while all other sectors declined and typically defensive sectors lagged. Interest rate-sensitive sectors, such as real estate, offered poor performance due to rising rates and a nearly 6% increase in the 30-year mortgage. -
Growth equities outperformed value equities over the third quarter overcoming weakness in growth in September and year-to-
date. Before the Jackson Hole summit, market expectations of an interest rate cut in early 2023 benefited growth equities. However, as the market theme reversed, value equities outperformed to conclude the quarter amid the Fed’s commitment to tamping inflation. - International equity declines were comparable to those of the U.S. market, but USD strength has negatively impacted U.S.- based investors; earlier this year, the euro reached parity with the dollar for the first time since 2002.
- Inflation and the energy crisis in Europe continued to impact the poor outlook for economic growth. European PMI data declined, and the European Central Bank hiked rates for the first time in over a decade. UK equities outperformed other European markets, but the pound’s decline in response to the announcement of the UK government’s fiscal policy, which would increase government borrowing, weighed on returns in U.S. dollar terms. The weakening of the British pound caused large consumer staples and energy sector companies to gain because a large portion of their revenues are generated overseas.
- Japanese equities followed their developed market counterparts, starting the quarter strong and declining in September. The Japanese yen weakened throughout the quarter, approaching a 24-year low against the U.S. dollar amid the Bank of Japan’s loose monetary policy before the Ministry of Finance intervened. Irrespective of the macroeconomic data, individual stock performance was primarily driven by corporate earnings results for the March- June quarter. Broadly speaking, earnings and profit margin results were ahead of expectations, despite a slowdown in momentum.
- Broadly, emerging market equity returns were negative. Countries in close proximity to the Russia-Ukraine war, such as Poland, Hungary, and the Czech Republic, were among the largest decliners. China’s property market issues, restrictive COVID-19 lockdown policies, and weakening domestic demand contributed to poor performance over the quarter. Conversely, Indian equity returns were positive as economic growth was sustained, and Brazilian equity performance led due in part to moderating inflation.
Fixed Income
-
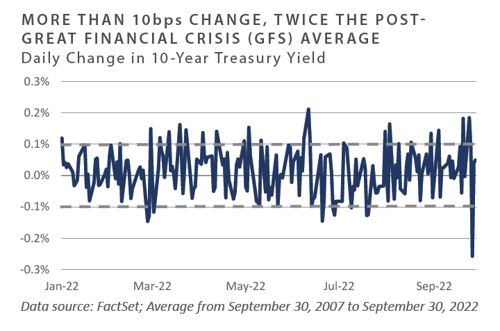
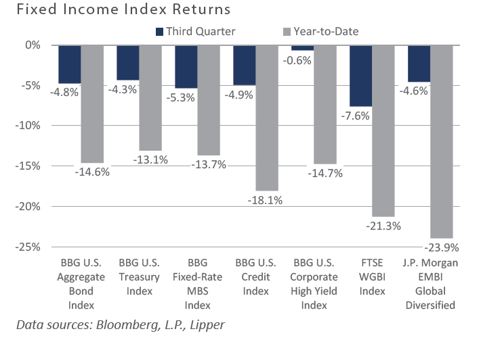
The third quarter was a tale of two outlooks as July’s FOMC meeting left market participants with hopes of a dovish pivot which were firmly extinguished following a hawkish and direct speech from Chair Powell in August. The 10-year Treasury marched over 80 bps higher to end the quarter at 3.8%. Highlighting the oppressive volatility in the rates markets, the 10-year Treasury yield traded within a 1.4 percentage point range after reaching a low of 2.6% in early July. The hawkish undertone from FOMC participants led the 2-year Treasury to skyrocket from 1.3% to 4.2%, with most of the move taking place in the second half of the quarter.
- Inflation break evens across the curve are well off the highs reached earlier this year as real rates move into positive territory. A key takeaway from September’s FOMC meeting was Powell’s desire to have nominal interest rates above inflation across the entire yield curve.
- In a similar vein to the rates markets, credit products benefited from spread compression and falling rates in July and August before the script flipped towards widening spreads. New issue activity has been anemic off the back of 2021’s record pace. Still, IG issuers took advantage of moderate appetite for new paper during the quarter and LL and HY markets saw several high-profile hung deals, which pressured spreads wider.
- As measured by the BofA Move Index, which measures volatility across the yield curve, the U.S. rate markets have seen volatility increase 70% since the beginning of the year. The effects of central bank actions have also been felt abroad. The strength of the U.S. dollar against the Japanese yen caused the Bank of Japan to intervene in the country’s currency market for the first time in decades. Additionally, upward pressure in the UK gilt market forced LDI investors to liquidate assets to fund margin calls related to interest rate hedges. In response, the Bank of England stepped in to buy gilts, thus scrapping their goal of quantitative tightening. Global central banks will be on edge to monitor how well financial markets function against the backdrop of financial condition tightening.
Real Assets
REAL ESTATE
-
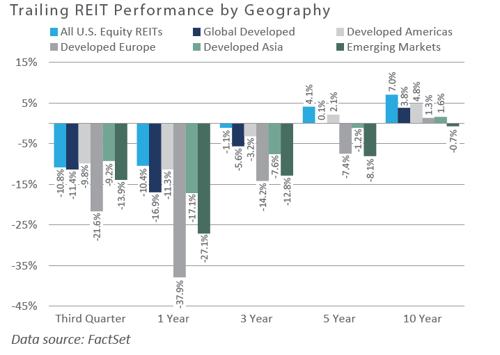
Publicly traded real estate securities (REITs) declined across all sectors and regions during the quarter. U.S. and European real estate continued to sell off due to expectations of continued interest rate increases and concerns about economic weakness and the consequential impacts on rent growth, cap rates, and borrowing costs.
-
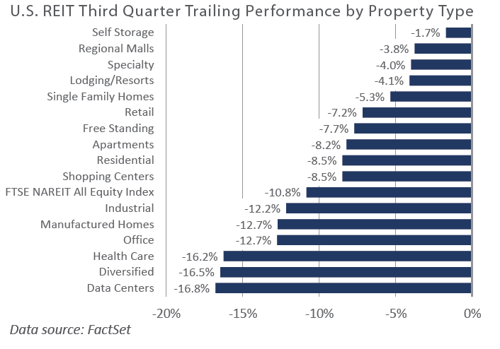
Data centers underperformed following massive growth from the industry over the past few years. The sector is facing significant headwinds in securing power to support new data centers, which could take years to catch up to the surge in demand. Health care REITs also underperformed and were negatively impacted by their bond-like profile, which made them less attractive in a rising interest rates environment. Self-storage REITs declined slightly for the quarter, outperforming on a relative basis, as the sector tends to be more resilient in slowing economic environments.
NATURAL RESOURCES
-
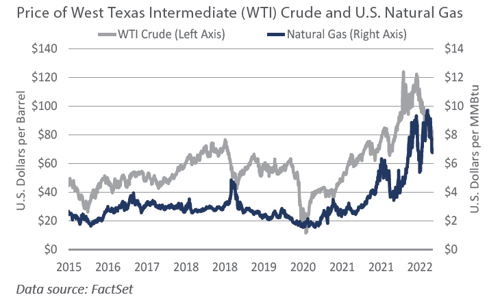
The energy markets have been volatile during 2022. Numerous macroeconomic factors continue to drive volatility in the sector, including rising interest rates, inflation, the Russian invasion of Ukraine, the Nord Stream pipeline attack, and OPEC+ production cuts, all supporting higher price volatility in the energy markets. A stronger U.S. dollar has historically created downward pressure on oil prices; however, persistently tight oil supply and energy shortages in Europe have continued to keep energy costs elevated.
-
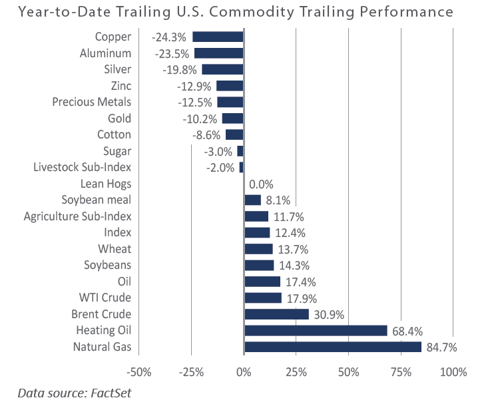
On a year-to-date basis, industrial metals continued to decline, mainly due to recession fears. This is especially true in China, a key driver of demand. The country’s zero-COVID policy has led to ongoing lockdowns throughout the year. Historically, declining trading volumes of industrial metals have been a key indicator of a weakening economic outlook.
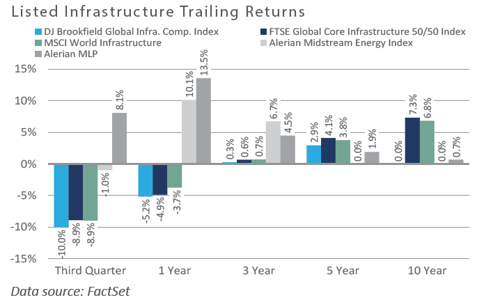
INFRASTRUCTURE
-
Midstream energy was the only positive returning sub-sector within global listed infrastructure during the quarter. Midstream has outperformed primarily due to debt reduction, share buybacks, mergers and acquisitions activity, and continues to benefit from resilient cashflows amidst an environment of unpredictable energy prices.
Diversifying Strategies
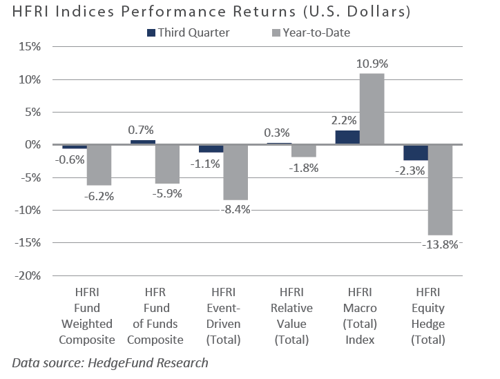
- Although hedge funds declined broadly during the quarter, performance compared well to traditional equity and fixed-income markets. Relative value and macro strategies produced positive returns over the quarter, while equity hedge and event-driven both had negative results.
- Systematic trend following strategies generated strong performance due in part to a surging U.S. dollar against a plunging British pound. Short equity positions benefited from steep equity market declines.
- Equity hedge manager’s continued weakness in technology and healthcare focused strategies led to poor returns. The only bright spots within long/short equity were energy-oriented managers who benefited from persistent supply shortages. Additionally, equity market neutral strategies, which attempt to remove general market risk, performed well.
- Event-driven manager returns were negative across the board except for merger arbitrage strategies. Activist managers, who tend to carry higher equity beta, struggled toward the end of the quarter, wiping out early gains.
INDICES
The Alerian MLP Index is a composite of the 50 most prominent energy Master Limited Partnerships that provides investors with an unbiased, comprehensive benchmark for this emerging asset class.
Bloomberg Fixed Income Indices is an index family comprised of the Bloomberg US Aggregate Index, Government/Corporate Bond Index, Mortgage-Backed Securities Index, and Asset-Backed Securities Index, Municipal Index, High-Yield Index, Commodity Index and others designed to represent the broad fixed income markets and sectors. On August 24, 2016, Bloomberg acquired these long-standing assets from Barclays Bank PLC. and on August 24, 2021, they were rebranded as the Bloomberg Fixed Income Indices. See https://www.bloomberg.com/markets/rates-bonds/bloomberg-fixed-income-indices for more information..
The CBOE Volatility Index (VIX) is an up-to-the-minute market estimate of expected volatility that is calculated by using real-time S&P 500 Index option bid/ask quotes. The Index uses nearby and second nearby options with at least eight days left to expiration and then weights them to yield a constant, 30-day measure of the expected volatility of the S&P 500 Index.
FTSE Real Estate Indices (NAREIT Index and EPRA/NAREIT Index) includes only those companies that meet minimum size, liquidity and free float criteria as set forth by FTSE and is meant as a broad representation of publicly traded real estate securities. Relevant real estate activities are defined as the ownership, disposure, and development of income-producing real estate. See https://www.ftserussell.com/index/category/real-estate for more information.
HFRI Monthly Indices (HFRI) are equally weighted performance indexes, compiled by Hedge Fund Research Inc. (HFX), and are used by numerous hedge fund managers as a benchmark for their own hedge funds. The HFRI are broken down into 37 different categories by strategy, including the HFRI Fund Weighted Composite, which accounts for over 2,000 funds listed on the internal HFR Database. The HFRI Fund of Funds Composite Index is an equal weighted, net of fee, index composed of approximately 800 fund- of- funds which report to HFR. See www.hedgefundresearch.com for more information on index construction.
J.P. Morgan’s Global Index Research group produces proprietary index products that track emerging markets, government debt, and corporate debt asset classes. Some of these indices include the JPMorgan Emerging Market Bond Plus Index, JPMorgan Emerging Market Local Plus Index, JPMorgan Global Bond Non-U.S. Index and JPMorgan Global Bond Non-U.S. Index. See www.jpmorgan.com for more information.
Merrill Lynch high yield indices measure the performance of securities that pay interest in cash and have a credit rating of below investment grade. Merrill Lynch uses a composite of Fitch Ratings, Moody’s and Standard and Poor’s credit ratings in selecting bonds for these indices. These ratings measure the risk that the bond issuer will fail to pay interest or to repay principal in full. See www.ml.com for more information.
Morgan Stanley Capital International – MSCI is a series of indices constructed by Morgan Stanley to help institutional investors benchmark their returns. There are a wide range of indices created by Morgan Stanley covering a multitude of developed and emerging economies and economic sectors. See www.morganstanley.com for more information.
The FTSE Nareit All Equity REITs Index is a free-float adjusted, market capitalization-weighted index of U.S. equity REITs.
Russell Investments rank U.S. common stocks from largest to smallest market capitalization at each annual reconstitution period (May 31). The primary Russell Indices are defined as follows: 1) the top 3,000 stocks become the Russell 3000 Index, 2) the largest 1,000 stocks become the Russell 1000 Index, 3) the smallest 800 stocks in the Russell 1000 Index become the Russell Midcap index, 4) the next 2,000 stocks become the Russell 2000 Index, 5) the smallest 1,000 in the Russell 2000 Index plus the next smallest 1,000 comprise the Russell Microcap Index, and 6) U.S. Equity REITs comprise the FTSE Nareit All Equity REIT Index. See www.russell.com for more information.
S&P 500 Index consists of 500 stocks chosen for market size, liquidity and industry group representation, among other factors by the S&P Index Committee, which is a team of analysts and economists at Standard and Poor’s. The S&P 500 is a market-value weighted index, which means each stock’s weight in the index is proportionate to its market value and is designed to be a leading indicator of U.S. equities, and meant to reflect the risk/return characteristics of the large cap universe. See www.standardandpoors.com for more information.
Information on any indices mentioned can be obtained either through your advisor or by written request to information@feg.com.
DISCLOSURES
This report was prepared by FEG (also known as Fund Evaluation Group, LLC), a federally registered investment adviser under the Investment Advisers Act of 1940, as amended, providing non-discretionary and discretionary investment advice to its clients on an individual basis. Registration as an investment adviser does not imply a certain level of skill or training. The oral and written communications of an adviser provide you with information about which you determine to hire or retain an adviser. Fund Evaluation Group, LLC, Form ADV Part 2A & 2B can be obtained by written request directly to: Fund Evaluation Group, LLC, 201 East Fifth Street, Suite 1600, Cincinnati, OH 45202, Attention: Compliance Department.
The information herein was obtained from various sources. FEG does not guarantee the accuracy or completeness of such information provided by third parties. The information in this report is given as of the date indicated and believed to be reliable. FEG assumes no obligation to update this information, or to advise on further developments relating to it. FEG, its affiliates, directors, officers, employees, employee benefit programs and client accounts may have a long position in any securities of issuers discussed in this report.
Index performance results do not represent any managed portfolio returns. An investor cannot invest directly in a presented index, as an investment vehicle replicating an index would be required. An index does not charge management fees or brokerage expenses, and no such fees or expenses were deducted from the performance shown.
Bloomberg Index Services Limited. BLOOMBERG® is a trademark and service mark of Bloomberg Finance L.P. and its affiliates (collectively “Bloomberg”). Bloomberg or Bloomberg’s licensors own all proprietary rights in the Bloomberg Indices. Bloomberg does not approve or endorse this material or guarantee the accuracy or completeness of any information herein, nor does Bloomberg make any warranty, express or implied, as to the results to be obtained therefrom, and, to the maximum extent allowed by law, Bloomberg shall not have any liability or responsibility for injury or damages arising in connection therewith.
Neither the information nor any opinion expressed in this report constitutes an offer, or an invitation to make an offer, to buy or sell any securities.
Any return expectations provided are not intended as, and must not be regarded as, a representation, warranty or predication that the investment will achieve any particular rate of return over any particular time period or that investors will not incur losses.
Past performance is not indicative of future results.
Investments in private funds are speculative, involve a high degree of risk, and are designed for sophisticated investors.
All data is as of September 30, 2022 unless otherwise noted.