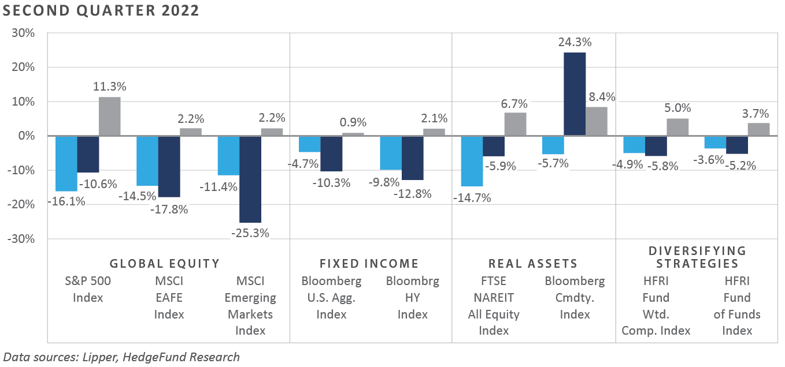
Traditional asset classes and categories declined sharply in the final month of the second quarter, capping off one of the most challenging first six months of a calendar year in recent memory, as global equities, core and high yield bonds, and real estate investment trusts (REITs) posted double-digit losses through the first two quarters of 2022. Following a modest contraction in GDP growth in the first quarter, estimates for second-quarter growth evolved to reflect the potential for a further contraction in economic activity, suggesting the U.S. economy may be in the midst of a recession. For the quarter, domestic equities witnessed relative underperformance versus both international developed and emerging markets. Stylistically, value stocks witnessed further outperformance versus their growth counterparts, buoyed by relatively strong returns from the energy sector. Despite the sell-off across risk assets during the quarter and the first half of the year, safe-haven assets such as Treasuries and precious metals provided investors with little relief. Ongoing inflationary pressures helped drive nominal interest rates higher, and those rising rates negatively impacted core bonds. An upward-trending U.S. dollar and an associated increase across real interest rates dented the appeal of holding zero-yielding monetary assets such as gold. Performance across real assets was similarly volatile to the downside—REITs, in particular, suffered dual headwinds in the way of rising interest rates and a slowdown in economic growth.
Economic Update
Financial Market Volatility Surges as U.S. Economic Engine Reaches Stall Speed
Mounting fear of an impending U.S. recession dominated market sentiment across the second quarter, most notably in June. This fear, in turn, drove volatility higher across the global financial markets, particularly in sectors with above-average sensitivity to changes in economic growth. Paired with an ongoing inflationary impulse—including some gauges at 40-plus-year highs—the U.S. economy is facing the real threat of a slip into stagflation, a dynamic market participants have not had to contend with since the 1970s and early 1980s.
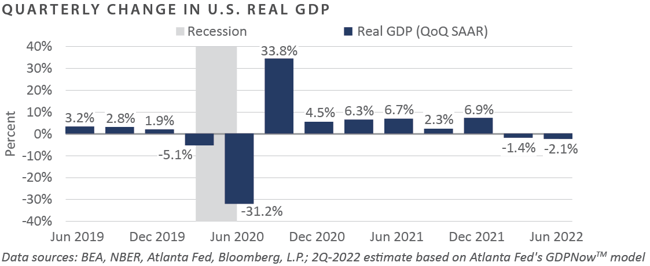
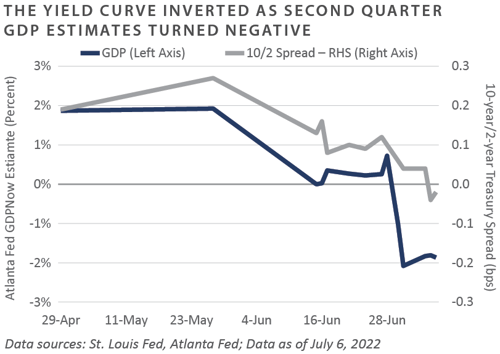
Real-time measures of second-quarter growth deteriorated in the final month of the quarter on the back of the first quarter’s modest 1.4% decline on an annualized, inflation-adjusted basis. The Atlanta Federal Reserve’s (Fed’s) commonly referenced GDPNow™ model is now tracking a 2.0% or greater growth decline in the second quarter. Should the actual print come in near the -2.1% model estimate, it would mean the traditional definition of a technical recession of at least two consecutive quarters of negative inflation-adjusted growth has been met, an unsettling development considering the economy was mired in a sharp, albeit brief, recession just two years ago.
Although the economy is seemingly puttering along, persistent inflationary pressures and tight labor market conditions have necessitated the Fed to carry out its dual mandate of price stability and maximum employment through a material reduction in policy accommodation. This process has transpired in recent months to include numerous increases to the policy rate, a runoff of balance sheet assets, and hawkish forward guidance.
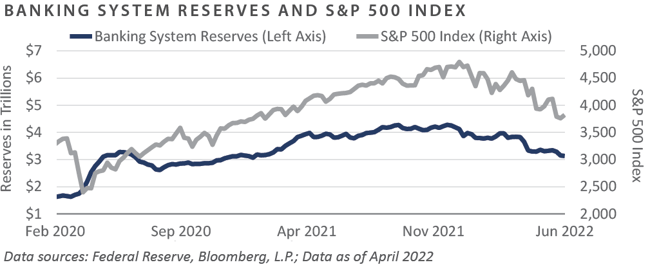
On the liquidity front, due largely to the tapering of asset purchases by the Fed since late last year and the more recent initiation of the balance sheet runoff process, the Fed has introduced significant monetary restraint on the banking system. Indeed, since reaching a peak of $4.3 trillion in December 2021, total U.S. reserve balances with Federal Reserve banks have declined by more than $1 trillion through the second quarter. The Fed's expansion of banking system liquidity appears to have been a pivotal driver of the rally behind risk assets over the past two years. Thus, the recent sharp reduction in reserves has had severe negative implications for global investor risk appetites.
Should the Fed remain steadfast in its plans to tighten the monetary reigns further in the coming quarters, particularly if in conjunction with a sharp reduction in fiscal accommodation, the likelihood for continued downside volatility across both risk assets and U.S. economic performance appears to be the unfortunate path of least resistance.
In summary, performance across financial markets and the U.S. economy took a turn for the worse in the second quarter, with some real-time gauges reflecting mounting recessionary pressures. Across the major asset classes and categories, positive-performing sectors were nearly impossible to find. This includes June’s reversal of the recent strong uptrend across global commodities—a likely reaction to the growing prospect of a downturn in global economic activity. The combination of a reduction in both monetary and fiscal accommodation—including aggressive hawkish forward guidance by the Fed stemming from multi-decade high inflation and a historically tight labor market—served as critical factors behind the sell-off across both risk and high-quality assets.
Market Returns
Global Equity
-
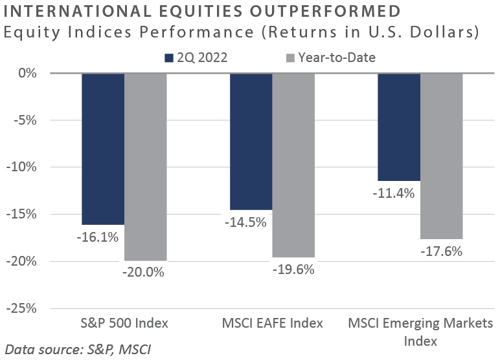
Global equity returns were down double-digits across the globe over the quarter, pushing equities into a bear market and creating the worst year-to-date performance through June in the U.S. since 1970. Macroeconomic and geopolitical headwinds continued to significantly impact market performance, with persistent inflation, increasing fears of a recession, changing central bank policy, and the ramifications of the war in Ukraine all weighing on markets.
-
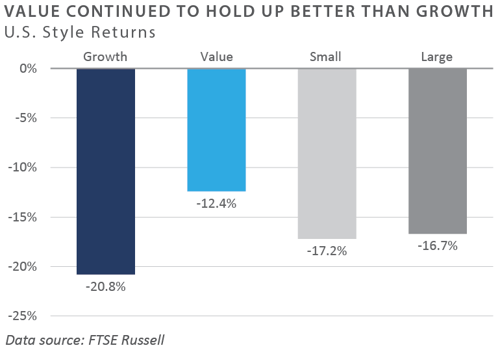
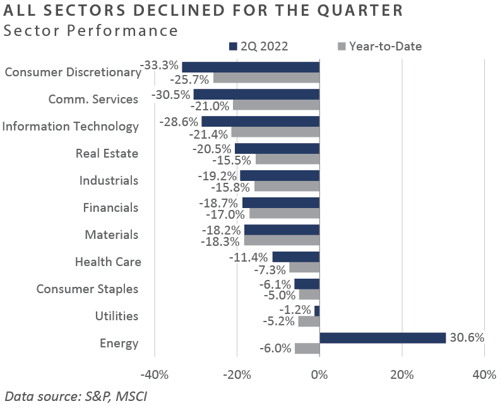
Value equities outperformed growth equities in the U.S. in the second quarter. As recession worries rose over the month, equity investors increased demand for exposures in defensive sectors such as consumer staples, utilities, and health care. The energy sector was a strong performer for the quarter amid the high price of oil, but the sector lagged in June as oil traded off its yearly high by more than $25 per barrel. Growth stocks continued to face significant headwinds as investors prioritized profitability and valuation.
-
Similar to the U.S., defensive sectors in the U.K. continue to outperform other areas of the equity market. At the end of May, U.K. Chancellor Rishi Sunak established cost of living payments to help citizens through the high inflationary environment and issued a windfall tax on energy companies receiving record profits. Together, the windfall tax and the late-quarter decline in spot oil prices pressured energy equities.
-
Inflationary pressures continued to drive financial headlines in Europe, as the European Central Bank’s (ECB) president, Christine Legarde, referenced inflation as “broadening and intensifying.” The ECB’s policy rate of -0.5% remains in negative territory, where it has been since the European Debt Crisis. Europe’s sector performance was like that of the U.S., with technology and real estate suffering some of the worst relative performance. The Russia Ukraine War has hit Germany’s gas supply the hardest; Germany may be forced to ration gas for industrial users under the nation’s three-part emergency plan if prices and supply issues continue to mount.
-
Japanese equities ended the quarter lower with declining industrial output and disrupted supply chains. The Japanese stock market continued to be heavily impacted by monetary policy and the currency market. The yen weakened relative to the U.S. dollar to below 130 yen per dollar, a level not seen in over two decades.
-
Emerging market equity performance was also negative, but emerging markets held up better than their developed market counterparts. As lockdown measures eased and manufacturing and industrial data improved, Chinese equity returns were positive for the quarter. However, China’s trading partners in Asian markets saw disappointing equity performance with slowing global trade growth.
Fixed Income
-
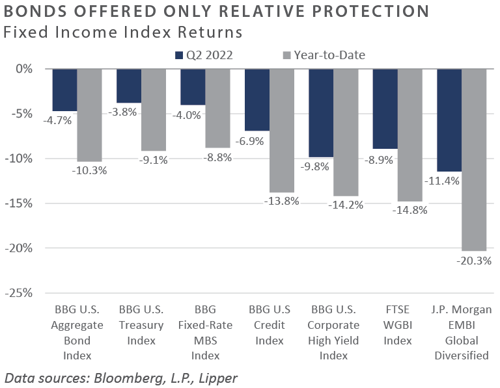
The second quarter proved to be another volatile month in the rates markets as hawkish central banks braced the market for “expeditious” rate increases. During the quarter, the 10-year U.S. Treasury yield rose 63 bps to 2.98%, after reaching a cycle high of 3.49% in June. Furthermore, the 2-year Treasury yield rocketed up 64 bps to 2.92%, causing the yield curve to flatten. Inflationary data continued to surprise to the upside. At the same time, economic activity data prints came in below expectations as market participants attempted to balance weaker economic growth against a determined central bank.
-
A combination of hawkish Fed guidance, concerns about long-term economic growth, and technicals within the TIPS market caused inflation breakevens to fall along the curve. All points along the breakeven curve remain well below the cycle highs reached earlier this year. The 2-year breakeven has fallen the most, down 1.24% to 3.25% since March. From a technical perspective, JPMorgan cited that issuance of 5- and 10-year TIPS has increased as of late and liquidity within the TIPS market is near the record-low levels witnessed during March 2020.
-
The second quarter was characterized by credit spreads widening as corporate earnings and recessionary fears drove performance. The Bloomberg U.S. Credit Index (IG) and Corporate High Yield Index (HY) returned -6.9.% and -9.8%, respectively, while the S&P/LSTA Leverage Loan 100 Index returned -5.3% for the quarter. Corporate credit markets are beginning to price in earnings concerns following disappointing guidance from bellwether names such as Target and Walmart. However, default expectations remain within historical norms and will be important to monitor. S&P and Fitch increased their 2023 default rate expectations to 3% and 1.5%, respectively. S&P noted their downside scenario of persistent rate hikes and dwindling earnings could have defaults reach 6.0%, similar to the levels realized following the brief COVID-19 recession. For historical context, default rates reached nearly 15% following the Great Financial Crisis.
-
Agency mortgages came under pressure during the second quarter as the steep increase in mortgage rates continued. The Bloomberg U.S. MBS Index returned -4.0% for the quarter, with option-adjusted spreads nearly doubling from 23 bps at the beginning of the quarter to 48 bps at quarter-end. An increase in mortgage rates also increased the expected lives of MBS securities due to a decline in prepayment expectations causing spreads to widen as market participants discounted the increased probability the Fed may have to sell mortgages outright to meet quantitative tightening (QT) guidelines. The Fed has broadcasted its intentions to focus its holdings on Treasuries and reduce exposure to mortgage securities as QT increases. There will be an acute focus on policy guidance in future FOMC meetings.
Real Assets
REAL ESTATE
-
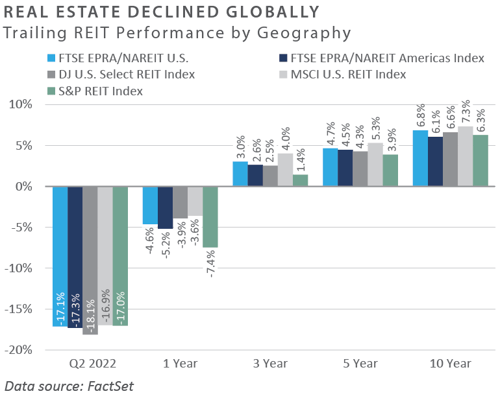
Publicly traded real estate securities (REITs) continued to decline through the end of the second quarter as the increased risk of a broader recession exacerbated the effects of rising interest rates that plagued REITs at the beginning of the quarter. Those sectors most exposed to consumer confidence underperformed in the second quarter—most notably lodging, which had outperformed earlier in the year driven by the recovery in business and leisure travel. Office REITs underperformed as high vacancy rates across most major metropolitan areas persisted due to employees continuing to work remotely. Office properties face continued headwinds as rents roll over to lower rates.
-
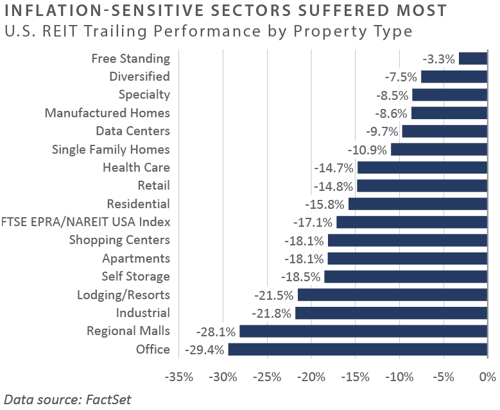
On a year-to-date basis, regional malls, office, industrial, and data center REITs have experienced heightened selling pressure as investors assess the headwinds of rising interest rates and slower economic growth. The regional malls sector, one of the top performers in 2021, has been negatively impacted by weakening consumer sentiment. Industrial REITs declined following news that Amazon was subleasing warehouse space, potentially adding supply to the market. Data centers have faced weaker pricing power among hyper-scale tenants. Alternatively, diversified REITs outperformed on a relative basis through 2022, experiencing a narrower decline compared to the broader market. These companies benefited from exposure to net-lease properties with less sensitivity to slower economic growth.
NATURAL RESOURCES
-
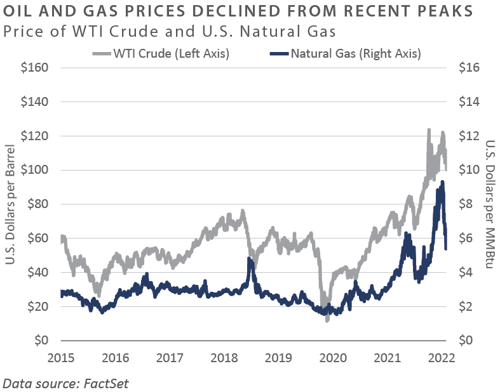
Reversing their strong upward trend in 2022, energy-related commodity prices fell during the month, with WTI crude oil closing at just under $106/barrel. Crude prices have benefited from multiple tailwinds, including the war in Ukraine and a decade of declining capital expenditures by upstream energy companies; however, prices fell late in the quarter on concerns of a potential recession. U.S. natural gas prices also fell to $5.39 from a multi-year high of $9.32 earlier in the month following the news of a longer-than-expected outage of the Freeport LNG terminal, as the facility is continuing to repair damage sustained during a fire earlier in the year. International natural gas prices continued to see material price appreciation as the lack of export capacity from the U.S. compounded the acute energy supply-demand imbalance across Europe.
-
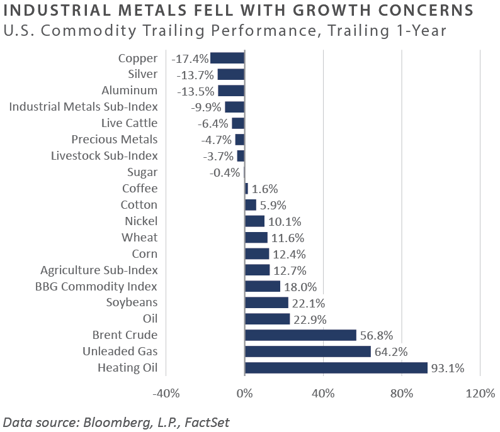
Commodities declined sharply in June but have still outperformed on a year-to-date basis due to earlier strong gains. Energy-related commodities held the lead by outperforming grains and industrial metals year-to-date. Soft commodities prices for industrial metals, including copper, aluminum, and nickel, fell through the second quarter on concerns of weaker demand due to a potential global recession.
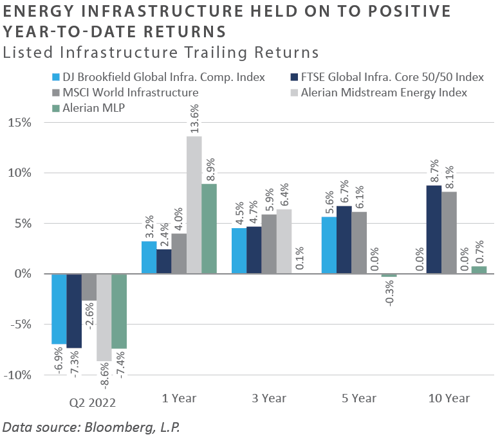
INFRASTRUCTURE
-
Midstream energy infrastructure outperformed the broader equity markets in the second quarter and year-to-date. While fundamentals remain strong in the midstream sector due to deleveraging and growing cash flows, lower energy-related commodity prices led to a sell-off in midstream companies late in the second quarter.
-
Listed infrastructure equity returns were also negative for the quarter, turning negative year-to-date. All sectors posted negative performance for the quarter—apart from toll roads—with the most significant drawdowns hitting the utility and midstream sectors. Year-to-date, the telecommunications and renewable sectors underperformed, as growth-related infrastructure has experienced similar drawdowns to that of the broader growth-related equity market.
Diversifying Strategies
-
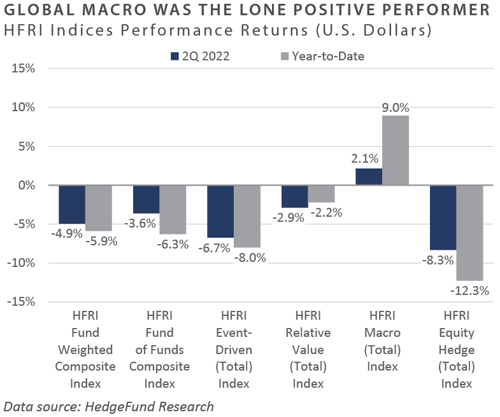
All main hedge fund strategies were detractors for the quarter except global macro, which generated a modest gain. Equity hedge continued to be the most significant laggard, followed by event-driven strategies.
-
Systematic macro managers were once again strong performers in the second quarter. Leading the gains was long exposure to the U.S. dollar, short fixed income, short equities, and short base metals.
-
Hedge equity managers struggled, with both growth and value strategies declining. Technology-focused managers were outliers to the downside, while healthcare had a slight rebound towards the end of the quarter.
-
Event-driven manager returns were negative across the board based on underlying strategy focus. Activist strategies were the largest detractors as equity volatility impacts them most directly.
INDICES
The Alerian MLP Index is a composite of the 50 most prominent energy Master Limited Partnerships that provides investors with an unbiased, comprehensive benchmark for this emerging asset class.
Barclays Capital Fixed Income Indices is an index family comprised of the Barclays Capital Aggregate Index, Government/Corporate Bond Index, Mortgage-Backed Securities Index, and Asset-Backed Securities Index, Municipal Index, High-Yield Index, and others designed to represent the broad fixed income markets and sectors within constraints of maturity and minimum outstanding par value. See https://ecommerce.barcap.com/indices/index.dxml for more information.
The CBOE Volatility Index (VIX) is an up-to-the-minute market estimate of expected volatility that is calculated by using real-time S&P 500 Index option bid/ask quotes. The Index uses nearby and second nearby options with at least 8 days left to expiration and then weights them to yield a constant, 30-day measure of the expected volatility of the S&P 500 Index. FTSE Real Estate Indices (NAREIT Index and EPRA/NAREIT Index) includes only those companies that meet minimum size, liquidity and free float criteria as set forth by FTSE and is meant as a broad representation of publicly traded real estate securities. Relevant real estate activities are defined as the ownership,
HFRI Monthly Indices (HFRI) are equally weighted performance indexes, compiled by Hedge Fund Research Inc. (HFX), and are used by numerous hedge fund managers as a benchmark for their own hedge funds. The HFRI are broken down into 37 different categories by strategy, including the HFRI Fund Weighted Composite, which accounts for over 2,000 funds listed on the internal HFR Database. The HFRI Fund of Funds Composite Index is an equal weighted, net of
J.P. Morgan’s Global Index Research group produces proprietary index products that track emerging markets, government debt, and corporate debt asset classes. Some of these indices include the JPMorgan Emerging Market Bond Plus Index, JPMorgan Emerging Market Local Plus Index, JPMorgan Global Bond Non-US
Merrill Lynch high yield indices measure the performance of securities that pay interest in cash and have a credit rating of below investment grade. Merrill Lynch uses a composite of Fitch Ratings, Moody’s and Standard and Poor’s credit ratings in selecting bonds for these indices. These ratings measure the risk that the bond issuer will fail to pay interest or to repay principal in full. See www.ml.com for more information.
Morgan Stanley Capital International – MSCI is a series of indices constructed by Morgan Stanley to help institutional investors benchmark their returns. There
Russell Investments
S&P 500 Index consists of 500 stocks chosen for market size, liquidity and industry group representation, among other factors by the S&P Index Committee, which is a team of analysts and economists at Standard and Poor's. The S&P 500 is a market-value weighted index, which means each stock’s weight in the index is proportionate to its market value and is designed to be a leading indicator of U.S. equities, and meant to reflect the risk/return characteristics of the
Information on any indices mentioned can be obtained either through your advisor or by written request to information@feg.com.
DISCLOSURES
This report was prepared by FEG (also known as Fund Evaluation Group, LLC), a federally registered investment adviser under the Investment Advisers Act of 1940, as amended, providing non-discretionary and discretionary investment advice to its clients on an individual basis. Registration as an investment adviser does not imply a certain level of skill or training. The oral and written communications of an adviser provide you with information about which you determine to hire or retain an adviser. Fund Evaluation Group, LLC, Form ADV Part 2A & 2B can be obtained by written request directly to: Fund Evaluation Group, LLC, 201 East Fifth Street, Suite 1600, Cincinnati, OH 45202, Attention: Compliance Department.
The information herein was obtained from various sources. FEG does not guarantee the accuracy or completeness of such information provided by third parties. The information in this report is given as of the date indicated and believed to be reliable. FEG assumes no obligation to update this information, or to advise on further developments relating to it. FEG, its affiliates, directors, officers, employees, employee benefit programs and client accounts may have a long position in any securities of issuers discussed in this report.
Index performance results do not represent any managed portfolio returns. An investor cannot invest directly in a presented index, as an investment vehicle replicating an index would be required. An index does not charge management fees or brokerage expenses, and no such fees or expenses were deducted from the performance shown.
Bloomberg Index Services Limited. BLOOMBERG® is a trademark and service mark of Bloomberg Finance L.P. and its affiliates (collectively “Bloomberg”). Bloomberg or Bloomberg’s licensors own all proprietary rights in the Bloomberg Indices. Bloomberg does not approve or endorse this material or guarantee the accuracy or completeness of any information herein, nor does Bloomberg make any warranty, express or implied, as to the results to be obtained therefrom, and, to the maximum extent allowed by law, Bloomberg shall not have any liability or responsibility for injury or damages arising in connection therewith.
Neither the information nor any opinion expressed in this report constitutes an offer, or an invitation to make an offer, to buy or sell any securities.
Any return expectations provided are not intended as, and must not be regarded as, a representation, warranty or predication that the investment will achieve any particular rate of return over any particular time period or that investors will not incur losses.
Past performance is not indicative of future results.
Investments in private funds are speculative, involve a high degree of risk, and are designed for sophisticated investors.
All data is as of June 30, 2022 unless otherwise noted.