Venture Capital—Maverick Investments in a Changing Market?
The second quarter saw the wildly successful premiere of Top Gun: Maverick, the sequel to the original Top Gun from 1986. The movie has now grossed over $1.0 billion worldwide and is among the top 10 movies with the highest domestic grossing box office. The main character’s call sign, Maverick, captures his approach to life and his career as a Navy pilot but also draws similarities to some of the venture capital behavior in recent years. Maverick approached his job as a test pilot with little regard for orthodox rules and a willingness to push it to the limit with the people around him and the aircraft he flew. In an early scene, Captain Pete “Maverick” Mitchell took an SR-72 Darkstar prototype aircraft past the authorized speed of Mach 10. The plane’s inability to withstand the high speed resulted in it effectively blowing up, though Maverick ejected and safely walked away.
One cannot help but wonder if the current situation in the venture capital market is similar. After years of record-high valuations fueled by what seemed to be an endless supply of capital and willingness for risk-taking, a new era of venture capital could be on the horizon—a period marked by inflation, slowing economic growth, and money that is far more precious than in recent years. It is wise to understand how we arrived here before assessing how to proceed in the future.
VENTURE'S RISE
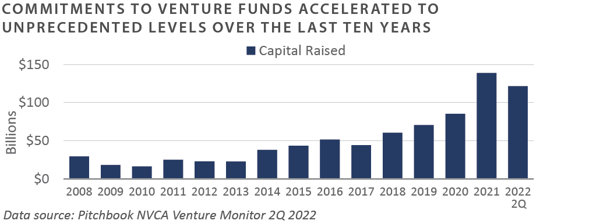
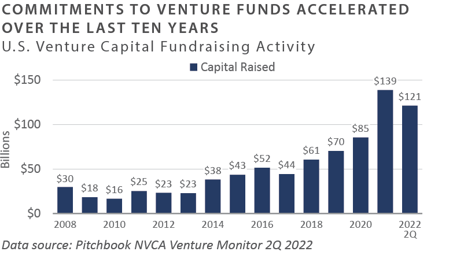
Following the global financial crisis, investors steadily allocated more capital to illiquid strategies to reach their return targets, due partly to the broader opportunity set in the private markets. Venture capital fundraising in 2021 was 5.5x greater than in 2011. This is the primary fuel source for the venture engine, but not the only one.
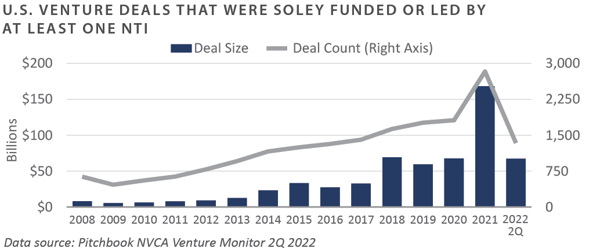
Fundraising for venture funds does not account for all-cash invested in venture-backed technology companies. As venture fund performance improved, public equity investors (crossovers), such as hedge funds and corporations (strategics), took notice of the growth opportunities and shifted assets accordingly. These non-traditional investors (NTI) effectively opened up the throttle and flooded an engine that was already running hot with gasoline.
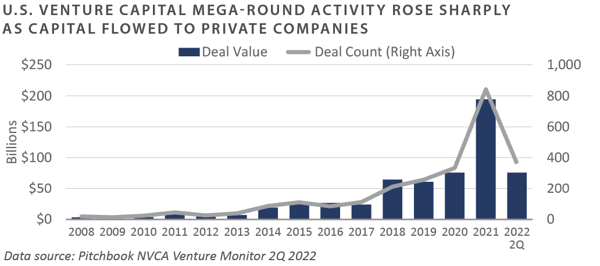
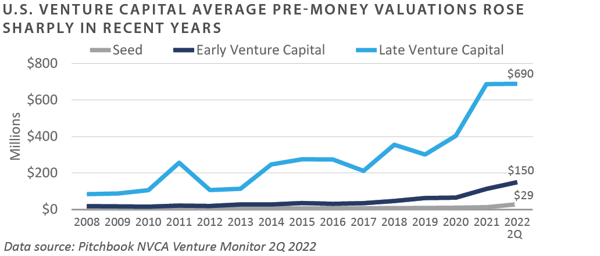
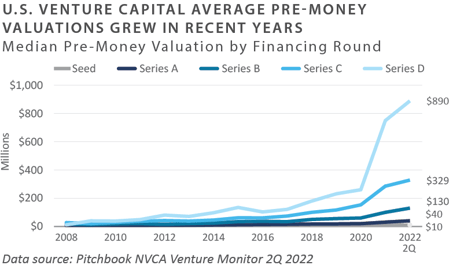
Pre-money valuations rose in conjunction with the capital flowing into the industry. Companies could stay private longer and raise financing rounds previously only available with public offerings. So-called mega-rounds, financing rounds of at least $100 million in capital, accelerated through the late 2010s before reaching new highs in 2021.
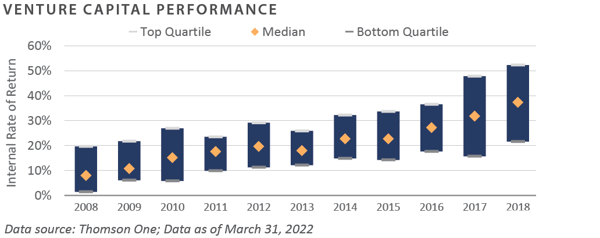
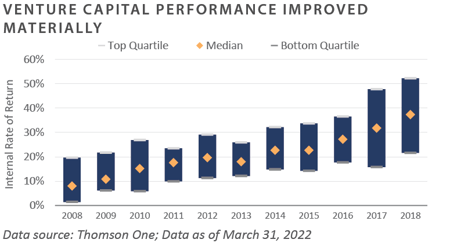
This confluence of events resulted in record pre-money valuations and strong industry-wide performance, seeing internal rates of return (IRRs) of 25% or greater.
After years of driving performance in the public market, valuations of publicly traded technology stocks fell closer to historical norms in 2022. The S&P 500 technology sector fell 26.9% through June 30, and most growth indices trailed their value counterparts in 2022. The valuation compression is slowly making its way to the private markets and will impact venture funds in various ways in the near and long term.
What to Expect in the Near Term
EXISTING HOLDINGS — VALUATION HEADWINDS AND FEWER EXITS
The pullback in the market could create challenges for existing privately held portfolio companies and capital on the ground. Valuation multiples will likely compress, though it is not expected to be as dramatic as the public market comparable companies, which are more dynamic. If the economy slows, revenue and earnings before interest, taxes, depreciation, and amortization (EBITDA) growth could also be under pressure. The initial public offering (IPO) market was the fastest to react to the current downturn, with venture-backed public listings falling sharply in 2022. There were nearly 300 venture-backed public listings in 2021 compared to 11 in the second quarter of 2022, the lowest quarterly level since 2016.
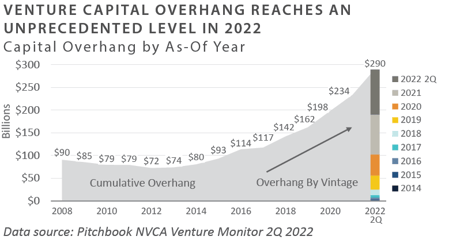
UNCALLED CAPITAL — A VALUABLE THOUGH ABUNDANT RESOURCE
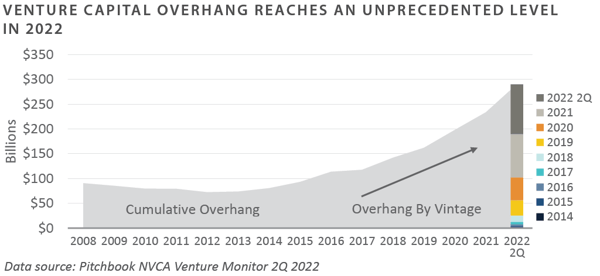
Venture funds with uncalled capital are positioned to invest at more attractive valuations if multiples come down. Uncalled capital could be an investor’s most valuable resource, as it is effectively cash waiting to be deployed in what could be a different environment. The caveat is investors need to be aware there is a significant capital overhang, reflecting the robust fundraising market in recent years. The ramifications on new investments will take some time to recalibrate among venture funds, founders/entrepreneurs, and other market participants.
NEW COMMITMENTS — IS NOW A GOOD TIME TO INVEST?
New commitments are one aspect limited partners can control. Various factors influence the decision of how much to commit to venture funds versus other opportunities. First, venture fund investment periods can last up to five years. This is not an area of the market where tactical adjustments can be made based on current market conditions. There will likely be multiple market cycles through the investment period and a fund’s 10-year-plus life. Second, a limited partner needs to consider the relative attractiveness and importance of other strategies that might not be as long-lived. For example, secondary and distressed/turnaround funds might also find the current market attractive with shorter hold periods. Further, limited partners need to consider liquidity needs and risk tolerance.
What to expect in the long term
Private equity and venture capital funds have the potential to continue offering opportunities for premium performance relative to the public market over time. New company formation by entrepreneurs is relatively unaffected by broader economic or financial needs. Manager selection will grow in importance as industry-wide IRRs of 25% or more are unlikely to be sustainable over the long term. Hold periods may extend, and performance may moderate from recent vintage years. Finally, including high-quality venture funds through thoughtful selection as part of a broader private equity portfolio has the potential to give investors an avenue for attractive return opportunities.
Conclusion
The most boring advice is also the soundest in these times. First, investors need to ensure the proper long-term target allocation to private equity is set to best fit the portfolio's return objectives and risk parameters. Second, investors should continue allocating capital with new commitments to high-quality managers to reach the target allocation. Third, focus on building a diversified private equity portfolio positioned to perform across various market cycles. This includes funds with high risk/return profiles such as venture capital and growth equity, funds with more conservative strategies such as buyout funds investing in family-owned businesses, opportunistic strategies in the distressed category, and secondary funds that provide liquidity to those in need.
Having a couple of Mavericks in the portfolio has the potential to help you achieve missions that are otherwise impossible to complete. However, having a portfolio of Mavericks could lead to large amounts of capital going up in flames like the Darkstar aircraft.
Private Equity
Venture Capital
-
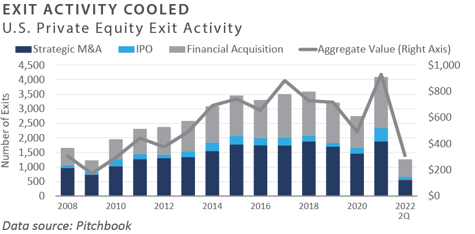
The public market declines in the first half of the year—particularly the volatility in the technology sector—affected venture capital activity in various ways. Exit activity fell quickly as companies hesitated to list on the public market during a sell-off. Fundraising and investing activity were only mildly affected based on year-to-date activity levels.
-
U.S. venture funds raised $121 billion in the first half of 2022. Large funds drove the fundraising data, as funds with over $1.0 billion in assets accounted for almost two-thirds of aggregate capital raised in 2022. Investment activity was robust, with over $140 billion invested across over 7,800 companies in the first half of the year, though short of last year’s record pace.
-
Pre-money valuations continued to rise for venture-backed companies across all stages, particularly for later-stage financings—Series C and Series D—in the first half of 2022.
-
The record amount of dry powder is a contributing factor in the robust investment activity and high valuations. As of June 30, 2022, venture capital funds held $290 billion of uncalled capital, more than twice the amount in the first half of 2018.
-
The pullback in the exit market was swift and robust. Exit activity fell to the lowest level since the onset of COVID-19.
-
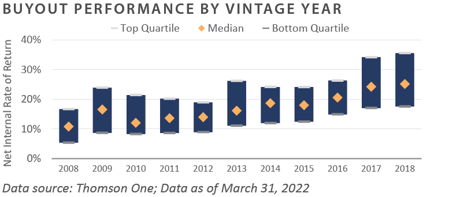
Venture performance has remained strong; however, returns will be affected if the exit markets remain closed and hold periods extend.
INVESTOR IMPLICATIONS
Investors should be prepared for volatility due to high valuations and capital flows.
Leveraged Buyouts
-
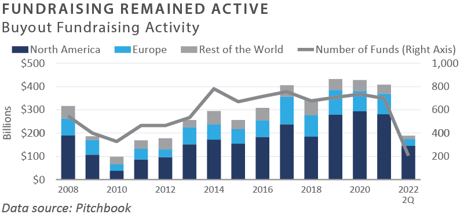
Fundraising for private equity funds remained robust during the first half of 2022. Year-to-date, more than $188 billion has been raised by 206 funds.¹ This number is likely to grow as at least eight funds are currently fundraising or coming to market with a combined target fund size of $20 billion or more.²
-
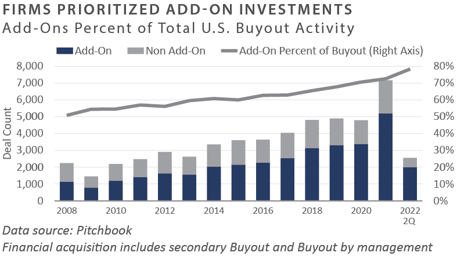
Despite a slowdown in the second quarter, deal value and volume remained strong. As of June 30, 2022, year-to-date deal value and volume rose 7% and 11%, respectively, from the same period last year.³ Add-ons accounted for more than 78% of transaction volume.⁴
-
Purchase prices remain elevated. As of June 30, 2022, the median rolling four-quarter buyout multiple was 15.4x EBITDA. The median Debt/EBITDA ratio was 6.5x EBITDA, which is also elevated from a historical perspective.⁵
-
Private equity exit activity fell sharply during the second quarter. Year-to-date, exit values and volume are down 45% and 21%, respectively, from the same time last year.
6Sales to strategic or financial acquirers represented most U.S. private equity-backed exits by volume.7 -
Private equity performance was strong through the first quarter of 2022, the most recent data available. The spread between the top and bottom quartile managers remained above 1,000 basis points.8
INVESTOR IMPLICATIONS
Recent volatility in the public markets is likely to hurt private equity performance in coming quarters. Deal volume—including exit activity—is expected to slow in the back half of 2022. Investors should remain cautious and continue to partner with experienced managers focused on creating value via operational improvements instead of financial engineering.
1-7 Pitchbook
8 Refinitiv; Data as of March 31, 2022
Private Debt
-
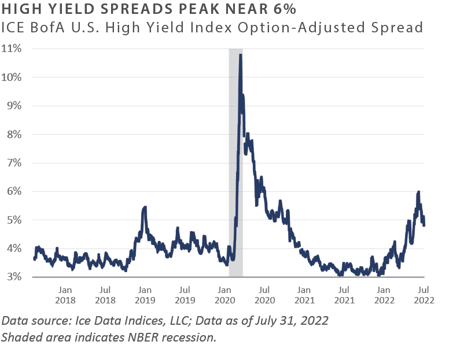
The second quarter of 2022 saw wider credit spreads as the markets priced in higher inflation and a growing potential for recession in the U.S. High yield bond spreads started the year at 3.1% and exceeded their historical average, hitting 5.9% as of June 30.¹
-
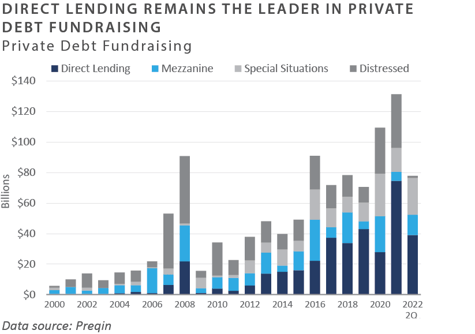
Year-to-date private distressed debt fund-raising has totaled $1.3 billion, well off the pace of the $30 billion and $35 billion raised in 2020 and 2021, respectively. Special situations funds, which are comparable to pure distressed funds, have raised $24 billion, far more than the $15.7 billion raised during the same period in 2021.²
-
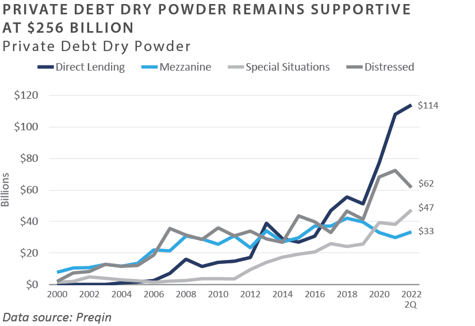
After a soft first quarter, private debt fundraising increased in the second quarter of 2022 and is on pace to exceed 2021’s all-time high of $131.3 billion. Direct lending continues to take the lion’s share of the fundraising effort, as it did in 2021.³
-
In the private lending area, the median Debt/EBITDA ratio was 6.5x, which remains elevated, as is the case with purchase price multiples. Given the expectation that private equity transactions will be marked down somewhat in the second quarter, private loans are likely to be marked down in kind, albeit at lower levels, due to their higher place in the capital structure. Dry powder in the private debt sphere remains high at $256 billion, suggesting ample room for support for transactions that become challenged by changing conditions.⁴
INVESTOR IMPLICATIONS
The narrative for the markets and the U.S. economy has shifted toward one of bearish alarms. With the Federal Reserve remaining focused on raising rates and reducing its balance sheet, risk assets have declined in value. As the cycle continues to unfold, investors should stay with seasoned lenders and begin to anticipate the next distressed cycle. As such, FEG expects an increase in distressed debt funds to be raised in the back half of 2022 and into 2023.
1 Ice BofA US High Yield Master II Index
2,3 Preqin Alternatives 2Q22
4 Pitchbook
Private Real Estate
-
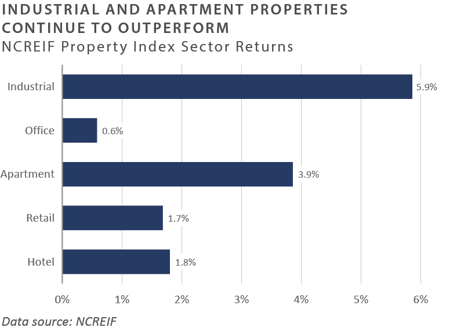
The National Council of Real Estate Investment Fiduciaries (NCREIF) Property Index (NPI) posted a gain of 3.2% during the second quarter and returned 21.5% on a trailing 1-year basis. Industrial properties continued to outperform, with a total return of 5.9% in the second quarter and 48% on a trailing 1-year basis. Alternatively, office properties underperformed, with only a 5.8% gain on a trailing 1-year basis. Market value-weighted capitalization rates held steady at 3.7% during the quarter, well below the long-term average NPI cap rate of 6.6%.¹
-
Transaction volume in multifamily and industrial remained strong through mid-year; however, commercial-property sales volume is expected to slow due in large part to higher interest rates. Blackstone continued to lead the real estate acquisition market as it sought to deploy massive capital raised across its real estate platform over the past year. During the second quarter, the firm announced the acquisition of American Campus Communities—the largest student housing REIT—for $13 billion, a 22% premium on its share price.² Publicly traded REITs have become a target for Blackstone because they allow an immediate foothold into specific property types.
-
Mega-funds continue to dominate the fundraising landscape. In July, Blackstone announced it had raised $24 billion for its latest opportunistic private real estate fund, Blackstone Real Estate Partners X, and expected the fund to reach $30 billion. Dry powder—i.e., available capital—for private real estate totaled over $390 billion at the end of the second quarter.³
-
In addition to the capital available for private value-add, opportunistic, and core strategies, Blackstone recorded $9.8 billion of new inflows into its BREIT fund during the first quarter. With a lower cost of capital than value-add or opportunistic real estate funds, these funds could represent another source of competition for deals.
-
After a solid start to the year, commercial mortgage-backed security (CMBS) issuance dropped in the second quarter due to higher interest rates, lower volumes of property transactions, and widening credit spreads. Banks continue to lend on multifamily and industrial properties; however, financing for office, retail, and hotels is limited or unavailable. Lenders have tightened underwriting standards, focusing on debt service coverage and near-term maturities given the higher rate environment. The volume of delinquent CMBS loans and those in special servicing is expected to rise in the year’s second half.
INVESTOR IMPLICATIONS
Following a decade of strong returns, real estate faces headwinds from higher interest rates, inflation, and fears of a potential recession. Rising interest rates and record-low cap rates have left many real estate investors facing negative leverage, which occurs when borrowing costs exceed cap rates. Industrial and multifamily properties remain institutional investors' most favored property types and continue to trade at record-low cap rates. FEG expects private real estate valuations to trend lower as investors reassess the impact of higher interest rates on property values. Transaction volume is expected to also slow after reaching record-highs in 2021. Depending on the leverage and property type, selective distressed opportunities in real estate could begin to emerge.
1 NCREIF
2 Blackstone, May 6, 2022
3 Preqin, July 2022
Natural Resource
-
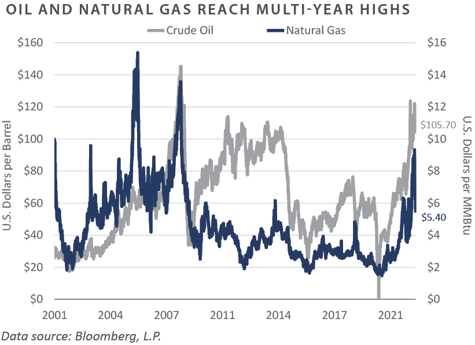
Oil prices rose 5.5% during the second quarter, closing at $105.76/barrel, compared to $100/barrel at the end of the first quarter. This represented a multi-year high for oil prices and a level not seen since 2014. Ongoing supply disruptions arising from sanctions against Russia continued to put upward pressure on prices. Growing demand also contributed to higher prices as global economies emerged from pandemic shutdowns, leading to a pickup in travel. Additionally, OPEC has continued to fall short of its production targets, reinforcing concerns about tighter supply. Despite high energy prices, publicly traded U.S. oil and gas production companies have been reluctant to pursue new drilling due in part to pressure from shareholders to return capital in the form of dividends and share buybacks.¹
-
After a 51% gain in the first quarter, natural gas prices fell 3.9% in the second quarter, closing at $5.42/MMBtu. Concerns about natural gas supplies in Europe have been a critical factor driving natural gas prices in the first half of the year.² Europe is seeking to reduce its dependence on Russian natural gas imports; however, the region faces limited options to replace supplies apart from liquid natural gas imports. Still, it lacks the necessary infrastructure to support imports. Underinvestment in natural gas drilling over the past seven years coupled with increased demand for natural gas liquids from Europe and Asia has the potential to push prices higher.³
-
Despite improving oil and natural gas prices, the appetite among institutional investors for upstream energy funds remains limited, making fundraising a challenge. Endowments and foundations continue pledging to divest from fossil fuels, unwind their existing private energy investments, and commit to making no new upstream energy investments. Much of the capital being committed to private energy today is in renewables or “energy transition” strategies, and many upstream managers have pivoted to these types of offerings. EnCap, for example, is back in the market, seeking to raise up to $2 billion in committed capital for its second energy transition fund, with other large upstream managers launching similar strategies.⁴ Nevertheless, a handful of upstream private energy funds in the market have successfully raised capital
- According to Baker Hughes, the total U.S. rig count increased 12% in the second quarter to 753 rigs—compared to 670 rigs at the end of the first quarter. The U.S. natural gas rig count finished the quarter at 157, up from 137 at the end of the first quarter. The U.S. oil rig count rose 12% to 594 rigs, up from 531 at the end of the first quarter. Notably, rig counts have not kept pace with commodity prices and remain well below levels seen at the prior peak.⁵
INVESTOR IMPLICATIONS
The dramatic improvement in energy-related commodity prices from the lows of 2020 has thus far failed to attract significant new capital from investors. As a result, energy remains one of the only sectors in the private capital landscape that has not seen significant inflows, reducing competition for deals. The ongoing focus is on “energy transition,” with investors continuing to divest from fossil fuels. Meanwhile, fundamentals are improving as energy companies pay down debt and emphasize free cash flow generation over new drilling. The S&P 500 Energy sector gained 31% in the first half of 2022. Valuations for private equity energy and resources funds continued to trend upward in the year’s first half.
1, 2, 3 Energy Information Administration, www.eia.gov
4 EnCap, March 20222
5 Baker Hughes
INDICES
Bloomberg Barclays US Corporate High Yield Index represents the universe of fixed rate, non-investment grade debt. Eurobonds and debt issues from countries designated as emerging markets are excluded, but Canadian and global bonds (SEC registered) of issuers in non-EMG countries are included. The index includes the corporate sectors: Industrials, Utilities, and Finance, encompassing both U.S. and non-U.S. Corporations. See www.bloomberg.com for more information.
The Russell Indices are constructed by Russell Investment. There are a wide range of indices created by Russell covering companies with different market capitalizations, fundamental characteristics, and style tilts. See www.russellinvestments.com for more information.
The FTSE NAREIT Composite Index (NAREIT) includes only those companies that meet minimum size, liquidity and free float criteria as set forth by FTSE and is meant as a broad representation of publicly traded REIT securities in the U.S. Relevant real estate activities are defined as the ownership, disposure, and development of income-producing real estate. See www.ftse.com/Indices for more information.
The S&P 500 Index is capitalization-weighted index of 500 stocks. The S&P 500 Index is designed to measure performance of the broad domestic economy through changes in the aggregate market value of 500 stocks representing all major industries.
The NCREIF Property Index is a quarterly time series composite total rate of return measure of investment performance of a very large pool of individual commercial real estate properties acquired in the private market for investment purposes only.
HFRI ED: Distressed/Restructuring Index — Distressed/Restructuring strategies which employ an investment process focused on corporate fixed income instruments, primarily on corporate credit instruments of companies trading at significant discounts to their value at issuance or obliged (par value) at maturity as a result of either formal bankruptcy proceeding or financial market perception of near term proceedings. Managers are typically actively involved with the management of these companies, frequently involved on creditors' committees in negotiating the exchange of securities for alternative obligations, either swaps of debt, equity or hybrid securities. Managers employ fundamental credit processes focused on valuation and asset coverage of securities of distressed firms; in most cases portfolio exposures are concentrated in instruments which are publicly traded, in some cases actively and in others under reduced liquidity but in general for which a reasonable public market exists. In contrast to Special Situations, Distressed Strategies employ primarily debt (greater than 60%) but also may maintain related equity exposure.
Information on any indices mentioned can be obtained either through your advisor or by written request to information@feg.com.
DISCLOSURES
This report was prepared by Fund Evaluation Group, LLC (FEG), a federally registered investment adviser under the Investment Advisers Act of 1940, as amended, providing non-discretionary and discretionary investment advice to its clients on an individual basis. Registration as an investment adviser does not imply a certain level of skill or training. The oral and written communications of an adviser provide you with information about which you determine to hire or retain an adviser. Fund Evaluation Group, LLC, Form ADV Part 2A & 2B can be obtained by written request directly to: Fund Evaluation Group, LLC, 201 East Fifth Street, Suite 1600, Cincinnati, OH 45202, Attention: Compliance Department.
The information herein was obtained from various sources. FEG does not guarantee the accuracy or completeness of such information provided by third parties. The information in this report is given as of the date indicated and believed to be reliable. FEG assumes no obligation to update this information, or to advise on further developments relating to it. FEG, its affiliates, directors, officers, employees, employee benefit programs and client accounts may have a long position in any securities of issuers discussed in this report.
Index performance results do not represent any managed portfolio returns. An investor cannot invest directly in a presented index, as an investment vehicle replicating an index would be required. An index does not charge management fees or brokerage expenses, and no such fees or expenses were deducted from the performance shown.
Bloomberg Index Services Limited. BLOOMBERG® is a trademark and service mark of Bloomberg Finance L.P. and its affiliates (collectively “Bloomberg”). Bloomberg or Bloomberg’s licensors own all proprietary rights in the Bloomberg Indices. Bloomberg does not approve or endorse this material or guarantee the accuracy or completeness of any information herein, nor does Bloomberg make any warranty, express or implied, as to the results to be obtained therefrom, and, to the maximum extent allowed by law, Bloomberg shall not have any liability or responsibility for injury or damages arising in connection therewith.
Neither the information nor any opinion expressed in this report constitutes an offer, or an invitation to make an offer, to buy or sell any securities.
Any return expectations provided are not intended as, and must not be regarded as, a representation, warranty or predication that the investment will achieve any particular rate of return over any particular time period or that investors will not incur losses.
Past performance is not indicative of future results.
Investments in private funds are speculative, involve a high degree of risk, and are designed for sophisticated investors.
An investor could lose all or a substantial amount of his or her investment. Private capital funds’ fees and expenses may offset private capital funds’ profits. Private capital funds are not required to provide periodic pricing or valuation information to investors except as defined in the fund documents. Private capital funds may involve complex tax structures and delays in distributing important tax information. Private capital funds are not subject to the same regulatory requirements as mutual funds. Private capital funds are not liquid and require investors to commit to funding capital calls over a period of several years; any default on a capital call may result in substantial penalties and/or legal action. Private capital fund managers have total authority over the private capital funds. The use of a single advisor applying similar strategies could mean lack of diversification and, consequently, higher risk.
All data is as of June 30, 2022 unless otherwise noted..