Financial markets came under considerable pressure in the second quarter as steep losses plagued the breadth of the major asset classes and categories. Risk assets—particularly growth equities—bore the brunt of the downside witnessed throughout the quarter, while traditional safe havens, such as precious metals and core bonds, failed to hedge against the downside volatility experienced across risk assets. Persistent inflationary momentum, including an upside surprise across consumer price inflation in June, continued to remain a primary concern for the Federal Reserve (Fed), Wall Street, and Main Street alike, despite aggressive actions taken by policymakers to temper the upward trajectory. Economic slowdown fears mounted throughout the quarter, with some gauges reflecting an elevated likelihood the U.S. economy may already be in recession.
Similar to the first quarter, global equities posted broad-based losses in the second quarter, with the interest rate sensitive corners of the market, such as growth stocks, suffering the steepest declines. While also negative in absolute terms, international developed and emerging market equities relatively outperformed domestic, despite a further strengthening of the U.S. dollar (USD) and slightly more stable economic fundamentals. From a capitalization standpoint, small cap stocks underperformed their large cap counterparts for the fifth consecutive quarter.
Diversified investors were unable to rely on the traditional hedging qualities of bonds during periods of equity market volatility—a theme also in place during the first three months of the year—as multi-decade high inflation, multiple Fed rate hikes, and hawkish forward guidance helped send interest rates significantly higher. In addition to negative performance among the higher quality sectors of the bond market, below-investment grade credit also posted negative performance, as risk premiums spiked amid growing prospects for a receding economy. Relatedly, the slope of the Treasury yield curve, while essentially unchanged on the quarter, has come under considerable pressure in the early trading activity of the third quarter, with many term structure spreads firmly inverted.
Bucking the trend of recent quarters, performance across real assets was overwhelmingly negative in the second quarter—with much of the downside experienced in June—as investors presumably repositioned exposures to reflect an economic slowdown bias. While performance in aggregate appeared negative, when compared to competing risk categories such as global equities, real asset returns in aggregate were relatively stronger, likely reflecting the continued positive inflationary bias.
KEY MARKET THEMES AND DEVELOPMENTS
Threat of Stagflation Comes into Focus as Inflation Accelerates Further, Economic Activity Stalls
For the decade-plus between the end of the 2007-2009 Global Financial Crisis and the COVID-19 pandemic, most major developed market policy-setting bodies struggled to implement monetary policies that supported elevated inflation. Relatively contained inflation and interest rates were a key factor underpinning the rally across risk assets during this timeframe.
Today, investors and the general populace are facing the most significant inflationary issue since the 1970s-1980s when the U.S. economy was grappling with President Nixon’s price and wage control measures, a disorderly rise in oil prices, the conclusion of the Bretton Woods monetary system, and the associated sharp depreciation of the U.S. dollar.
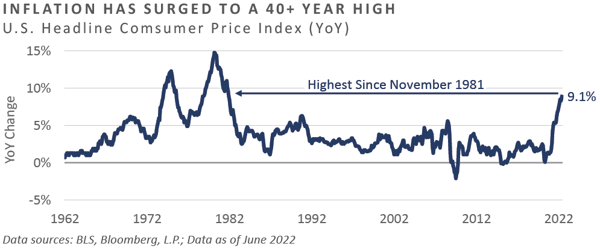
Despite continued policy efforts to date at tempering inflation—most notably numerous hikes to the federal funds rate, the initiation of quantitative tightening through the shrinkage of balance sheet assets, hawkish forward guidance, and a pronounced deceleration in the pace of federal expenditures—recent inflation data indicates little near-term relief. For example, through June, the Consumer Price Index (CPI) accelerated to a 9.1% annual pace, a level not witnessed since 1981 and a rate that exceeded the Bloomberg median consensus estimate, which reflected an 8.8% expectation.
The inflation experienced so far in 2022 has been particularly painful to endure versus the above-trend inflation witnessed in 2021, particularly when viewed through the inflation-adjusted performance of the financial markets. For example, the often-cited 60/40 portfolio allocation of 60% U.S. large cap stocks (S&P 500 Index) and 40% core bonds (Bloomberg U.S. Aggregate Index) produced an impressive total return of 16.6% in 2021, before accounting for inflation.
Adjusting for the 7.0% year-over-year increase in headline inflation yields a real return below 10%—still a strong calendar year inflation-adjusted return. Conversely, through the first six months of 2022 the 60/40 portfolio posted a loss of comparable magnitude to the gain experienced in 2022, with a decline of 16.1%, while inflation developed an increasing amount of momentum.
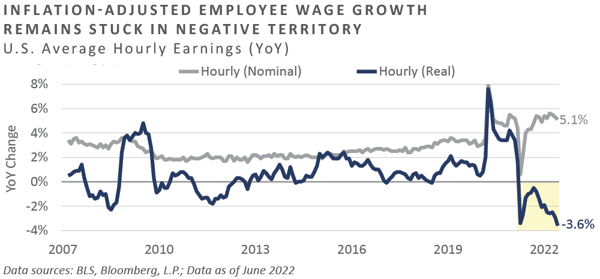
The most recent labor market and inflation data highlights the significant burden placed on U.S. workers. Through June, annual employee wage growth of hourly earners stood at a cyclically elevated pace of 5.1%, leading some pundits to believe U.S. consumer fundamentals are strong. Accounting for the effects of inflation, however, results in an inflation-adjusted rate of -3.6%, representing 15 consecutive months of negative real wage growth.
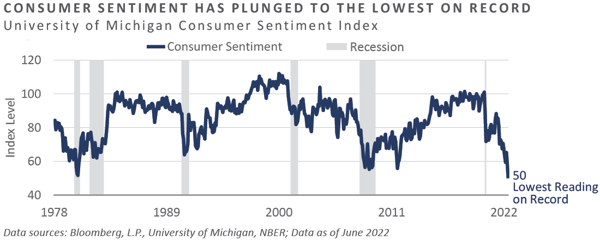
Persistent negative real wage growth has been a major factor behind the deterioration among U.S. consumer sentiment measures in recent quarters. The University of Michigan’s measure, for example, declined to the lowest level since the inception of the survey, which dates to the 1950s, reaching 50 in June.
The significant stress placed on the U.S. consumer by the highest inflation in 40 years, combined with considerable losses experienced across the major sectors of the financial markets in 2022, has placed policy makers in a seemingly precarious position. Appeasing the financial markets through less-aggressive hawkish actions and forward guidance increases the risk of unanchored inflation. Conversely, overzealous policies aimed at getting inflation under control may result in further downside volatility among risk assets, while also serving as a significant headwind to economic growth.
For the first time in at least 40 years, the specter of stagflation appears all but inevitable, at least in the near term. Inflation continues to gather steam at a time when U.S. consumer fundamentals have rolled over and aggregate business activity has seemingly stalled out. Moreover, while job gains have remained solid, the pace of labor market improvement has cooled meaningfully in recent months, with little deviation in the headline rate and subdued labor force participation versus pre-COVID levels.
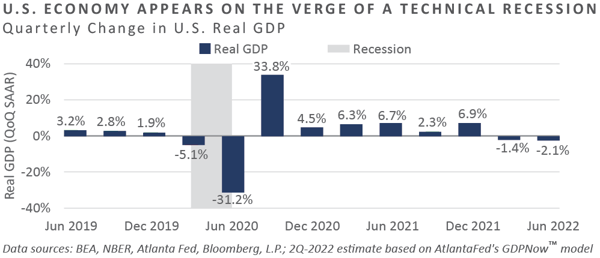
Following a modest contraction in economic growth of 1.4% on an annualized, inflation-adjusted basis in the first quarter, real-time measures of second quarter growth highlighted further degradation in the country’s growth trajectory, with the Atlanta Fed’s commonly referenced GDPNow™ model tracking a decline of more than 2.0% during the quarter. Should the actual print materialize near the -2.1% model estimate, it would mean the traditional definition of a technical recession—i.e., two consecutive quarters of negative real GDP growth—has been met, an unsettling development considering the economy was mired in a sharp, albeit brief, recession just two years prior.
Increasing Pace of Monetary and Fiscal Restraint"
Global investors have faced, and are likely to continue facing, a more restrictive path of monetary and fiscal accommodation over the near term, resulting in headwinds which might spell further downside across risky assets. In the second quarter alone, the Fed implemented two interest rate hikes, including a 50-basis-point increase in May and a 75-basis-point increase in June, placing the targeted upper bound on the policy rate at 1.75%. Additionally, shrinkage in balance sheet assets began in June, with this quantitative tightening measure anticipated to gather pace in the coming months.
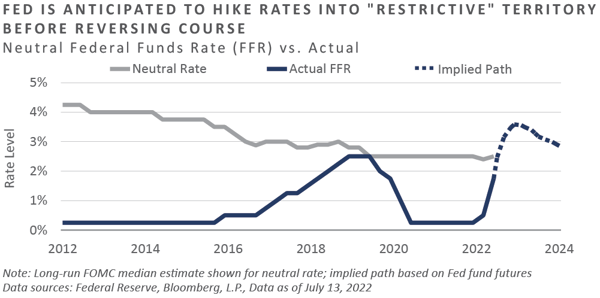
Despite the most robust inflationary backdrop in at least four decades, the Fed has deviated little from their estimate of the appropriate level of the federal funds rate over the long run. The Fed’s targeted “neutral rate,” which is an estimated policy rate level that is neither accommodative nor restrictive, has remained essentially unchanged since June 2019. Through the most recent update to the Federal Open Market Committee’s (FOMC) Summary of Economic Projections, the Fed continues to estimate the economy can withstand a long-run policy rate of 2.5%, a level 0.75% higher than today’s upper target.
Participants in the federal funds futures market have priced in the Fed to achieve this level potentially as soon as the late July meeting, with further expectations of exceeding the neutral level by the fall, in turn placing the policy rate in the “restrictive” zone.
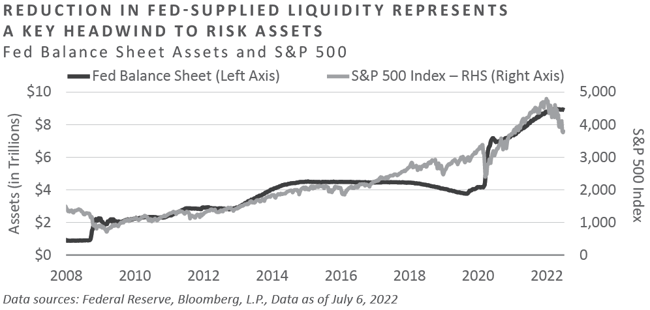
In addition to the ongoing increases to funding rates and associated forward guidance pointing to a continuation of this trend, the Fed initiated the balance sheet shrinkage process in June through allowing up to $30 billion in Treasury securities and $17.5 billion of mortgage-backed securities to roll off the Fed’s nearly $9 trillion balance sheet each month until inflation is under control. Moreover, the speed of this quantitative tightening is expected to accelerate, in turn serving as a critical factor in the reduction of liquidity from the U.S. financial system as well as a significant headwind to a potential rebound in risky asset prices in the near term.
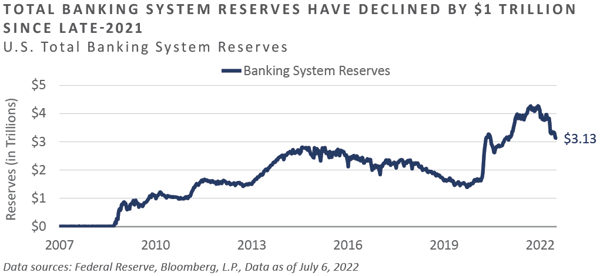
The late 2021 tapering of quantitative easing and the recent commencement of balance sheet runoff has accelerated the decline across U.S. banking system reserves, an often-cited measure of the aggregate liquidity in the U.S. financial system. The latest data published by the Fed through early July shows a meaningful $1 trillion decline in reserve balances by financial institutions with the Fed, the trend of which has loosely coincided with the price change in U.S. equities. This measure is expected to decline further in the coming months barring a pivot in the Fed’s tightening stance.
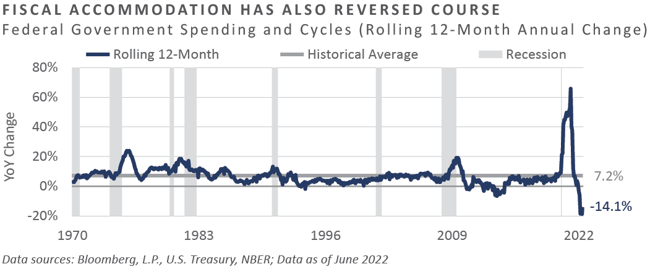
Not only have monetary conditions made a U-turn from ultra-accommodative to increasingly less so, as have fiscal conditions, due in large part to the reduction in the rate-of-change in government expenditures following multiple fiscal stimulus packages in the wake of COVID-19. Recent data shows that on a rolling annual basis, federal expenditures have declined more than 14% through June—from a peak of nearly 70% in March 2021—representing the largest net-contraction in the pace of fiscal accommodation in at least 50 years.
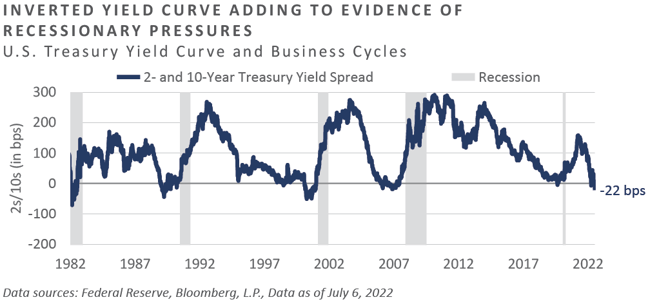
The combination of a beleaguered consumer, a growing list of unresolved geopolitical risks—e.g., Russia’s invasion of Ukraine, European energy crisis, uncertainty surrounding China’s control over Taiwan—accelerating inflation pointing to the need for further aggressive monetary tightening, a surging dollar, and a pronounced reduction in the “flow” of fiscal accommodation have served as flattening forces on the U.S. Treasury term structure, the slope of which has declined sharply in recent months and into the early days of the third quarter.
The commonly referenced spread between 2 and 10-Year Treasury yields recently declined to more than 20 bps inverted, a reading that more than exceeds the lows witnessed during the early innings of the Global Financial Crisis.
OUTLOOK AND CONCLUDING THOUGHTS
Global investors, particularly those transacting exclusively in the liquid markets, experienced pronounced downside movements across most major asset classes and categories through the first half of 2022. This negative momentum across nominal returns was exacerbated by the strongest inflationary set of conditions in 40 years, resulting in meaningfully negative inflation-adjusted performance, with interest rate sensitive sectors facing the bulk of the selling pressures.
Acknowledging the hardship placed on American households due to secularly high inflation, policymakers have taken numerous steps aimed at retracting the COVID-19-crisis-era accommodative policies that have helped fuel accelerating cost pressures. These attempts at engineering an economic “soft landing” without stoking further downside moves across the financial markets encountered meaningful resistance through the first half of the year, with overwhelming negative performance across the key areas of the investment universe and economic growth trending on a negative path.
Over the near-term horizon, recent inflation and employment data suggests policy-makers will continue on their path of setting forth initiatives aimed at tempering inflation, with some bond market gauges implying the federal funds rate will be near 3.5% by the end of the year, a doubling of the current 1.75% upper target. Moreover, the bar for meaningful increases in government expenditures in the near term appears particularly high due to societal angst stemming from the ongoing inflation issue.
In light of these anticipated headwinds, investors who have remained patient and cautiously positioned throughout this challenging time have the potential to be rewarded with abundant opportunities to add risk exposure to their portfolios once valuations ultimately decline to historically cheap levels and the fundamental and sentiment backdrop begins to decisively improve.
DISCLOSURES
Bloomberg Data Disclosure: Source- Bloomberg Index Services Limited. BLOOMBERG® is a trademark and service mark of Bloomberg Finance L.P. and its affiliates (collectively “Bloomberg”). Bloomberg or Bloomberg’s licensors own all proprietary rights in the Bloomberg Indices. Bloomberg does not approve or endorse this material or guarantee the accuracy or completeness of any information herein, nor does Bloomberg make any warranty, express or implied, as to the results to be obtained therefrom, and, to the maximum extent allowed by law, Bloomberg shall not have any liability or responsibility for injury or damages arising in connection therewith.
This report was prepared by Fund Evaluation Group, LLC (FEG), a federally registered investment adviser under the Investment Advisers Act of 1940, as amended, providing non-discretionary and discretionary investment advice to its clients on an individual basis. Registration as an investment adviser does not imply a certain level of skill or training. The oral and written communications of an adviser provide you with information about which you determine to hire or retain an adviser. Fund Evaluation Group, LLC, Form ADV Part 2A & 2B can be obtained by written request directed to: Fund Evaluation Group, LLC, 201 East Fifth Street, Suite 1600, Cincinnati, OH 45202 Attention: Compliance Department.
The information herein was obtained from various sources. FEG does not guarantee the accuracy or completeness of such information provided by third parties. The information in this report is given as of the date indicated and believed to be reliable. FEG assumes no obligation to update this information, or to advise on further developments relating to it. FEG, its affiliates, directors, officers, employees, employee benefit programs and client accounts may have a long position in any securities of issuers discussed in this report.
Diversification or Asset Allocation does not assure or guarantee better performance and cannot eliminate the risk of investment loss.
Index performance results do not represent any managed portfolio returns. An investor cannot invest directly in a presented index, as an investment vehicle replicating an index would be required. An index does not charge management fees or brokerage expenses, and no such fees or expenses were deducted from the performance shown.
Neither the information nor any opinion expressed in this report constitutes an offer, or an invitation to make an offer, to buy or sell any securities.
Any return expectations provided are not intended as, and must not be regarded as, a representation, warranty or predication that the investment will achieve any particular rate of return over any particular time period or that investors will not incur losses.
Past performance is not indicative of future results.
This report is intended for informational purposes only. It does not address specific investment objectives, or the financial situation and the particular needs of any person who may receive this report.
Published July 2022
INDICES
The Alerian MLP Index is a composite of the 50 most prominent energy Master Limited Partnerships that provides investors with an unbiased, comprehensive benchmark for this emerging asset class.
The HFRI Monthly Indices (HFRI) are equally weighted performance indexes, compiled by Hedge Fund Research Inc., and are utilized by numerous hedge fund managers as a benchmark for their own hedge funds. The HFRI are broken down into 37 different categories by strategy, including the HFRI Fund Weighted Composite, which accounts for over 2000 funds listed on the internal HFR Database. The HFRI Fund of Funds Composite Index is an equal weighted, net of fee, index composed of approximately 800 fund of funds which report to HFR. See www.hedgefundresearch.com for more information on index construction.
The MSCI ACWI (All Country World Index) Index is a free float-adjusted market capitalization weighted index that is designed to measure the equity market performance of developed and emerging markets. The MSCI ACWI consists of 46 country indexes comprising 23 developed and 24 emerging market country indexes. The developed market country indexes included are: Australia, Austria, Belgium, Canada, Denmark, Finland, France, Germany, Hong Kong, Ireland, Israel, Italy, Japan, Netherlands, New Zealand, Norway, Portugal, Singapore, Spain, Sweden, Switzerland, the United Kingdom and the United States. The emerging market country indexes included are: Brazil, Chile, China, Colombia, Czech Republic, Egypt, Greece, Hungary, India, Indonesia, Korea, Malaysia, Mexico, Peru, Philippines, Poland, Qatar, Saudi Arabia, South Africa, Taiwan, Thailand, Turkey, and United Arab Emirates.
The S&P 500 Index is a capitalization-weighted index of 500 stocks. The S&P 500 Index is designed to measure performance of the broad domestic economy through changes in the aggregate market value of 500 stocks representing all major industries.
Information on any indices mentioned can be obtained either through your advisor or by written request to information@feg.com.
Market Commentary: Second Quarter 2022
Financial markets came under considerable pressure in the second quarter as steep losses plagued the breadth of the major asset classes and categories. Risk assets—particularly growth equities—bore the brunt of the downside witnessed throughout the quarter, while traditional safe havens, such as precious metals and core bonds, failed to hedge against the downside volatility experienced across risk assets. Persistent inflationary momentum, including an upside surprise across consumer price inflation in June, continued to remain a primary concern for the Federal Reserve (Fed), Wall Street, and Main Street alike, despite aggressive actions taken by policymakers to temper the upward trajectory. Economic slowdown fears mounted throughout the quarter, with some gauges reflecting an elevated likelihood the U.S. economy may already be in recession.
Similar to the first quarter, global equities posted broad-based losses in the second quarter, with the interest rate sensitive corners of the market, such as growth stocks, suffering the steepest declines. While also negative in absolute terms, international developed and emerging market equities relatively outperformed domestic, despite a further strengthening of the U.S. dollar (USD) and slightly more stable economic fundamentals. From a capitalization standpoint, small cap stocks underperformed their large cap counterparts for the fifth consecutive quarter.
Diversified investors were unable to rely on the traditional hedging qualities of bonds during periods of equity market volatility—a theme also in place during the first three months of the year—as multi-decade high inflation, multiple Fed rate hikes, and hawkish forward guidance helped send interest rates significantly higher. In addition to negative performance among the higher quality sectors of the bond market, below-investment grade credit also posted negative performance, as risk premiums spiked amid growing prospects for a receding economy. Relatedly, the slope of the Treasury yield curve, while essentially unchanged on the quarter, has come under considerable pressure in the early trading activity of the third quarter, with many term structure spreads firmly inverted.
Bucking the trend of recent quarters, performance across real assets was overwhelmingly negative in the second quarter—with much of the downside experienced in June—as investors presumably repositioned exposures to reflect an economic slowdown bias. While performance in aggregate appeared negative, when compared to competing risk categories such as global equities, real asset returns in aggregate were relatively stronger, likely reflecting the continued positive inflationary bias.
KEY MARKET THEMES AND DEVELOPMENTS
Threat of Stagflation Comes into Focus as Inflation Accelerates Further, Economic Activity Stalls
For the decade-plus between the end of the 2007-2009 Global Financial Crisis and the COVID-19 pandemic, most major developed market policy-setting bodies struggled to implement monetary policies that supported elevated inflation. Relatively contained inflation and interest rates were a key factor underpinning the rally across risk assets during this timeframe.
Today, investors and the general populace are facing the most significant inflationary issue since the 1970s-1980s when the U.S. economy was grappling with President Nixon’s price and wage control measures, a disorderly rise in oil prices, the conclusion of the Bretton Woods monetary system, and the associated sharp depreciation of the U.S. dollar.
Despite continued policy efforts to date at tempering inflation—most notably numerous hikes to the federal funds rate, the initiation of quantitative tightening through the shrinkage of balance sheet assets, hawkish forward guidance, and a pronounced deceleration in the pace of federal expenditures—recent inflation data indicates little near-term relief. For example, through June, the Consumer Price Index (CPI) accelerated to a 9.1% annual pace, a level not witnessed since 1981 and a rate that exceeded the Bloomberg median consensus estimate, which reflected an 8.8% expectation.
The inflation experienced so far in 2022 has been particularly painful to endure versus the above-trend inflation witnessed in 2021, particularly when viewed through the inflation-adjusted performance of the financial markets. For example, the often-cited 60/40 portfolio allocation of 60% U.S. large cap stocks (S&P 500 Index) and 40% core bonds (Bloomberg U.S. Aggregate Index) produced an impressive total return of 16.6% in 2021, before accounting for inflation.
Adjusting for the 7.0% year-over-year increase in headline inflation yields a real return below 10%—still a strong calendar year inflation-adjusted return. Conversely, through the first six months of 2022 the 60/40 portfolio posted a loss of comparable magnitude to the gain experienced in 2022, with a decline of 16.1%, while inflation developed an increasing amount of momentum.
The most recent labor market and inflation data highlights the significant burden placed on U.S. workers. Through June, annual employee wage growth of hourly earners stood at a cyclically elevated pace of 5.1%, leading some pundits to believe U.S. consumer fundamentals are strong. Accounting for the effects of inflation, however, results in an inflation-adjusted rate of -3.6%, representing 15 consecutive months of negative real wage growth.
Persistent negative real wage growth has been a major factor behind the deterioration among U.S. consumer sentiment measures in recent quarters. The University of Michigan’s measure, for example, declined to the lowest level since the inception of the survey, which dates to the 1950s, reaching 50 in June.
The significant stress placed on the U.S. consumer by the highest inflation in 40 years, combined with considerable losses experienced across the major sectors of the financial markets in 2022, has placed policy makers in a seemingly precarious position. Appeasing the financial markets through less-aggressive hawkish actions and forward guidance increases the risk of unanchored inflation. Conversely, overzealous policies aimed at getting inflation under control may result in further downside volatility among risk assets, while also serving as a significant headwind to economic growth.
For the first time in at least 40 years, the specter of stagflation appears all but inevitable, at least in the near term. Inflation continues to gather steam at a time when U.S. consumer fundamentals have rolled over and aggregate business activity has seemingly stalled out. Moreover, while job gains have remained solid, the pace of labor market improvement has cooled meaningfully in recent months, with little deviation in the headline rate and subdued labor force participation versus pre-COVID levels.
Following a modest contraction in economic growth of 1.4% on an annualized, inflation-adjusted basis in the first quarter, real-time measures of second quarter growth highlighted further degradation in the country’s growth trajectory, with the Atlanta Fed’s commonly referenced GDPNow™ model tracking a decline of more than 2.0% during the quarter. Should the actual print materialize near the -2.1% model estimate, it would mean the traditional definition of a technical recession—i.e., two consecutive quarters of negative real GDP growth—has been met, an unsettling development considering the economy was mired in a sharp, albeit brief, recession just two years prior.
Increasing Pace of Monetary and Fiscal Restraint"
Global investors have faced, and are likely to continue facing, a more restrictive path of monetary and fiscal accommodation over the near term, resulting in headwinds which might spell further downside across risky assets. In the second quarter alone, the Fed implemented two interest rate hikes, including a 50-basis-point increase in May and a 75-basis-point increase in June, placing the targeted upper bound on the policy rate at 1.75%. Additionally, shrinkage in balance sheet assets began in June, with this quantitative tightening measure anticipated to gather pace in the coming months.
Despite the most robust inflationary backdrop in at least four decades, the Fed has deviated little from their estimate of the appropriate level of the federal funds rate over the long run. The Fed’s targeted “neutral rate,” which is an estimated policy rate level that is neither accommodative nor restrictive, has remained essentially unchanged since June 2019. Through the most recent update to the Federal Open Market Committee’s (FOMC) Summary of Economic Projections, the Fed continues to estimate the economy can withstand a long-run policy rate of 2.5%, a level 0.75% higher than today’s upper target.
Participants in the federal funds futures market have priced in the Fed to achieve this level potentially as soon as the late July meeting, with further expectations of exceeding the neutral level by the fall, in turn placing the policy rate in the “restrictive” zone.
In addition to the ongoing increases to funding rates and associated forward guidance pointing to a continuation of this trend, the Fed initiated the balance sheet shrinkage process in June through allowing up to $30 billion in Treasury securities and $17.5 billion of mortgage-backed securities to roll off the Fed’s nearly $9 trillion balance sheet each month until inflation is under control. Moreover, the speed of this quantitative tightening is expected to accelerate, in turn serving as a critical factor in the reduction of liquidity from the U.S. financial system as well as a significant headwind to a potential rebound in risky asset prices in the near term.
The late 2021 tapering of quantitative easing and the recent commencement of balance sheet runoff has accelerated the decline across U.S. banking system reserves, an often-cited measure of the aggregate liquidity in the U.S. financial system. The latest data published by the Fed through early July shows a meaningful $1 trillion decline in reserve balances by financial institutions with the Fed, the trend of which has loosely coincided with the price change in U.S. equities. This measure is expected to decline further in the coming months barring a pivot in the Fed’s tightening stance.
Not only have monetary conditions made a U-turn from ultra-accommodative to increasingly less so, as have fiscal conditions, due in large part to the reduction in the rate-of-change in government expenditures following multiple fiscal stimulus packages in the wake of COVID-19. Recent data shows that on a rolling annual basis, federal expenditures have declined more than 14% through June—from a peak of nearly 70% in March 2021—representing the largest net-contraction in the pace of fiscal accommodation in at least 50 years.
The combination of a beleaguered consumer, a growing list of unresolved geopolitical risks—e.g., Russia’s invasion of Ukraine, European energy crisis, uncertainty surrounding China’s control over Taiwan—accelerating inflation pointing to the need for further aggressive monetary tightening, a surging dollar, and a pronounced reduction in the “flow” of fiscal accommodation have served as flattening forces on the U.S. Treasury term structure, the slope of which has declined sharply in recent months and into the early days of the third quarter.
The commonly referenced spread between 2 and 10-Year Treasury yields recently declined to more than 20 bps inverted, a reading that more than exceeds the lows witnessed during the early innings of the Global Financial Crisis.
OUTLOOK AND CONCLUDING THOUGHTS
Global investors, particularly those transacting exclusively in the liquid markets, experienced pronounced downside movements across most major asset classes and categories through the first half of 2022. This negative momentum across nominal returns was exacerbated by the strongest inflationary set of conditions in 40 years, resulting in meaningfully negative inflation-adjusted performance, with interest rate sensitive sectors facing the bulk of the selling pressures.
Acknowledging the hardship placed on American households due to secularly high inflation, policymakers have taken numerous steps aimed at retracting the COVID-19-crisis-era accommodative policies that have helped fuel accelerating cost pressures. These attempts at engineering an economic “soft landing” without stoking further downside moves across the financial markets encountered meaningful resistance through the first half of the year, with overwhelming negative performance across the key areas of the investment universe and economic growth trending on a negative path.
Over the near-term horizon, recent inflation and employment data suggests policy-makers will continue on their path of setting forth initiatives aimed at tempering inflation, with some bond market gauges implying the federal funds rate will be near 3.5% by the end of the year, a doubling of the current 1.75% upper target. Moreover, the bar for meaningful increases in government expenditures in the near term appears particularly high due to societal angst stemming from the ongoing inflation issue.
In light of these anticipated headwinds, investors who have remained patient and cautiously positioned throughout this challenging time have the potential to be rewarded with abundant opportunities to add risk exposure to their portfolios once valuations ultimately decline to historically cheap levels and the fundamental and sentiment backdrop begins to decisively improve.
DISCLOSURES
Bloomberg Data Disclosure: Source- Bloomberg Index Services Limited. BLOOMBERG® is a trademark and service mark of Bloomberg Finance L.P. and its affiliates (collectively “Bloomberg”). Bloomberg or Bloomberg’s licensors own all proprietary rights in the Bloomberg Indices. Bloomberg does not approve or endorse this material or guarantee the accuracy or completeness of any information herein, nor does Bloomberg make any warranty, express or implied, as to the results to be obtained therefrom, and, to the maximum extent allowed by law, Bloomberg shall not have any liability or responsibility for injury or damages arising in connection therewith.
This report was prepared by Fund Evaluation Group, LLC (FEG), a federally registered investment adviser under the Investment Advisers Act of 1940, as amended, providing non-discretionary and discretionary investment advice to its clients on an individual basis. Registration as an investment adviser does not imply a certain level of skill or training. The oral and written communications of an adviser provide you with information about which you determine to hire or retain an adviser. Fund Evaluation Group, LLC, Form ADV Part 2A & 2B can be obtained by written request directed to: Fund Evaluation Group, LLC, 201 East Fifth Street, Suite 1600, Cincinnati, OH 45202 Attention: Compliance Department.
The information herein was obtained from various sources. FEG does not guarantee the accuracy or completeness of such information provided by third parties. The information in this report is given as of the date indicated and believed to be reliable. FEG assumes no obligation to update this information, or to advise on further developments relating to it. FEG, its affiliates, directors, officers, employees, employee benefit programs and client accounts may have a long position in any securities of issuers discussed in this report.
Diversification or Asset Allocation does not assure or guarantee better performance and cannot eliminate the risk of investment loss.
Index performance results do not represent any managed portfolio returns. An investor cannot invest directly in a presented index, as an investment vehicle replicating an index would be required. An index does not charge management fees or brokerage expenses, and no such fees or expenses were deducted from the performance shown.
Neither the information nor any opinion expressed in this report constitutes an offer, or an invitation to make an offer, to buy or sell any securities.
Any return expectations provided are not intended as, and must not be regarded as, a representation, warranty or predication that the investment will achieve any particular rate of return over any particular time period or that investors will not incur losses.
Past performance is not indicative of future results.
This report is intended for informational purposes only. It does not address specific investment objectives, or the financial situation and the particular needs of any person who may receive this report.
Published July 2022
INDICES
The Alerian MLP Index is a composite of the 50 most prominent energy Master Limited Partnerships that provides investors with an unbiased, comprehensive benchmark for this emerging asset class.
The HFRI Monthly Indices (HFRI) are equally weighted performance indexes, compiled by Hedge Fund Research Inc., and are utilized by numerous hedge fund managers as a benchmark for their own hedge funds. The HFRI are broken down into 37 different categories by strategy, including the HFRI Fund Weighted Composite, which accounts for over 2000 funds listed on the internal HFR Database. The HFRI Fund of Funds Composite Index is an equal weighted, net of fee, index composed of approximately 800 fund of funds which report to HFR. See www.hedgefundresearch.com for more information on index construction.
The MSCI ACWI (All Country World Index) Index is a free float-adjusted market capitalization weighted index that is designed to measure the equity market performance of developed and emerging markets. The MSCI ACWI consists of 46 country indexes comprising 23 developed and 24 emerging market country indexes. The developed market country indexes included are: Australia, Austria, Belgium, Canada, Denmark, Finland, France, Germany, Hong Kong, Ireland, Israel, Italy, Japan, Netherlands, New Zealand, Norway, Portugal, Singapore, Spain, Sweden, Switzerland, the United Kingdom and the United States. The emerging market country indexes included are: Brazil, Chile, China, Colombia, Czech Republic, Egypt, Greece, Hungary, India, Indonesia, Korea, Malaysia, Mexico, Peru, Philippines, Poland, Qatar, Saudi Arabia, South Africa, Taiwan, Thailand, Turkey, and United Arab Emirates.
The S&P 500 Index is a capitalization-weighted index of 500 stocks. The S&P 500 Index is designed to measure performance of the broad domestic economy through changes in the aggregate market value of 500 stocks representing all major industries.
Information on any indices mentioned can be obtained either through your advisor or by written request to information@feg.com.
Recent posts
Subscribe to blog