The concluding quarter of 2022—one of the most tumultuous calendar years across financial markets in recent memory—started strong for risk-seeking investors, particularly those emphasizing domestic markets. While some of this strength has since dissipated in the early trading activity of the first half of November, performance across the major asset classes and categories mostly reflected a risk-on tone in October. The Federal Reserve’s (Fed’s) 75-basis-point increase to the policy rate on November 2, as well as hawkish near-term forward guidance, affirmed the Fed’s steadfast pursuit of restoring price stability amid the most severe cost of living crisis since the early 1980s.
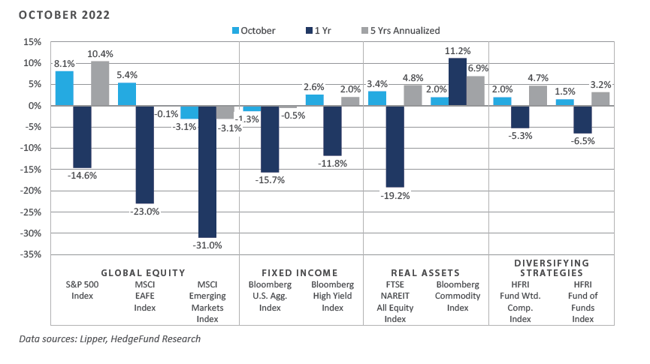
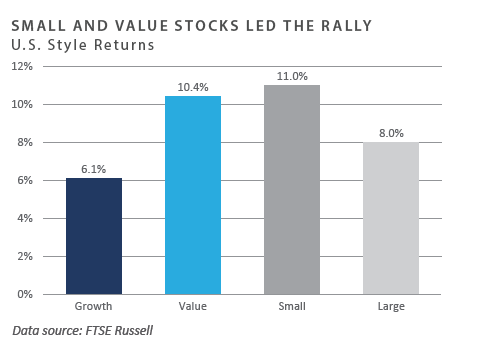
Canvassing the key corners of the global financial markets, the global equity asset class experienced strongly positive but dispersed results during the month. Domestic equities outperformed developed international equities and significantly outperformed emerging market equities on the month. The latter suffered a double-digit monthly decline from its largest geographic constituent, China. Stylistically, value meaningfully outperformed growth on the month, with elevated returns across the energy and financial GICS sectors serving as key drivers of the relative outperformance. From a capitalization standpoint, the risk-on bias during the month supported strong relative outperformance across small and microcap equities.
The rate-sensitive corners of the bond market faced further performance headwinds through a continued rise across interest rates. This theme seemed to be supported by stubbornly high inflation and ongoing Fed tightening measures. However, a monthly narrowing of credit risk premiums helped ease broader financial conditions during the month.
Similar to global equity, most major real assets categories witnessed solid positive performance in October, particularly among energy-oriented sectors, with OPEC Plus’s early October announcement of a two million barrel- per-day cut across production targets underpinning the sector’s strength.
Economic Update
Fourth Quarter Begins with Risk Assets Shrugging Off Inflationary Concerns and Fed Tightening
October delivered healthy returns across the majority of risk-oriented corners of the global financial markets, most notably in the U.S., where domestic equity returns easily bested those generated by the international developed and emerging market constituency.
While at times the rallies that occurred during the month felt sustainable, this was most likely due to the growing view that a Fed “pause” in tightening conditions was on the horizon. However, the Fed’s early November decision to increase the overnight policy rate by 75 basis points, the fourth consecutive hike, combined with hawkish near- term forward guidance by Chair Jerome Powell at the press conference on November 2 following the rate hike announcement, affirmed the Fed’s restrictive stance.
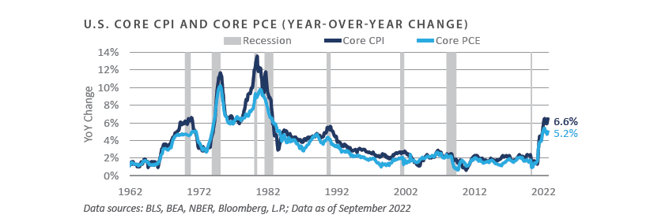
Despite the Fed embarking on one of the most aggressive tightening campaigns in the modern era, core inflation throughout 2022 has proven stickier than many market participants initially anticipated, given the narrative in late 2021 and early 2022 that multi-decade high inflation was merely a “transitory” phenomenon. Through September, core consumer price inflation stood at an annual rate of 6.6%, the most elevated rate since 1982 and more than triple the Fed’s 2% inflation target.
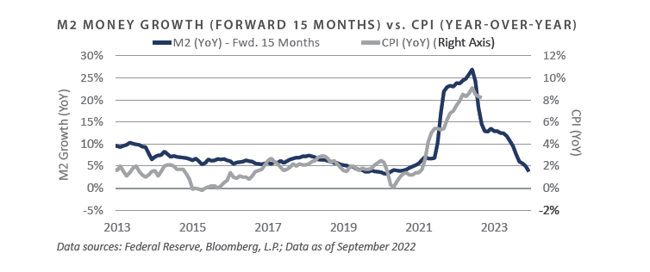
Monetary policy actions taken by the Fed, which are lagging in impact, may ultimately help restore the price stability the Fed seeks. The incredibly sharp year-to-date deceleration in money supply growth amid hikes to the policy rate and a reduction in the size of the Fed’s balance sheet, as well as the related result of declining banking system reserve liquidity, may serve as primary headwinds to further gains in inflationary momentum.
When viewed through a 15-month lead time, the marked deceleration across M2 money supply growth in 2022 is expected to represent a critical downward force on the near-term inflationary bias. Through September, year- over-year growth across the M2 money stock stood at just 2.6%, a pace 4.5 ppts below the historical average of 7.1% and the slowest growth rate since exiting the Global Financial Crisis. When viewed through this lens, we believe the significant year-to-date decline of the money supply should help restore price stability in the near term. This dynamic would be a welcomed development for the Fed but a potentially destabilizing macro force across the domestic growth engine.
Similar to the beginning of the third quarter, performance for the first month of the fourth quarter proved robust for the majority of risk-oriented sectors, notably domestic, as anticipation of a “pause” in Fed tightening grew. This positive momentum encountered resistance in early November, however, as investors digested the Fed’s latest tightening measures and the expectation for more to come on the near-to-intermediate horizon.
Market Summary
Global Equity
-
Global equity returns were positive over the month. Third quarter GDP reported in October surprised to the upside. However, consistently elevated inflation, strong labor markets, and economic growth reinforced the Fed’s hawkish stance. In early November, the October rally faded when the Fed committed to raising interest rates until inflation is under control during the press conference following the Fed’s announcement of its fourth consecutive 75bps rate hike.
-
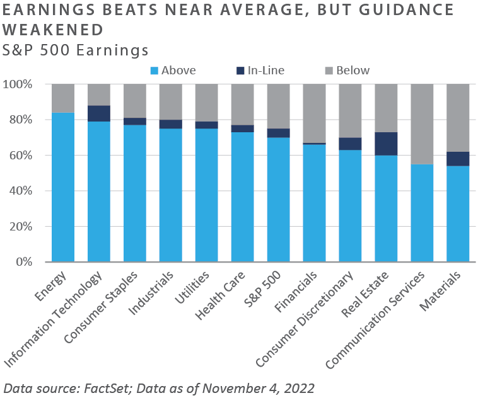
Value equities outperformed growth equities across the market cap spectrum. The energy sector was the top performer, while the communication services and consumer discretionary sectors were the primary laggards. Third-quarter earnings results primarily drove sector and stock performance. Some of the largest companies in the communication services and consumer discretionary sectors, including Google, Meta, and Amazon, posted underwhelming earnings and credited softening advertising revenue due to broad economic slowdowns.
- European equities also posted gains during October. The energy and industrial sectors saw the most robust performance on the back of rising gas and oil prices. Consequently, Europe’s record-high infla- tion of 10.7% year-over-year negatively impacted consumer confidence, hurting the consumer discretionary and staples sector performance. Although volatile, UK equity returns were also positive in October. The UK government created a plan to issue tax cuts to support growth and consumers during the energy crisis. The markets responded poorly, however, with UK equities selling off and causing the Bank of England to intervene in the bond market. Amidst all the chaos, then-Prime Minister Liz Truss resigned after just 44 days in office.
- Japanese equities finished October with positive returns. The Japanese auto industry saw increased exports during the third quarter, benefitting fundamentals. However, the yen continued its sell-off against the U.S. dollar in October, and the Bank of Japan intervened in the currency market for the first time in 27 years in an attempt to halt the yen’s decline.
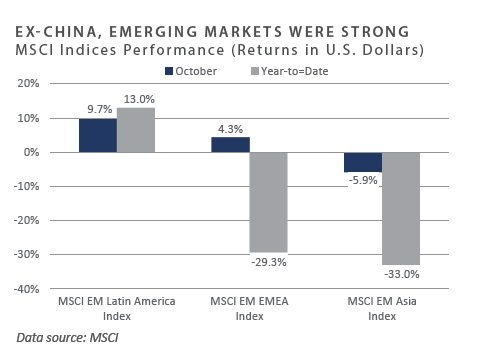
- Emerging market equities finished the month in negative territory. China and Taiwan, comprising over 35% of the MSCI Emerging Markets Index, drove poor performance, as most emerging market equity returns were The outcomes of the National Congress of the Chinese Communist Party led to a big sell-off of Chinese equities. President Xi Jinping was elected for his third term, and some party members were promoted based on loyalty to Xi. President Xi made statements supporting common prosperity, domestic production, and security, dampening foreign investor sentiment. The Chinese services sector was hit especially hard due to sporadic COVID-19 lockdowns stemming from the nation’s zero-COVID policy. Taiwan has experienced harsh effects stemming from the Western-led slowdown as global demand for semiconductors and other components has hurt economic growth. Emerging market returns have also been negatively impacted by the strength of the U.S. dollar, which is near an all-time high relative to the JP Morgan Emerging Market Currency Index.
Fixed Income
-
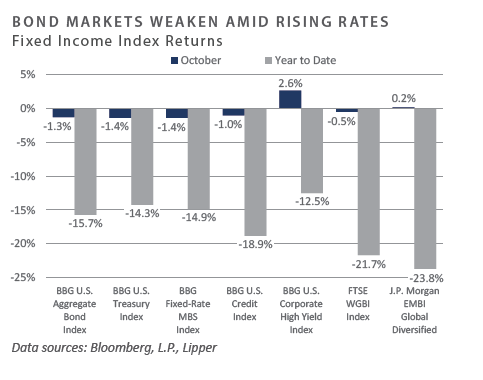
Rates continued their relentless march higher to kick off the fourth quarter. The 10-year Treasury yield rose 27 bps to 4.1% after reaching a fresh cycle high of nearly 4.3%. Rate volatility persisted as the 10- year yield traded in a 6% range during the month. The front end of the yield curve was repriced higher as the market anticipated additional rate increases. The 2-year Trea- sury yield rose 29 bps to 4.5%, slightly off the cycle high of 4.6%. The 10-year/2-year Treasury spread remained inverted for the fourth consecutive month.
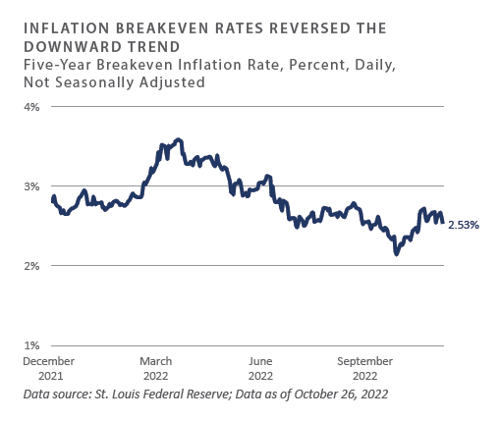
- Inflation breakevens surged in October following a strong rally during the third quarter. The CPI data released in mid- October surprised to the upside once again. Yet another hot inflation print sent the 10- and 5-year inflation breakevens higher by 37 bps and 53 bps, respectively. While goods inflation has begun to cool since the summer, services remain stubbornly sticky. Furthermore, Powell has highlighted that while long-term inflation expectations remain anchored, persistently high inflation readings can undermine forward-looking expectations, and the risk of overtightening is less than the risk of easing policy too quickly.
- High yield credit spreads tightened in sympathy with the broader risk rally during the month. Investment grade (IG) spreads were relatively flat, but high yield (HY) option-adjusted spreads (OAS) fell 80 bps. The lowest segment of the IG universe, BBB-rated bonds, ended the month with spreads near their highest levels of the year—above 2%—despite HY spreads sitting well below their 2022 wides. Policymakers tend to be sensitive to credit stress in the HY market permeating into the IG market as a barometer for broader financial stability.
- • The U.S. dollar has witnessed extraordinary strength thus far in 2022 at the expense of foreign developed and emerging market currencies. The U.S. Dollar Index (DXY) has risen over 16% on a year-to-date basis. Foreign central banks and governments have expressed concerns over the dollar’s strength; however, domestic officials show little concern. U.S. Treasury Secretary Janet Yellen said the strength of the dollar is a “logical outcome” of differing monetary policy stances globally. The U.K. government and the Bank of Japan have taken direct actions to support their currencies and to address financial stability concerns. Should the Fed remain on its course “until the job is done,” stress and volatility may persist in the currency markets.
Real Assets
REAL ESTATE
-
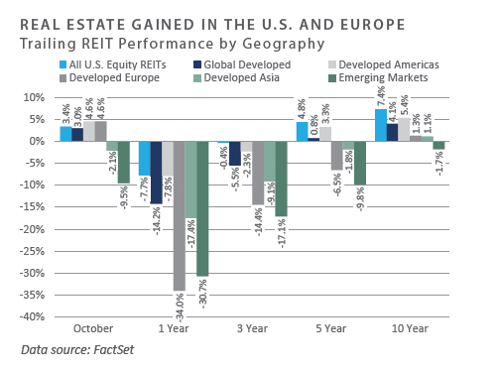
Excluding developed Asia and emerging markets, publicly traded real estate securities (REITs) provided modest returns during October. Asia and emerging markets have underperformed amid a weakening demand to target international markets but exclude exposure to China.
-
REITs have broadly been hindered by the historical surge in interest rates over the past seven months and trade at deep discounts to net asset values (NAV).
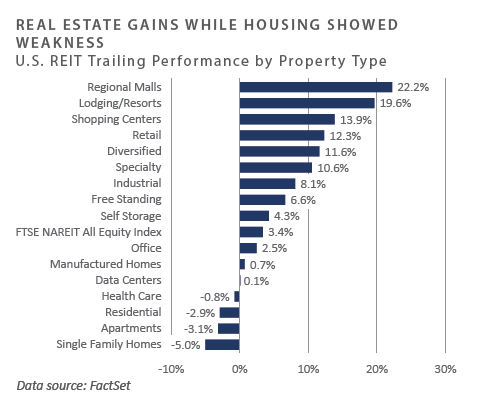
- On a month-to-date basis, most sectors rebounded sharply based on robust third- quarter earnings reports, continued dividend hikes, and several REITs raising earnings growth outlooks for the end of the year. Additionally, better-than-expected U.S. economic data potentially revived soft- landing hopes. The office sector continued to underperform as the outlook remained uncertain due to remote work trends.
NATURAL RESOURCES
-
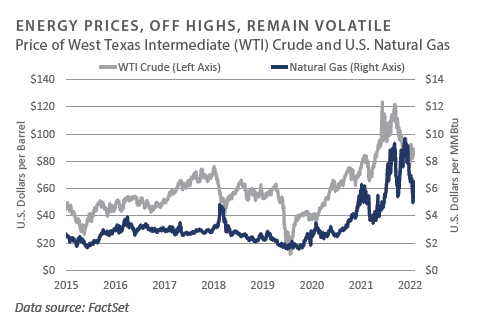
Volatility in the energy market continued through October, as weak China manufacturing data was released amid more COVID-19-related lockdowns, OPEC Plus released its World Oil Outlook, and President Biden announced plans to introduce a windfall tax on oil companies that record outsized profits without reinvesting in production. The tax is considered unlikely to pass the Senate, however. Furthermore, the U.S.-backed plan to cap prices of Russian oil faced resistance, while OPEC Plus raised global oil demand estimates despite recently announcing production cuts.
-
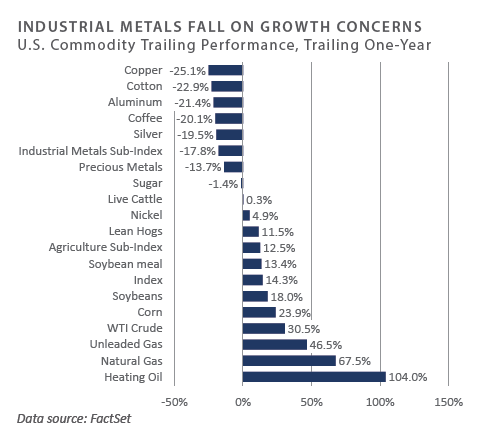
On a year-to-date basis, industrial metals continued to decline, mainly due to recession fears. This is especially true in China, a key driver of demand. The country’s zero-COVID policy has led to ongoing lockdowns throughout the year. Historically, declining trading volumes of industrial metals have been a key indicator of a weakening economic outlook.
- Natural gas prices remained elevated as the Energy Information Administration (EIA) forecasted colder weather this winter, and WTI crude ended the month higher for the first time in five months. Overall, concerns about a global economic slowdown and the December EU ban on Russian oil continue to drive price volatility in the energy market.
- Industrial metals continued to fall due to recession fears—especially in China, which has a significant share of global demand. Copper and aluminum remain sharply negative year-to-date on the same factor. Lean hogs outperformed as the USDA continued to raise pork prices. This may not continue, though, as the USDA reported supplies are up over 183% from a year earlier.
INFRASTRUCTURE
-
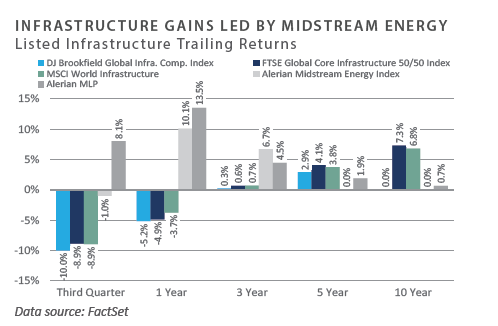
Most global listed infrastructure sector returns were modestly positive for October, excluding telecom and marine ports. Marine ports declined sharply due to lower shipping volumes, as many shippers already have high inventories and are anticipating lower seasonal demand due to the challenging macroeconomic environment. In addition to weaker consumer confidence, easing port congestion has freed up capacity, leading to softening fundamentals. Furthermore, rising interest rates will continue to impact long- duration cash flows, notably in telecom and water utilities.
-
Midstream energy continued to outperform. Earlier in October, U.S. midstream companies saw an uptick in performance following the announcement of OPEC Plus production cuts. MLPs have significantly outperformed midstream C-Corps as fundamentals and dividend yields remain strong within midstream.
Diversifying Strategies
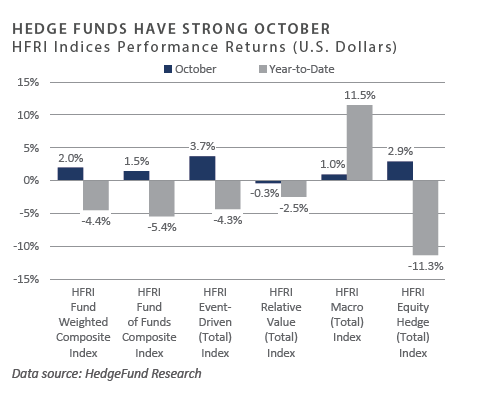
- Although hedge funds declined broadly during the quarter, performance compared well to traditional equity and fixed-income markets. Relative value and macro strategies produced positive returns over the quarter, while equity hedge and event-driven both had negative results.
- Systematic trend following strategies generated strong performance due in part to a surging U.S. dollar against a plunging British pound. Short equity positions benefited from steep equity market declines. Equity hedge manager’s continued weakness in technology and healthcare-focused strategies led to poor returns. The only bright spots within long/short equity were energy-oriented managers who benefited from persistent supply shortages. Additionally, equity market- neutral strategies, which attempt to remove general market risk, performed well.
- Event-driven manager returns were negative across the board except for merger arbitrage strategies. Activist managers, who tend to carry higher equity beta, struggled toward the end of the quarter, wiping out early gains.
INDICES
The Alerian MLP Index is a composite of the 50 most prominent energy Master Limited Partnerships that provides investors with an unbiased, comprehensive benchmark for this emerging asset class.
Bloomberg Fixed Income Indices is an index family comprised of the Bloomberg US Aggregate Index, Government/Corporate Bond Index, Mortgage-Backed Securities Index, and Asset-Backed Securities Index, Municipal Index, High-Yield Index, Commodity Index and others designed to represent the broad fixed income markets and sectors. On August 24, 2016, Bloomberg acquired these long-standing assets from Barclays Bank PLC. and on August 24, 2021, they were rebranded as the Bloomberg Fixed Income Indices. See https://www.bloomberg.com/markets/rates-bonds/bloomberg-fixed-income-indices for more information..
The CBOE Volatility Index (VIX) is an up-to-the-minute market estimate of expected volatility that is calculated by using real-time S&P 500 Index option bid/ask quotes. The Index uses nearby and second nearby options with at least eight days left to expiration and then weights them to yield a constant, 30-day measure of the expected volatility of the S&P 500 Index.
FTSE Real Estate Indices (NAREIT Index and EPRA/NAREIT Index) includes only those companies that meet minimum size, liquidity and free float criteria as set forth by FTSE and is meant as a broad representation of publicly traded real estate securities. Relevant real estate activities are defined as the ownership, disposure, and development of income-producing real estate. See https://www.ftserussell.com/index/category/real-estate for more information.
HFRI Monthly Indices (HFRI) are equally weighted performance indexes, compiled by Hedge Fund Research Inc. (HFX), and are used by numerous hedge fund managers as a benchmark for their own hedge funds. The HFRI are broken down into 37 different categories by strategy, including the HFRI Fund Weighted Composite, which accounts for over 2,000 funds listed on the internal HFR Database. The HFRI Fund of Funds Composite Index is an equal weighted, net of fee, index composed of approximately 800 fund- of- funds which report to HFR. See www.hedgefundresearch.com for more information on index construction.
J.P. Morgan’s Global Index Research group produces proprietary index products that track emerging markets, government debt, and corporate debt asset classes. Some of these indices include the JPMorgan Emerging Market Bond Plus Index, JPMorgan Emerging Market Local Plus Index, JPMorgan Global Bond Non-U.S. Index and JPMorgan Global Bond Non-U.S. Index. See www.jpmorgan.com for more information.
Merrill Lynch high yield indices measure the performance of securities that pay interest in cash and have a credit rating of below investment grade. Merrill Lynch uses a composite of Fitch Ratings, Moody’s and Standard and Poor’s credit ratings in selecting bonds for these indices. These ratings measure the risk that the bond issuer will fail to pay interest or to repay principal in full. See www.ml.com for more information.
Morgan Stanley Capital International – MSCI is a series of indices constructed by Morgan Stanley to help institutional investors benchmark their returns. There are a wide range of indices created by Morgan Stanley covering a multitude of developed and emerging economies and economic sectors. See www.morganstanley.com for more information.
The FTSE Nareit All Equity REITs Index is a free-float adjusted, market capitalization-weighted index of U.S. equity REITs.
Russell Investments rank U.S. common stocks from largest to smallest market capitalization at each annual reconstitution period (May 31). The primary Russell Indices are defined as follows: 1) the top 3,000 stocks become the Russell 3000 Index, 2) the largest 1,000 stocks become the Russell 1000 Index, 3) the smallest 800 stocks in the Russell 1000 Index become the Russell Midcap index, 4) the next 2,000 stocks become the Russell 2000 Index, 5) the smallest 1,000 in the Russell 2000 Index plus the next smallest 1,000 comprise the Russell Microcap Index, and 6) U.S. Equity REITs comprise the FTSE Nareit All Equity REIT Index. See www.russell.com for more information.
S&P 500 Index consists of 500 stocks chosen for market size, liquidity and industry group representation, among other factors by the S&P Index Committee, which is a team of analysts and economists at Standard and Poor’s. The S&P 500 is a market-value weighted index, which means each stock’s weight in the index is proportionate to its market value and is designed to be a leading indicator of U.S. equities, and meant to reflect the risk/return characteristics of the large cap universe. See www.standardandpoors.com for more information.
Information on any indices mentioned can be obtained either through your advisor or by written request to information@feg.com.
DISCLOSURES
This report was prepared by FEG (also known as Fund Evaluation Group, LLC), a federally registered investment adviser under the Investment Advisers Act of 1940, as amended, providing non-discretionary and discretionary investment advice to its clients on an individual basis. Registration as an investment adviser does not imply a certain level of skill or training. The oral and written communications of an adviser provide you with information about which you determine to hire or retain an adviser. Fund Evaluation Group, LLC, Form ADV Part 2A & 2B can be obtained by written request directly to: Fund Evaluation Group, LLC, 201 East Fifth Street, Suite 1600, Cincinnati, OH 45202, Attention: Compliance Department.
The information herein was obtained from various sources. FEG does not guarantee the accuracy or completeness of such information provided by third parties. The information in this report is given as of the date indicated and believed to be reliable. FEG assumes no obligation to update this information, or to advise on further developments relating to it. FEG, its affiliates, directors, officers, employees, employee benefit programs and client accounts may have a long position in any securities of issuers discussed in this report.
Index performance results do not represent any managed portfolio returns. An investor cannot invest directly in a presented index, as an investment vehicle replicating an index would be required. An index does not charge management fees or brokerage expenses, and no such fees or expenses were deducted from the performance shown.
Bloomberg Index Services Limited. BLOOMBERG® is a trademark and service mark of Bloomberg Finance L.P. and its affiliates (collectively “Bloomberg”). Bloomberg or Bloomberg’s licensors own all proprietary rights in the Bloomberg Indices. Bloomberg does not approve or endorse this material or guarantee the accuracy or completeness of any information herein, nor does Bloomberg make any warranty, express or implied, as to the results to be obtained therefrom, and, to the maximum extent allowed by law, Bloomberg shall not have any liability or responsibility for injury or damages arising in connection therewith.
Neither the information nor any opinion expressed in this report constitutes an offer, or an invitation to make an offer, to buy or sell any securities.
Any return expectations provided are not intended as, and must not be regarded as, a representation, warranty or predication that the investment will achieve any particular rate of return over any particular time period or that investors will not incur losses.
Past performance is not indicative of future results.
Investments in private funds are speculative, involve a high degree of risk, and are designed for sophisticated investors.
All data is as of Octoberr 31, 2022 unless otherwise noted.