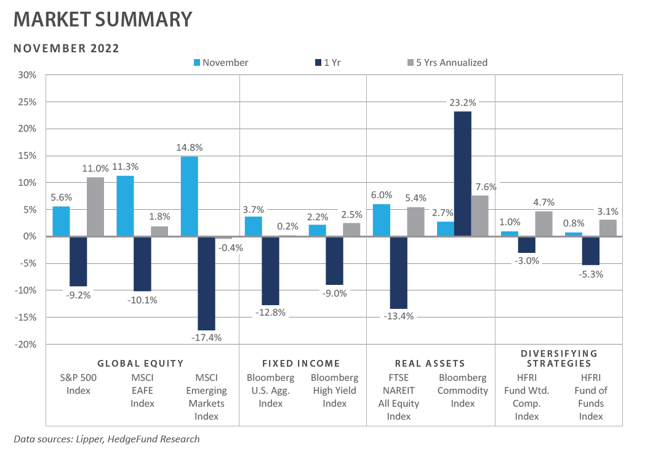
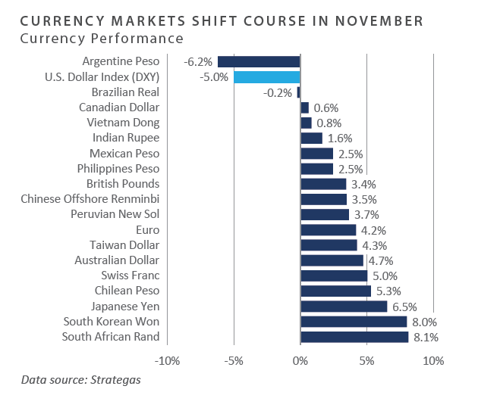
Following October’s robust start to the fourth quarter, performance across the financial markets in November appeared notably strong, underpinned by the growing narrative of a Federal Reserve (Fed) “pause” in tightening over the near-term horizon amid evidence of cooling inflation. The anticipation of a less steep implied Fed policy path helped send the U.S. dollar (USD) significantly lower on the month, and the ICE U.S. Dollar Index (DXY) suffered its worst monthly performance decline since July 2010 with a drop of 5%. Asset classes and categories that tend to perform best during weakening dollar regimes—notably, international equities and precious metals and mining companies—witnessed significantly positive returns on the month. Within global equity, emerging markets were the leaders of the pack, with tailwinds including a weaker dollar and elevated performance across Chinese equities amid indications of a relaxation of China’s zero-covid policy. Bond returns were also broadly positive in November— particularly among rate-sensitive sectors, as interest rates declined on the month in line with the “peak inflation” tone. Most major real assets sectors also enjoyed positive returns for the month, with many corners of the real assets complex generating double-digit gains.
Economic Update
Financial Markets Perform Strongly in November, but Dark Clouds Continue to Form
After enduring one of the worst three-quarter stretches of market performance in recent memory, global investors breathed a sigh of relief in October and November, as mounting evidence of peaking inflation and related sentiment for an incrementally less restrictive implied Fed policy path paved the way for a robust rally across both risk-oriented and high-quality assets.
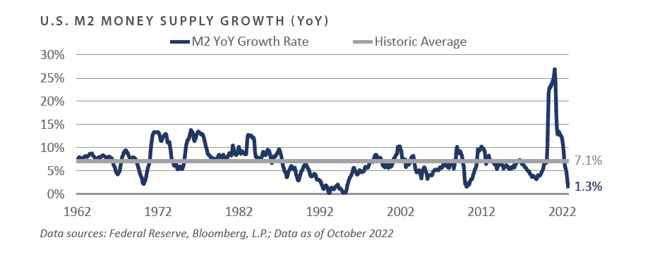
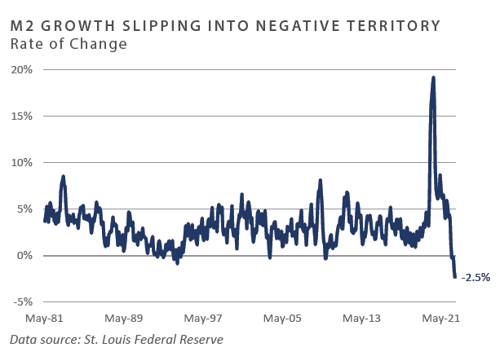
In reviewing the year-over-year (YoY) changes in the Fed’s preferred gauge of inflation—the personal consumption expenditure (PCE) core series—a peak appears to have occurred in February, which saw a 5.4% YoY pace versus the 5.0% YoY rate-of-change through October. Supporting the case for gradual declines across inflationary pressures over the near term includes the sharp year-to-date reduction in money supply growth following one of the most dramatic back-to-back calendar year increases in the supply of money—in 2020 and 2021—in at least half a century.
Through the most recently published data in October, the M2 money stock grew at an annual pace of just 1.3%, the slowest rate of change since 1995 and a pace that appears on the verge of witnessing the first contraction on record, should the Fed follow through with its balance sheet winddown process in the coming months.
Prospects for a soft landing for the U.S. economy have percolated in the fourth quarter, mainly driven by a combination of cooling inflation, moderating interest rates, and a declining U.S. dollar. These forces were offset by a resilient labor market that minted 263,000 new jobs through November, besting the Bloomberg median sell- side estimate of 200,000. Additionally, employee wage pressures appeared elevated on the month, at least in nominal terms, with average hourly earnings increasing 5.1% over the trailing months, a potential indication that the current inflationary regime may be at risk of becoming entrenched.
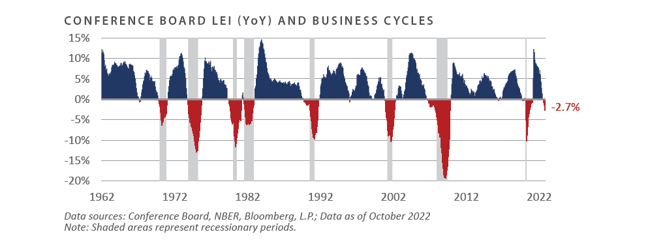
While performance across the financial markets has largely surprised to the upside thus far in the fourth quarter, the U.S. economy may not be out of the woods quite yet. Coincident indicators of the business cycle continued to advance through October, while forward, or “leading” measures of the fundamental backdrop continued to grind lower. The Conference Board’s Leading Economic Index (LEI) slumped 2.7% on a YoY basis through October, a pace that has historically coincided with recessionary conditions and one that may lead to further declines across risk assets in the near term, should the Fed overtighten monetary conditions to the point of a broad-based downturn in economic activity.
To conclude, performance across the financial markets in October and November has surprised to the upside, with supporting factors such as a potential peak in inflation and Fed tightening sentiment helping to send both interest rates and the dollar meaningfully lower. While prospects for an economic soft landing have increased, forward measures of economic activity have meaningfully lowered since October, with some gauges reflecting heightened recessionary risks as investors enter the new year.
Market Summary
Global Equity
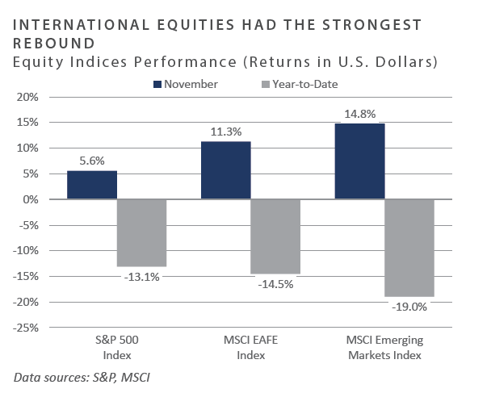
Global equity returns were positive in November. Emerging market equities outperformed their developed market counterparts as Chinese equities rallied in response to expectations of the government easing parts of the zero-covid policy over the coming months. Equities began the month mixed as central banks continued to tighten monetary policy; the Federal Reserve and the Bank of England both raised rates 75 bps at the beginning of the month. However, equity and international currency markets began to rally as inflation data across the globe–which is reported later in the month—came in below expectations.
European equities returns made gains for the month. Returns benefitted from potentially slowing inflation. The energy crisis in Europe has not been as bad as expected due to warmer weather to date aiding overall inflation numbers; however, energy is still the most significant factor in rising inflation. Cyclical sectors such as consumer discretionary rallied in Europe. The luxury goods industry was one of the best-performing industries during the month due to potentially improved demand out of China. The UK economy has struggled in 2022 because of the instability in government, but new Prime Minister Rishi Sunak has been viewed favorably by market participants, helping boost UK equity markets in November. The euro and the pound rebounded relative to the U.S. dollar in November.
Japanese stocks rose in both local and USD terms. The slowing of inflation data and a change in expectations for the U.S. interest rate hiking schedule caused the Japanese yen to appreciate sharply relative to the U.S. dollar. Third-quarter corporate earnings came in above expectations across the capitalization spectrum, with large multinational and domestic small companies exhibiting solid earnings.
Emerging market equities returns saw strong rally, led by China, Hong Kong, and Taiwan. Reversing October’s disappointing performance, the MSCI China Index posted an approximate 30% return for the month amid expectations for a relaxed Covid-19 policy. Foreign investors responded positively to President Biden and President Xi’s seeming commitment to competition over conflict as the two met before the G20 summit. Eastern European equity markets like Poland and Hungry underperformed the broader index as the Russia-Ukraine war continued in that region.
Fixed Income
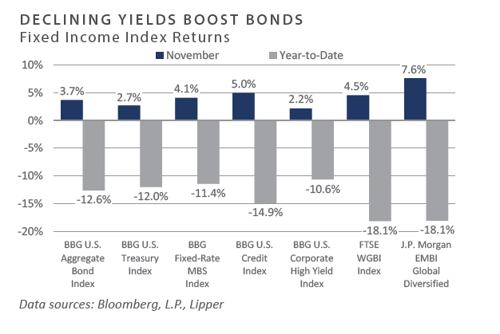
Interest rates rallied across the curve as market participants priced in less hawkish monetary policy expectations. The 2-year
Treasury yield fell 13 bps to 4.4%, while the 10-year Treasury yield fell 42 bps to 3.7% in a volatile trading month. November’s bull flattener movement sent the 10-year/2- year Treasury spread to -0.7% and marked the fifth consecutive month of inversion. Pundits may debate whether the curve’s inversion points to the final innings of the Fed’s tightening cycle or a premonition of a looming economic slowdown.
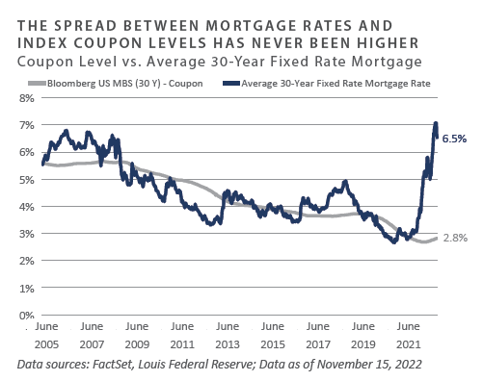
While the full impact of monetary policy tightening is yet to be fully reflected in the broader economy, rising rates have most acutely impacted the housing sector. Mortgage rates have skyrocketed since the beginning of the year, depressing housing starts, sales, and general housing activity. Home price appreciation (HPA), measured by the S&P/Case-Shiller 20-City Composite, registered a month-over-month decline of 1.2%, pushing the YoY metric to 10.4%. Despite several consecutive months of decline, the S&P/Case-Shiller U.S. National Home Price Index is still up nearly 40% since the beginning of 2020, providing massive equity cushions for millions of
Credit spreads continued to rally with the broader risk rally during the month. Investment grade (IG) and high yield (HY) option-adjusted spreads (OAS) fell 24 bps and eight bps, respectively. Corporate credit appears to be shrugging off concerns of an economic slowdown as borrowers have fortified balance sheets and extended maturities since the pandemic’s beginning. Fund flows turned positive in November, and IG and HY credit benefited from favorable technical as new issue supply remains limited, aiding spread compression.
Real Assets
REAL ESTATE
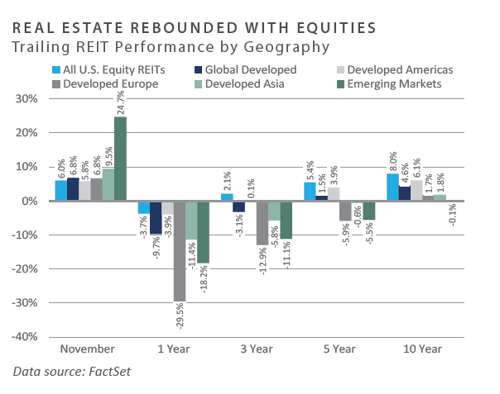
U.S. and global real estate investment trusts (REITs) had a strong partial recovery in November but underperformed the broad equity market year-to-date, particularly in developed Europe. Emerging markets outperformed during the month, driven by hopes of a reopening of China. Outperformance for the month can also be attributed to investors’ renewed hopes for a “soft landing” and less aggressive tightening of interest rates by the Fed, as well as strong third-quarter earnings results.
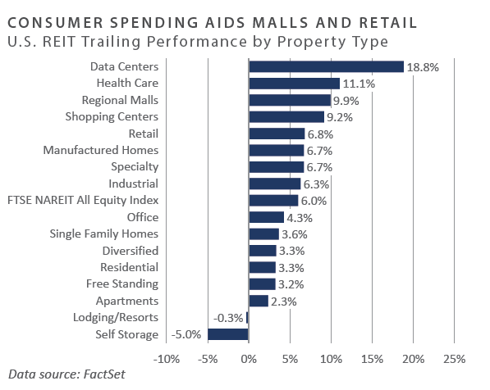
Regional malls, shopping centers, and retail were among the top-performing property sectors during the month, boosted by resilient consumer spending. Consumer spending, which accounts for more than two-thirds of U.S. economic activity, jumped 0.8% in October after an unrevised 0.6% increase the previous month, according to the U.S. Department of Commerce.
Data centers led performance during the month, mitigating some of the poor performance seen year-to-date. Outperformance for the sector was driven in part by news that inflation had not risen as much as expected, leading investors to anticipate a slower pace of interest rate increases by the Fed.
NATURAL RESOURCES
-
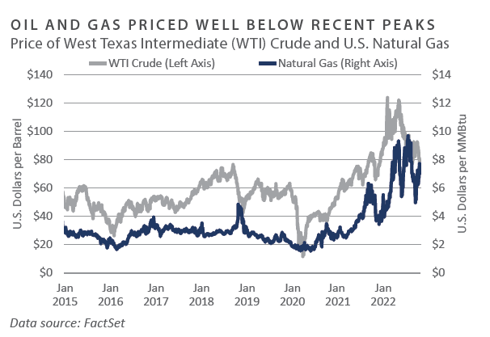
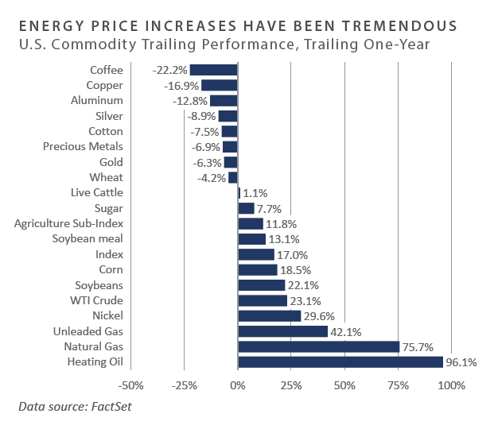
WTI and Brent January oil futures contracts declined through November, erasing much of the gains from earlier in the year.
-
Ongoing concern about slower economic growth weighed on oil prices through most of the month. Inventories showed a continued tightening of supplies, with the Department of Energy announcing a crude draw of 12.58 million barrels, the most significant commercial draw since June 2019. Offsetting this news was the Energy Information Administration’s (EIA) November report showing U.S. crude oil production up 2.4% month-over-month in September to 12.27 million barrels per day (bpd), the highest level since pre-COVID. Furthermore, U.S. rig count rose to 784 during the month, a fresh post-pandemic high but still remarkably low historically.
- Surveys show OPEC+ oil output fell by 0.7 million bpd month-over-month in November, down to 29 million bpd. The decline follows announced OPEC+ cuts last month, and actual production was short 0.8 million bpd of the group’s target, highlighting OPEC+’s continued challenges in meeting its production targets.
- Industrial and precious metals made a notable rebound during the month following a steady decline due to fears of a recession in China, which controls a significant portion of demand. These fears subsided during November, with investors hoping for a “soft landing” from the Fed following a lower- than-expected inflation print.
INFRASTRUCTURE
- Most global listed infrastructure sectors were modestly positive for November, with marine ports making a substantial rebound after underperforming in Declines in container volumes have caused freight rates to drop drastically during the year, which has positively affected the schedule reliability of major carriers. The result has been a decline in the backlog of vessels at major container ports, with zero ships waiting off the Southern California coast for the first time since 2020.
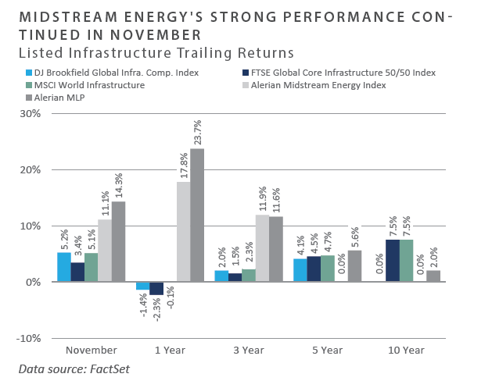
- Midstream energy continued outperforming the broader infrastructure market in November as crude oil prices declined. The sector has benefited from stable cash flows amid volatile energy prices, benefitting from less direct commodity price Dividend and share buyback trends remain positive for midstream, with positive momentum for energy infrastructure driven by macro and micro tailwinds that may be expected to continue into 2023.
Diversifying Strategies
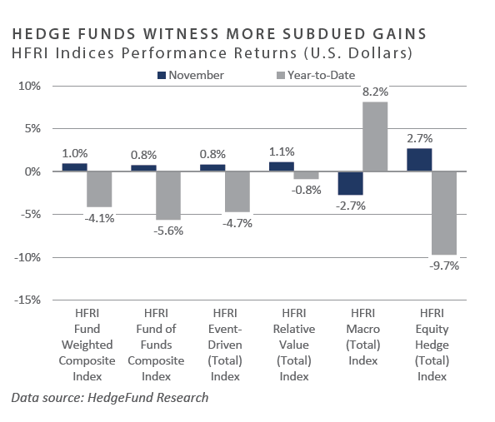
- Hedge funds slightly underperformed compared to traditional equity and fixed income markets. The HFRI Fund Weighted Index climbed 1%.
- The several-month streak of positive performance in macro strategies ended in November, as macro declined -2.7%. All other strategy returns were positive, with equity hedge and relative value leading the HFRI strategies.
- Long-term trend following was the most notable underperformer in all trading styles. The primary drivers of overall hedge fund performance were losses in several sectors, most notably in currencies, metals, and energy. The root cause of losses in metals was short exposures to gold and copper in the first half of the month, both of which experienced strong rallies.
- Equity hedge managers saw positive performance in nearly all sectors. Energy/ basic materials was the only equity strategy with negative results in Quantitative directional, fundamental value, and healthcare led equity hedge strategies for the month.
INDICES
The Alerian MLP Index is a composite of the 50 most prominent energy Master Limited Partnerships that provides investors with an unbiased, comprehensive benchmark for this emerging asset class.
Bloomberg Fixed Income Indices is an index family comprised of the Bloomberg US Aggregate Index, Government/Corporate Bond Index, Mortgage-Backed Securities Index, and Asset-Backed Securities Index, Municipal Index, High-Yield Index, Commodity Index and others designed to represent the broad fixed income markets and sectors. On August 24, 2016, Bloomberg acquired these long-standing assets from Barclays Bank PLC. and on August 24, 2021, they were rebranded as the Bloomberg Fixed Income Indices. See https://www.bloomberg.com/markets/rates-bonds/bloomberg-fixed-income-indices for more information..
The CBOE Volatility Index (VIX) is an up-to-the-minute market estimate of expected volatility that is calculated by using real-time S&P 500 Index option bid/ask quotes. The Index uses nearby and second nearby options with at least eight days left to expiration and then weights them to yield a constant, 30-day measure of the expected volatility of the S&P 500 Index.
FTSE Real Estate Indices (NAREIT Index and EPRA/NAREIT Index) includes only those companies that meet minimum size, liquidity and free float criteria as set forth by FTSE and is meant as a broad representation of publicly traded real estate securities. Relevant real estate activities are defined as the ownership, disposure, and development of income-producing real estate. See https://www.ftserussell.com/index/category/real-estate for more information.
HFRI Monthly Indices (HFRI) are equally weighted performance indexes, compiled by Hedge Fund Research Inc. (HFX), and are used by numerous hedge fund managers as a benchmark for their own hedge funds. The HFRI are broken down into 37 different categories by strategy, including the HFRI Fund Weighted Composite, which accounts for over 2,000 funds listed on the internal HFR Database. The HFRI Fund of Funds Composite Index is an equal weighted, net of fee, index composed of approximately 800 fund- of- funds which report to HFR. See www.hedgefundresearch.com for more information on index construction.
J.P. Morgan’s Global Index Research group produces proprietary index products that track emerging markets, government debt, and corporate debt asset classes. Some of these indices include the JPMorgan Emerging Market Bond Plus Index, JPMorgan Emerging Market Local Plus Index, JPMorgan Global Bond Non-U.S. Index and JPMorgan Global Bond Non-U.S. Index. See www.jpmorgan.com for more information.
Merrill Lynch high yield indices measure the performance of securities that pay interest in cash and have a credit rating of below investment grade. Merrill Lynch uses a composite of Fitch Ratings, Moody’s and Standard and Poor’s credit ratings in selecting bonds for these indices. These ratings measure the risk that the bond issuer will fail to pay interest or to repay principal in full. See www.ml.com for more information.
Morgan Stanley Capital International – MSCI is a series of indices constructed by Morgan Stanley to help institutional investors benchmark their returns. There are a wide range of indices created by Morgan Stanley covering a multitude of developed and emerging economies and economic sectors. See www.morganstanley.com for more information.
The FTSE Nareit All Equity REITs Index is a free-float adjusted, market capitalization-weighted index of U.S. equity REITs.
Russell Investments rank U.S. common stocks from largest to smallest market capitalization at each annual reconstitution period (May 31). The primary Russell Indices are defined as follows: 1) the top 3,000 stocks become the Russell 3000 Index, 2) the largest 1,000 stocks become the Russell 1000 Index, 3) the smallest 800 stocks in the Russell 1000 Index become the Russell Midcap index, 4) the next 2,000 stocks become the Russell 2000 Index, 5) the smallest 1,000 in the Russell 2000 Index plus the next smallest 1,000 comprise the Russell Microcap Index, and 6) U.S. Equity REITs comprise the FTSE Nareit All Equity REIT Index. See www.russell.com for more information.
S&P 500 Index consists of 500 stocks chosen for market size, liquidity and industry group representation, among other factors by the S&P Index Committee, which is a team of analysts and economists at Standard and Poor’s. The S&P 500 is a market-value weighted index, which means each stock’s weight in the index is proportionate to its market value and is designed to be a leading indicator of U.S. equities, and meant to reflect the risk/return characteristics of the large cap universe. See www.standardandpoors.com for more information.
Information on any indices mentioned can be obtained either through your advisor or by written request to information@feg.com.
DISCLOSURES
This report was prepared by FEG (also known as Fund Evaluation Group, LLC), a federally registered investment adviser under the Investment Advisers Act of 1940, as amended, providing non-discretionary and discretionary investment advice to its clients on an individual basis. Registration as an investment adviser does not imply a certain level of skill or training. The oral and written communications of an adviser provide you with information about which you determine to hire or retain an adviser. Fund Evaluation Group, LLC, Form ADV Part 2A & 2B can be obtained by written request directly to: Fund Evaluation Group, LLC, 201 East Fifth Street, Suite 1600, Cincinnati, OH 45202, Attention: Compliance Department.
The information herein was obtained from various sources. FEG does not guarantee the accuracy or completeness of such information provided by third parties. The information in this report is given as of the date indicated and believed to be reliable. FEG assumes no obligation to update this information, or to advise on further developments relating to it. FEG, its affiliates, directors, officers, employees, employee benefit programs and client accounts may have a long position in any securities of issuers discussed in this report.
Index performance results do not represent any managed portfolio returns. An investor cannot invest directly in a presented index, as an investment vehicle replicating an index would be required. An index does not charge management fees or brokerage expenses, and no such fees or expenses were deducted from the performance shown.
Bloomberg Index Services Limited. BLOOMBERG® is a trademark and service mark of Bloomberg Finance L.P. and its affiliates (collectively “Bloomberg”). Bloomberg or Bloomberg’s licensors own all proprietary rights in the Bloomberg Indices. Bloomberg does not approve or endorse this material or guarantee the accuracy or completeness of any information herein, nor does Bloomberg make any warranty, express or implied, as to the results to be obtained therefrom, and, to the maximum extent allowed by law, Bloomberg shall not have any liability or responsibility for injury or damages arising in connection therewith.
Neither the information nor any opinion expressed in this report constitutes an offer, or an invitation to make an offer, to buy or sell any securities.
Any return expectations provided are not intended as, and must not be regarded as, a representation, warranty or predication that the investment will achieve any particular rate of return over any particular time period or that investors will not incur losses.
Past performance is not indicative of future results.
Investments in private funds are speculative, involve a high degree of risk, and are designed for sophisticated investors.
All data is as of November 30, 2022 unless otherwise noted.