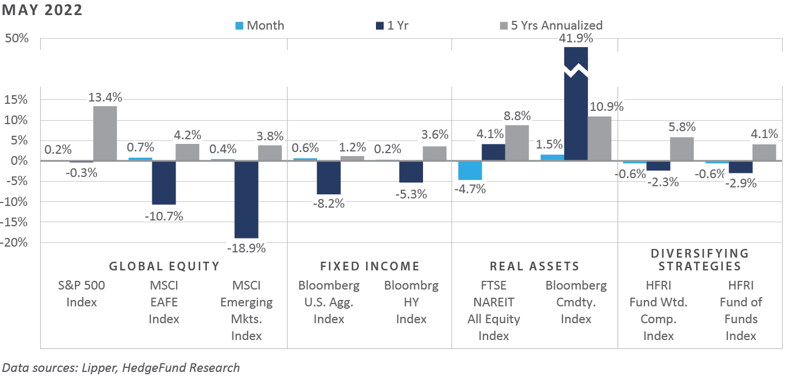
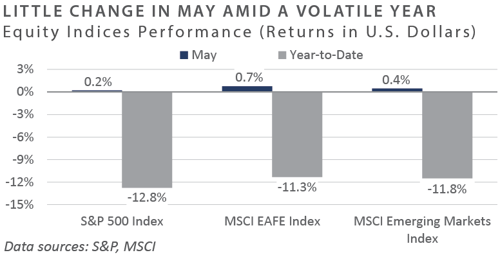
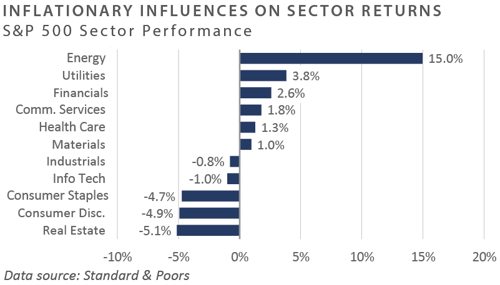
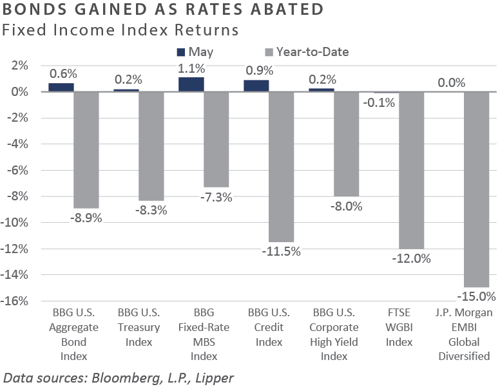
Following a notable increase in volatility in April during which most major asset classes and categories experienced significant downside pressure, market performance in May appeared more ordinary, with the ongoing theme of strong commodity-related sector performance firmly in place. Global equity returns were modest during the month, as domestic large cap posted a near-flat return and both international developed and emerging market equities eked out slightly positive total returns. Stylistically, growth stocks continued to suffer relative underperformance versus their value counterparts, with the latter continuing to benefit from outsized performance generated by the energy constituency. Bonds posted mostly positive returns in May as the ongoing ascent across interest rates reversed slightly. Core bonds, for example—as proxied by the Bloomberg U.S. Aggregate Bond Index—witnessed a 0.6% total return in May, representing the first positive monthly print since November 2021. Performance themes across real assets stayed consistent with the broader bias that has been in place for the trailing year: historically elevated performance emanating out of the commodities complex and a continued downward trajectory across the rate-sensitive real estate investment trust (REIT) market.
Economic Update
A general sense of unease continued to weigh on U.S. consumers in May, despite a settling in financial market volatility. The continued sharp increase across energy prices helped drive gasoline prices to the highest level in at least two decades, with the national average for a gallon of regular unleaded nearing $5.00. More generally, inflation rates across both headline and core—i.e., excluding food and energy—gauges remained near 40-year highs, although headline consumer price inflation experienced a slight moderation through April before increasing again in May.
Related to the stubbornly elevated inflation backdrop is an additional headwind facing U.S. consumers in the way of sharply rising mortgage rates. According to bankrate.com, the national average for a 30-year fixed-rate mortgage surpassed 5.0%, the highest reading since 2009. In addition to surging home prices, this metric has been a key driver behind the collapse in mortgage application volume, which slumped to the lowest level since late 2018 in May, according to the Mortgage Bankers Association.
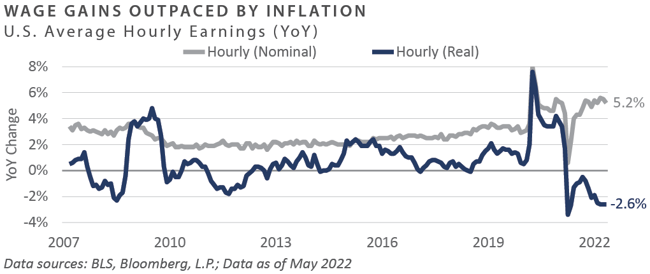
One factor which has helped partially counterbalance persistent inflationary forces and higher interest rates is an increase in nominal employee wage growth, which stood at more than 5% on an annual basis through May. However, these gains have been more than overwhelmed by the multi-decade high rate of inflation, resulting in 14 consecutive months of negative inflation-adjusted (real) wage growth through May.
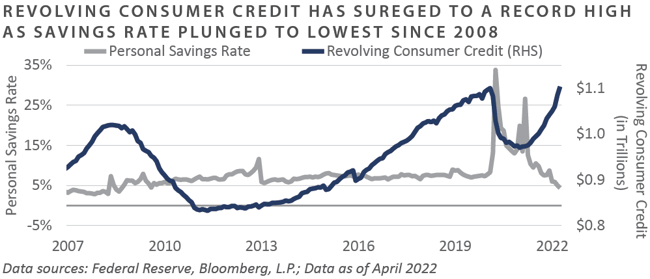
Recent Federal Reserve (Fed) data highlights a growing and unsettling trend. As consumers attempt to resume a more normal way of life in the midst of multi-decade high inflation and negative real wage growth, personal savings continue to be depleted and revolving credit lines increasingly tapped.
Through April, the Fed reported the lowest personal savings rate—which represents the ratio of personal savings to disposable personal income—since September 2008, at just 4.4%. This is in contrast to the COVID-related peak of 33.8% in April 2020 and a long-run average of 8.9%. Moreover, Fed data shows the revolving consumer credit outstanding amount increased to $1.1 trillion in April, a new record high.
Given the above dynamics, it comes as little surprise that the consumer is reeling, tapping revolving credit lines in an effort to maintain their standard of living in the wake of multi-decade high inflation, rising interest rates, and persistent negative real wage growth. The University of Michigan’s monthly consumer sentiment index reflected this pessimism in May, with the survey measure witnessing further deterioration, declining to the lowest reading since August 2011. The Fed’s ongoing attempt to rein in inflation through quantitative tightening measures and hawkish forward guidance could be put to the test in the second half of 2022, as bond market proxies continue to reflect a substantially steep implied policy path and the health of the U.S. consumer develops significant downward momentum.
To conclude, performance across stock and bond markets appeared closer to historical norms in May after enduring significant downside volatility in April. Commodity-related sectors of the global investment universe continued to generate handsome returns, reflecting the ongoing global inflationary impulse. These inflationary pressures, however, sent interest rates higher and some gauges of the health of the U.S. consumer meaningfully lower, the degradation of which could complicate the Fed’s plans of a further tightening of monetary conditions.
Market Returns
Global Equity
-
Although global equities returns ended the month roughly flat, significant intramonth volatility made for a difficult market environment. Market volatility was high amid an uncertain macroeconomic environment that included tightening monetary policy, the Russia-Ukraine war, supply chain issues, persistent inflation, tight labor markets, and the upcoming U.S. elections. U.S. equities returns ended the month flat after falling into bear market territory—i.e., dropping by 20% or more from a recent high—intraday, May 20.
-
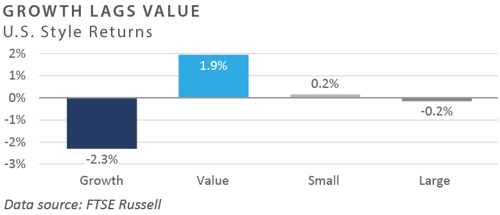
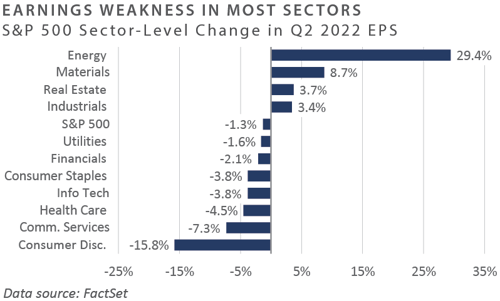
Value equities outperformed growth equities in the U.S. As recession worries rose over the month, investor demand gravitated to quality-oriented businesses that would typically outperform during a potential challenging economic environment, despite the fact that commodity-linked businesses primarily drove performance earlier in the year. By the end of May, 77% and 73% of companies in S&P 500 reported a positive surprise in EPS and revenue, respectively, and above historical averages. The energy sector was the largest positive change in EPS, while consumer discretionary was the largest detractor.
-
UK equities outperformed broader global equity markets, led by solid performance in value-oriented sectors such as energy, financials, and materials. UK energy companies have specifically benefited from the European ban on Russian oil. Europe ex-UK equity returns were negative in local currency terms. The consumer staples sector, which represents a large part of the European equity market, negatively impacted performance as the sector has struggled to pass inflationary cost increases to the consumer, which has compressed margins.
-
The Japanese stock market saw solid performance in May. With fears of inflation abating somewhat, corporate guidance was better than expected which provided some relief to investors. Volatility was high in the equity and currency markets as the Japanese yen strengthened relative to the U.S. dollar before falling close to the previous level of 130.
-
Emerging market equities were up only slightly for the month, but held up well relative to other global markets. The weakness in the U.S. dollar benefitted equity returns. Latin America generated robust returns—specifically Chile, as the country’s new constitution was well-received by investors. As lockdown restrictions in Shanghai began to ease and the government provided liquidity to the market, Chinese equities posted gains. Although oil prices rose on the month, market returns for emerging market net exporters such as Saudi Arabia, Qatar, and Kuwait were negative.
Fixed Income
-
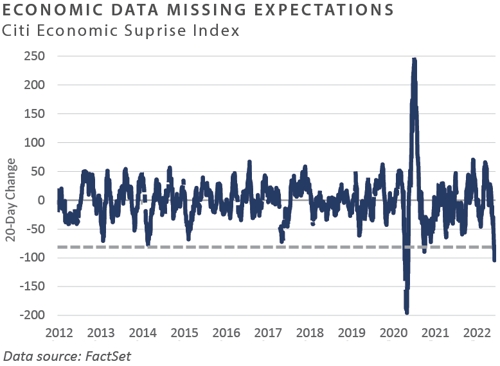
After the 10-year Treasury yield reached an intraday cycle high near 3.2% in early May, concerns surrounding economic activity and rate hike expectations caused the yield curve to reprice lower. During the month, the 2-year U.S. Treasury yield fell 17 bps to 2.53%, while the 10-year U.S. Treasury yield fell 4 bps to 2.85%. Atlanta Fed President Raphael Bostic suggested the central bank may take a pause from planned tightening in September as economic weakness develops. The comment coincided with the Citi Economic Surprise Index falling below the zero level, indicating economic data is surprising to the downside. Market participants quickly discounted reduced rate hike expectations and interpreted Bostic’s comments as the “Fed put” coming back on the table.
-
The central bank is early into its latest tightening cycle, but the impacts of reduced accommodation and inflation are beginning to weigh on economic data. Focusing on the consumer, higher borrowing costs compounded by escalating costs of living have caused the personal savings rate to drop to levels not witnessed since the Great Financial Crisis. As a consequence, consumers are tapping credit cards to fund purchases, with outstanding balances surpassing 2019 levels and totaling more than $100 billion off the 2021 lows. While the labor market has not seen material degradation thus far, mounting headlines of tech-related layoffs raise concerns for future labor market data prints.
-
Performance within credit was bifurcated between the first three weeks and the final week of the month, with credit struggling in the former and rallying in the latter. IG and HY credit suffered in early May as broader market volatility and a dire outlook within credit drove negative price action. Highlighting this point, Carnival Cruise issued $1 billion of HY bonds at a yield of over 10%, while just seven months ago they floated roughly $2 billion at 6%. Additionally, bank loans suffered from the reversal in rate hike expectations and concerns around credit fundamentals as floating-rate coupons reset higher. We believe further deterioration in the loan market will be important to monitor moving forward in case degradation leads to downgrades and defaults.
-
Securitized sectors fared better than their corporate counterparts with higher-quality securities outperforming their lower-quality counterparts. CLOs came under pressure during the month as loan prices retreated and limited secondary market activity pushed spreads wider. Although CLO formation has slowed from last year’s red-hot pace, there are over 160 active CLO warehouse facilities outstanding. Warehouses can remain open for an extended period of time, allowing CLO managers to “wait out” wide liability pricing or take advantage of low-priced assets. This dynamic could serve as a backstop to bank loans, should technical selling pressures hit quality assets.
Real Assets
REAL ESTATE
-
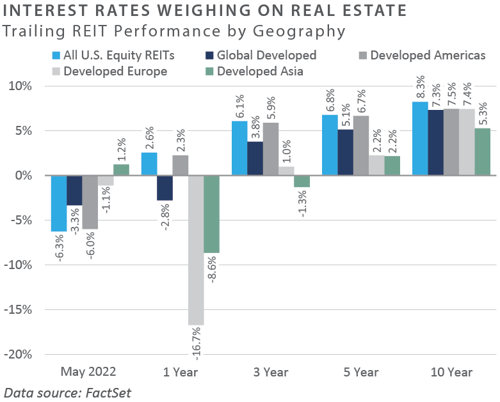
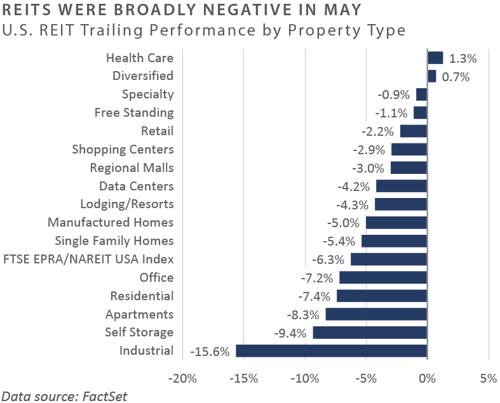
Publicly traded real estate securities (REITs) declined, due in part to concerns related to the impact of higher interest rates on real estate values. The increased likelihood of rising interest rates led to decreased investor demand for sectors tied to consumer spending, such as malls, and those with sensitivity to higher interest rates in the form of negative leverage, such as apartments.
-
Year-to-date, REIT sectors with higher exposure to consumer spending, such as regional malls, and sectors exposed to higher energy costs, such as manufactured homes, underperformed, driven in part by valuations concerns, the potential impact of slower economic growth, and investors demand for more value-oriented property types. Sectors with long lease durations—including the industrial and office sectors—also underperformed, given their inability to reset rates and capture inflationary pressures. Conversely, the hotel sector is the only REIT sector with positive returns for the year thus far because of its ability to reset rates daily, which provides greater inflation protection.
NATURAL RESOURCES
-
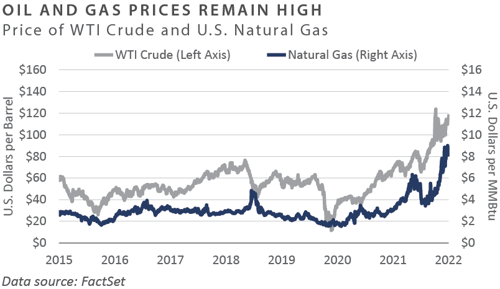
Energy-related commodity prices rose during the month, with oil closing at just under $116/barrel. The momentum behind rising crude prices was driven by the partial embargo of Russian energy products by the European Union, and the anticipated reopening of the Chinese economy following strict COVID-related lockdowns. There appears to be risk of further price increases, as the potential for new supply remains limited, particularly as there are doubts surrounding OPEC’s ability to meet production targets. Additionally, U.S. producers have been reluctant to increase production due to higher labor and materials costs. Natural gas prices rose, as inventories remained below their five-year averages.
-
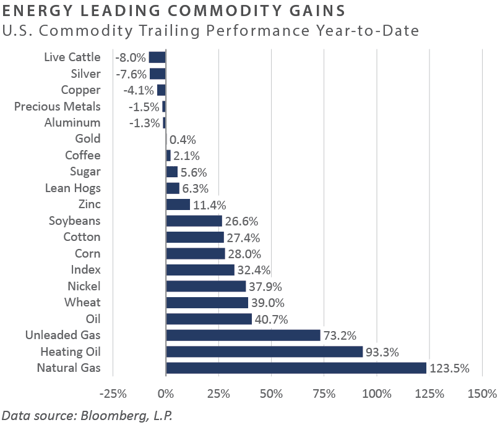
Energy-related commodities continued their trend of outperforming soft commodities and industrial metals. Commodity prices have become sensitive to the concerns surrounding falling consumer sentiment and lowered GDP expectations. The reopening of the Chinese economy is likely to play in both directions, as port congestion in major cities is likely to abate while demand for materials is expected to increase as lockdowns ease.
INFRASTRUCTURE
-
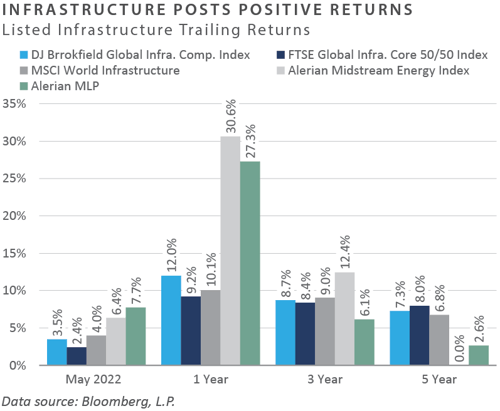
Midstream energy infrastructure outperformed the broader equity markets in May. Midstream companies continue to exhibit capital discipline by focusing on returning cash to shareholders rather than increasing capital expenditures, all while commodity prices and pipeline utilization remain relatively high, giving midstream companies pricing power over their takeaway capacity.
-
Listed infrastructure stock returns were broadly positive. Transportation and renewable infrastructure assets detracted in May as railroads and passenger rail offset other positively performing transportation sectors such as airports, marine ports, and toll roads. While renewables posted positive performance through May, the sector remains a laggard year-to-date relative to the broader index.
Diversifying Strategies
-
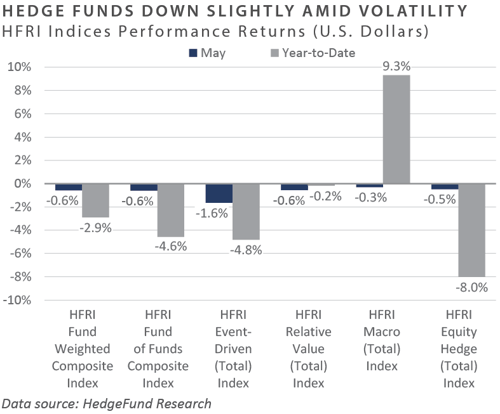
Main hedge fund strategies detracted slightly in May as volatility accelerated across equities, fixed income, and commodities. Hedge fund strategies were able to protect against drawdowns felt in other asset classes.
-
Global macro trend following strategies lost momentum during the month as recent strong trends reversed course. Most notably, long U.S. dollar and long agricultural commodity positions were the biggest detractors.
-
Hedge equity managers continued to experience pain across healthcare and technology-focused strategies. Growth-oriented equities also significantly underperformed in 2022. Long/short equity managers focused on energy were the strongest performers during the month.
-
Event-driven managers struggled and the merger arbitrage environment weakened in the month. Activist strategies also faced headwinds as the market volatility impacted most equity-related investments negatively. All underlying event strategies declined during May.
INDICES
The Alerian MLP Index is a composite of the 50 most prominent energy Master Limited Partnerships that provides investors with an unbiased, comprehensive benchmark for this emerging asset class.
Barclays Capital Fixed Income Indices is an index family comprised of the Barclays Capital Aggregate Index, Government/Corporate Bond Index, Mortgage-Backed Securities Index, and Asset-Backed Securities Index, Municipal Index, High-Yield Index, and others designed to represent the broad fixed income markets and sectors within constraints of maturity and minimum outstanding par value. See https://ecommerce.barcap.com/indices/index.dxml for more information.
The CBOE Volatility Index (VIX) is an up-to-the-minute market estimate of expected volatility that is calculated by using real-time S&P 500 Index option bid/ask quotes. The Index uses nearby and second nearby options with at least 8 days left to expiration and then weights them to yield a constant, 30-day measure of the expected volatility of the S&P 500 Index. FTSE Real Estate Indices (NAREIT Index and EPRA/NAREIT Index) includes only those companies that meet minimum size, liquidity and free float criteria as set forth by FTSE and is meant as a broad representation of publicly traded real estate securities. Relevant real estate activities are defined as the ownership,
HFRI Monthly Indices (HFRI) are equally weighted performance indexes, compiled by Hedge Fund Research Inc. (HFX), and are used by numerous hedge fund managers as a benchmark for their own hedge funds. The HFRI are broken down into 37 different categories by strategy, including the HFRI Fund Weighted Composite, which accounts for over 2000 funds listed on the internal HFR Database. The HFRI Fund of Funds Composite Index is an equal weighted, net of
J.P. Morgan’s Global Index Research group produces proprietary index products that track emerging markets, government debt, and corporate debt asset classes. Some of these indices include the JPMorgan Emerging Market Bond Plus Index, JPMorgan Emerging Market Local Plus Index, JPMorgan Global Bond Non-US
Merrill Lynch high yield indices measure the performance of securities that pay interest in cash and have a credit rating of below investment grade. Merrill Lynch uses a composite of Fitch Ratings, Moody’s and Standard and Poor’s credit ratings in selecting bonds for these indices. These ratings measure the risk that the bond issuer will fail to pay interest or to repay principal in full. See www.ml.com for more information.
Morgan Stanley Capital International – MSCI is a series of indices constructed by Morgan Stanley to help institutional investors benchmark their returns. There
Russell Investments
S&P 500 Index consists of 500 stocks chosen for market size, liquidity and industry group representation, among other factors by the S&P Index Committee, which is a team of analysts and economists at Standard and Poor's. The S&P 500 is a market-value weighted index, which means each stock’s weight in the index is proportionate to its market value and is designed to be a leading indicator of U.S. equities, and meant to reflect the risk/return characteristics of the
Information on any indices mentioned can be obtained either through your advisor or by written request to information@feg.com.
DISCLOSURES
This report was prepared by FEG (also known as Fund Evaluation Group, LLC), a federally registered investment adviser under the Investment Advisers Act of 1940, as amended, providing non-discretionary and discretionary investment advice to its clients on an individual basis. Registration as an investment adviser does not imply a certain level of skill or training. The oral and written communications of an adviser provide you with information about which you determine to hire or retain an adviser. Fund Evaluation Group, LLC, Form ADV Part 2A & 2B can be obtained by written request directly to: Fund Evaluation Group, LLC, 201 East Fifth Street, Suite 1600, Cincinnati, OH 45202, Attention: Compliance Department.
The information herein was obtained from various sources. FEG does not guarantee the accuracy or completeness of such information provided by third parties. The information in this report is given as of the date indicated and believed to be reliable. FEG assumes no obligation to update this information, or to advise on further developments relating to it. FEG, its affiliates, directors, officers, employees, employee benefit programs and client accounts may have a long position in any securities of issuers discussed in this report.
Index performance results do not represent any managed portfolio returns. An investor cannot invest directly in a presented index, as an investment vehicle replicating an index would be required. An index does not charge management fees or brokerage expenses, and no such fees or expenses were deducted from the performance shown.
Bloomberg Index Services Limited. BLOOMBERG® is a trademark and service mark of Bloomberg Finance L.P. and its affiliates (collectively “Bloomberg”). Bloomberg or Bloomberg’s licensors own all proprietary rights in the Bloomberg Indices. Bloomberg does not approve or endorse this material or guarantee the accuracy or completeness of any information herein, nor does Bloomberg make any warranty, express or implied, as to the results to be obtained therefrom, and, to the maximum extent allowed by law, Bloomberg shall not have any liability or responsibility for injury or damages arising in connection therewith.
Neither the information nor any opinion expressed in this report constitutes an offer, or an invitation to make an offer, to buy or sell any securities.
Any return expectations provided are not intended as, and must not be regarded as, a representation, warranty or predication that the investment will achieve any particular rate of return over any particular time period or that investors will not incur losses.
Past performance is not indicative of future results.
Investments in private funds are speculative, involve a high degree of risk, and are designed for sophisticated investors.
All data is as of May 31, 2022 unless otherwise noted.