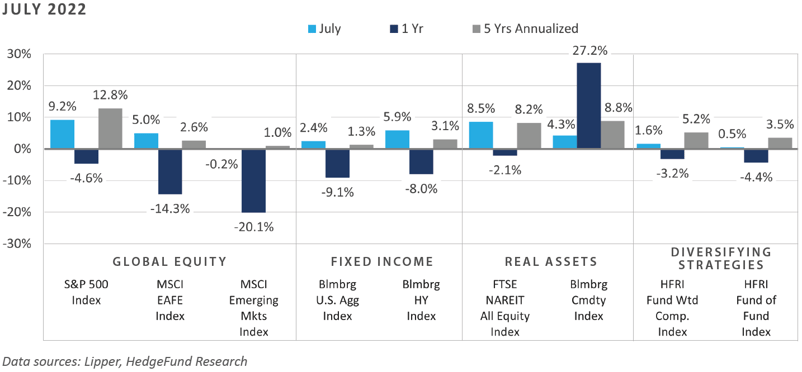
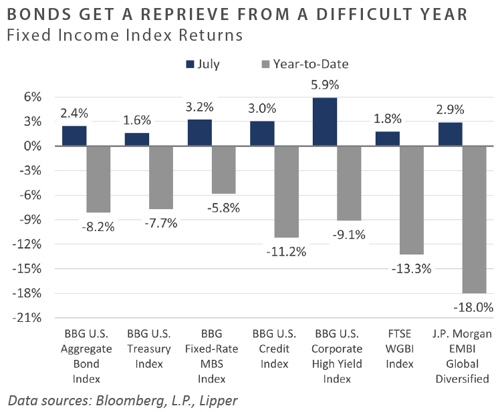
Investors breathed a sigh of relief in July amid rebounding performance across most major asset classes and categories, despite confirming evidence of a slowdown in U.S. economic activity and a further tightening of monetary conditions by the Federal Reserve (Fed). Performance themes during the month favored the rate-sensitive corners of the financial markets—bucking the trend that has generally been in place for the past year—as interest rates declined sharply. Global equities generated strong returns on the month, with notably robust performance across small cap and growth sectors, while emerging markets lagged meaningfully. Bond performance across both high quality and below investment-grade sectors was broadly positive, with high yield bonds (Bloomberg U.S. Corporate High Yield Index) posting the strongest monthly gain (5.9%) since October 2011. Similar to stocks and bonds, real asset returns in July were largely positive, despite an ongoing growth slowdown both domestically and abroad.
Economic Update
Fed Hikes Rates to "Neutral" Despite Weakening Economic Fundamentals
Persistent inflationary pressures, driven primarily by lingering supply chain disruptions and a historically tight labor market, prompted the Fed to hike the policy rate 75 basis points (bps) at their late July meeting, an increase which placed the upper bound on the targeted level at 2.5%. While the 75 bps hike was widely anticipated by the bond market, the increase was significant in that the 2.5% rate now matches the Fed’s estimate of the neutral policy level—which the Fed deems to be neither accommodative nor restrictive on economic activity.
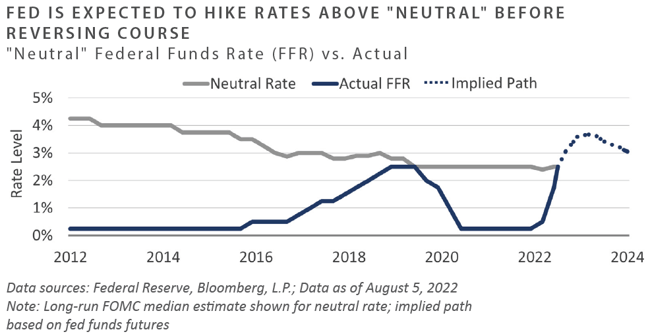
With bond market implied gauges reflecting an elevated likelihood the Fed will hike rates another 75 bps at their September meeting, U.S. monetary policy is set to turn restrictive this fall, a dynamic which is anticipated to serve as a headwind to broader economic conditions and potentially further pressure risk assets. With the economy already weakened by inflation, restrictive monetary policy may indeed help temper the persistent inflationary impulse while pressuring the downward trajectory of economic activity further.
The Fed’s efforts at engineering a soft landing—something which they historically have had a poor track record of achieving in their more than 100 years of existence—continues to appear a lofty goal. In the first six months of 2022, the economy witnessed back-to-back quarters of negative inflation-adjusted GDP growth, despite monetary conditions appearing relatively accommodative. It stands to reason that the Fed shifting to a restrictive stance, which is anticipated to be a growing theme over the next six months, should help restrain both aggregate demand and investor risk-taking in the near term.
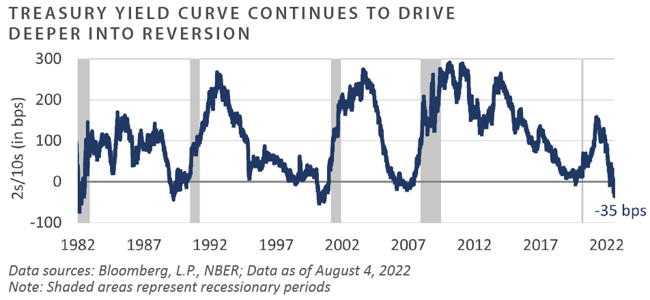
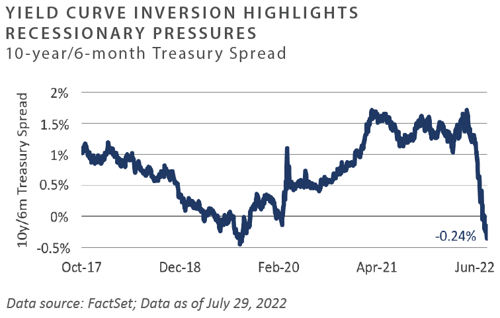
This dynamic is confirmed by the continued flattening bias of the Treasury yield curve, with many curve slopes reflecting inversion, an indication that monetary conditions already appear restrictive, despite the federal funds rate well below the inflation rate and the policy rate just now reaching a neutral level. The spread between 2- and 10-year Treasury notes, for example, declined a staggering 29 bps in July—following a decline of similar magnitude in June—with this spread descending below levels witnessed before the 2007-2009 Global Financial Crisis.
July’s Bureau of Labor Statistics Employment Situation report highlighted the conundrum currently facing the Fed. While the economy has trended lower in recent quarters in real terms, inflation has remained sticky and the labor market remains tight. Nonfarm payrolls surged 528,000 during the month, more than double the Bloomberg median consensus estimate, helping send the headline unemployment rate to 3.5%, a fresh cycle low.
Both sides of the Fed’s dual mandate point to the need for further tightening of monetary conditions, despite an uncooperative economic backdrop, bringing to light the Fed’s lack of action to get inflation under control in mid- 2021 when cost pressures began to push above the Fed’s 2% targeted inflation level.
To conclude, July presented global investors with overwhelmingly positive returns, a welcomed development following the immense challenges investors endured in the first six months of the year. While some market participants have been quick to extrapolate July’s performance rebound as evidence the worst has passed, the lack of fundamental improvement both at the macro and micro level illustrates that risk to asset prices may be on the horizon with the Fed’s pivot from accommodative to restrictive policy.
Market Returns
Global Equity
-
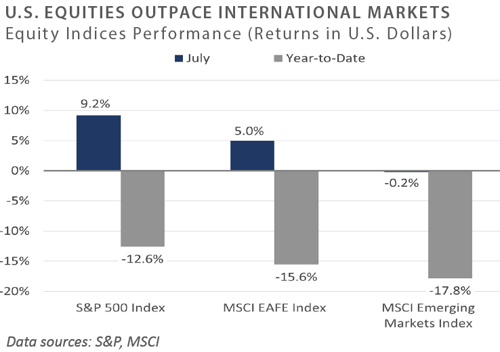
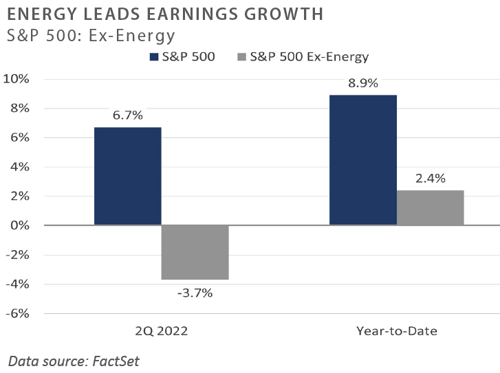
Although news that the second quarter showed slowing economic growth, developed country market returns were broadly positive. The S&P 500 generated a return of just over 9% on the month, recouping some of the significant losses from the first half of the year. However, some economists are weary of classifying this period as a recession, as earnings have yet to be significantly impacted despite the two consecutive quarters of negative economic growth. By the end of the month, 60% of the S&P 500 had reported earnings, with 73% of those companies reporting a positive EPS surprise–essentially equal to the average of the last 10 years–and 66% reporting a positive revenue surprise.
-
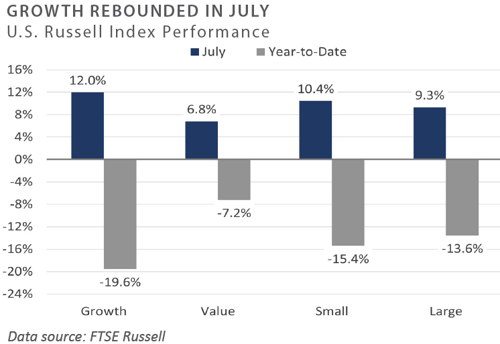
Growth outperformed value for the month as the possibility for having reached peak inflation helped to reduce the risk viewed in long-duration assets. The markets priced in the potential for Fed rate cuts in early 2023, as inflation and rising interest rates have curbed economic activity. Quality and growth were the best-performing factors for the month, while value and dividend yield lagged.
-
UK equity returns were positive, along with other global developed markets. Sectors which had been a drag on performance in the first half of the year drove the markets in July, including the consumer discretionary and industrials sectors. UK inflation reached 9.4% and economic growth declined, prompting one Bank of England governor to signal the potential for rate hikes. European equity performance was also positive for the month. As inflation continues to impact the euro zone economy, the European Central Bank raised interest rates 50 bps, ending negative rates in the region.
-
The Japanese stock market continued to be significantly influenced by the currency market, which benefited equity performance in the latter half of the month as the yen recouped some losses against the dollar, leaving the market up almost 4% in U.S. dollar terms. Inflation remains a dominant theme globally, and the 2.2% inflation reading in Japan was met by the Bank of Japan holding rates steady.
-
Unlike developed markets, emerging market equity returns were negative in July. China was the primary contributor to poor equity performance given the nation’s status as the largest emerging market. The Chinese property market continued to face issues as future homeowners refuse to pay mortgages through the established pre-pay model on unfinished homes, putting selling pressure on Chinese equities. The weakness in China counteracted the strong performance of most of the other countries in the index, especially South Korea, India, and Chile.
Fixed Income
-
Rate-sensitive sectors experienced reprieve as yields broadly fell across the belly and long end of the yield curve. Short-term rates continued their upward march as the Fed maintained their trajectory away from accommodative monetary policy. During the month, the 10-year U.S. Treasury yield fell 31 bps to 2.67% while the 2-year U.S. Treasury fell just 3 bps to 2.89%. The widely followed 10-year/2-year Treasury spread spent nearly the entire month inverted and reached the deepest level of inversion since 2000. Continued fear of weakening economic growth coupled with perceived dovish commentary from Fed Chair Powell drove long-term rates lower. Conversely, upward pressures in various inflation metrics, such as late July’s PCE surprise, supported the upward path of short-term rates.
-
Powell’s remarks following the FOMC’s July meeting sparked a risk rally as market participants interpreted his commentary as a pivot towards dovishness. Powell’s scripted opening statement reiterated the Fed’s determination to bring inflation down to their 2% goal while acknowledging an uptick in weakening economic data. His unscripted remarks revealed current policy rates are at a neutral reading and the Fed will not provide forward guidance for coming meetings. Market participants discounted additional rate cuts in 2023, as the lack of forward guidance implied a dovish pivot. Corners of the fixed income markets were not convinced; however, and the 5-year Forward Inflation Expectation rose 24 bps to 2.33% in the last 10 days of July. Rising inflation expectations will be important to monitor before the Fed’s next meeting in late September.
-
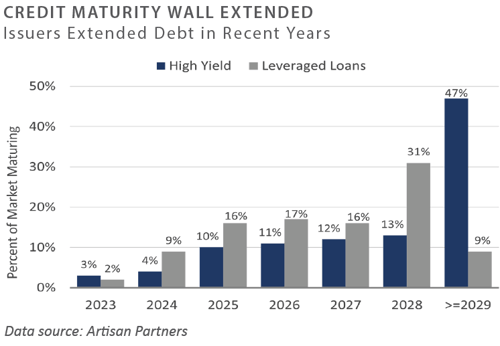
Investment grade and below-investment grade credit produced strong positive returns, as a combination of spread tightening and falling yields contributed to performance. The Bloomberg U.S. Credit Index (IG) and Corporate High Yield Index (HY) returned 3.0% and 5.9%, respectively, while the S&P/LSTA Leverage Loan 100 Index returned -3.1%. A renewed spirit of risk appetite supported spread compression after several better-than-expected earnings reports. Although liquidity remained particularly acute, anemic new issue markets and returning fund flows provided technical support for credit markets.
-
Falling interest rates and spreads sparked a rally in agency mortgages. For the month of July, the Bloomberg U.S. MBS Index gained over 3%. During the month, the S&P Case-Shiller 20-City Composite for May indicated more than a 20% year-over-year increase, slightly below the previous month’s reading. Although this metric is reported on a lagged basis, home price appreciation remains surprisingly robust given the backup in mortgage rates, though it should be noted that transaction volumes were down markedly relative to 2021. The 30-year fixed mortgage rate fell roughly 0.4% to 5.3% in July, which could place even more pressure on the Fed to tighten financial conditions.
Real Assets
REAL ESTATE
-
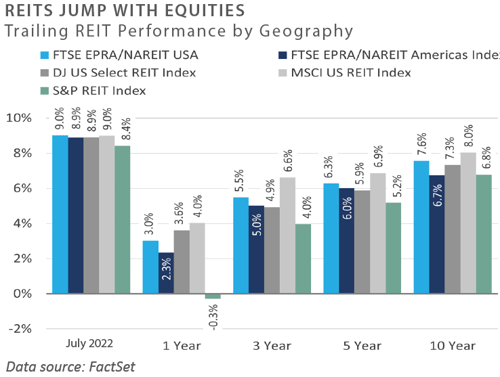
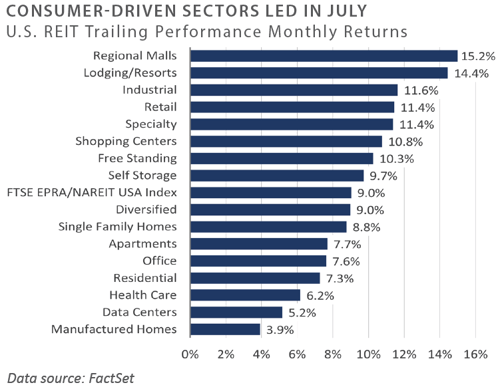
Publicly traded real estate securities (REITs) rebounded sharply in July on the increased likelihood of fewer rate hikes from central banks. All REITs posted positive returns for the month; however, all but two sectors remain negative year-to-date due to deep drawdowns across the market. The exceptions were free-standing and specialty REITs, which have proved less economically sensitive given their longer lease durations. Through July, sectors tied to consumer confidence, such as regional malls, retail, industrial, and shopping centers, outperformed.
-
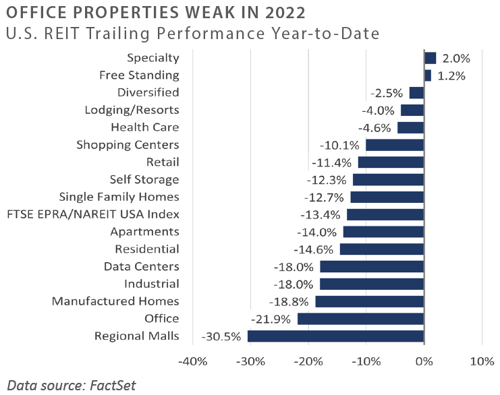
On a year-to-date basis, regional malls and industrial REITs underperformed after selling off on weakening consumer confidence and lower retail outlook. Office REITs continued to struggle year-to-date as demand for office space has failed to rebound in any meaningful fashion. Residential REITs have tracked the benchmark year-to-date, as apartments and single-family rentals declined due to expectations for slower rent growth and the potential impact of higher interest rates on valuations.
NATURAL RESOURCES
-
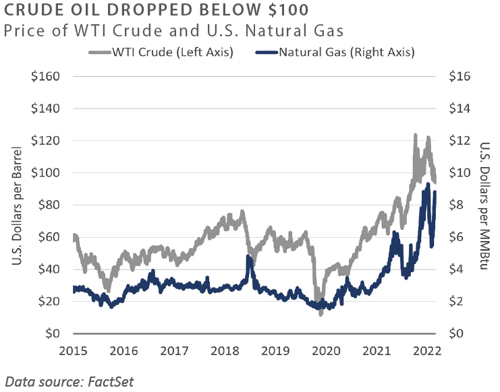
Crude oil and natural gas prices diverged in July, with crude prices declining 9%, while natural gas prices rose 43.6% for the month. Future curves for both commodities remained in steep backwardation, with futures prices below spot prices; however, crude prices declined due to expectations of a recession and weakening demand. U.S. natural gas prices rose sharply in July with the question of energy security once again dominating the market after Russia began cutting supplies to Europe through the Nord Stream pipeline. This raised uncertainty about Europe’s ability to secure sufficient natural gas for the coming winter. The ability of the U.S. to meet international demand for liquified natural gas (LNG) will likely be hampered for the foreseeable future, as the Freeport LNG facility in Houston is expected to remain offline until 2023 following a fire that damaged the facility in June.
-
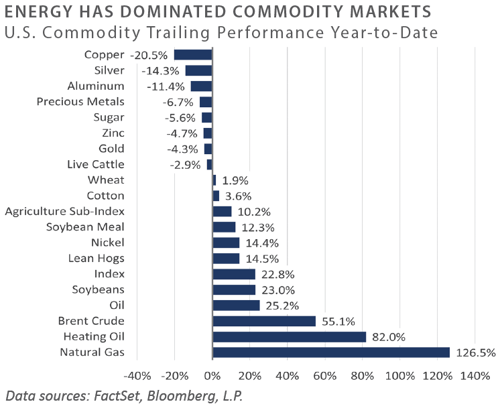
Year-to-date, energy-related commodities continue to outperform compared to industrial metals, precious metals, and soft commodities. Precious metals have failed to provide any meaningful return so far this year despite the high inflationary environment, while agricultural commodities were mostly positive year-to-date, primarily due to concerns about Ukraine's ability to export grains.
INFRASTRUCTURE
-
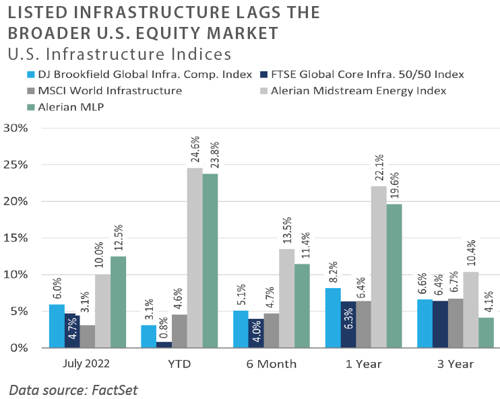
Midstream energy infrastructure outperformed the broader equity and infrastructure markets through July. Fundamentals remained strong in the midstream sector as companies have reported increased distributions from record cash flows in the form of share buybacks and increased dividends following significant deleveraging year-to-date. While crude prices fell in July, MLPs and midstream C-corps returned 12.5% and 10.0%—as measured by the Alerian MLP Index (AMZ) and the Alerian Midstream Energy Index (AMNA)—respectively.
-
Listed infrastructure equity returns were also positive for the month and year-to-date. All sectors except satellites posted positive performance for the month, with top performers including the renewable and transportation sectors. The renewable sector has underperformed so far this year, as growth-related infrastructure has fallen alongside broader equity markets but improved through July. In the telecommunication sector, satellites declined through July and year-to-date, as the only two companies in the sector announced acquisitions in July, effectively delaying a return of capital to shareholders to a later date.
Diversifying Strategies
-
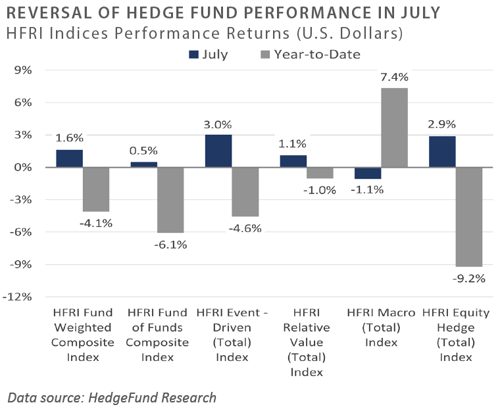
All main hedge fund strategies were contributors for the month outside of global macro. Event-driven and equity hedge managers performed particularly strong in July.
-
Trend following managers faced headwinds in July after a strong first half of the year. The largest detractor was the reversal in the downtrend in bonds. Trend followers have been positioned as short fixed income in 2022; this was highly profitable earlier in the year but has become a source of losses more recently.
-
Within hedged equity, those strategies which had been significant underperformers earlier rebounded strongly in July. Technology and healthcare-related strategies generated strong gains as markets reversed course.
-
Event-driven managers were also contributors to performance across the underlying strategies, with activism leading the way. Strategies more correlated with equities tended to perform better.
INDICES
The Alerian MLP Index is a composite of the 50 most prominent energy Master Limited Partnerships that provides investors with an unbiased, comprehensive benchmark for this emerging asset class.
Barclays Capital Fixed Income Indices is an index family comprised of the Barclays Capital Aggregate Index, Government/Corporate Bond Index, Mortgage-Backed Securities Index, and Asset-Backed Securities Index, Municipal Index, High-Yield Index, and others designed to represent the broad fixed income markets and sectors within constraints of maturity and minimum outstanding par value. See https://ecommerce.barcap.com/indices/index.dxml for more information.
The CBOE Volatility Index (VIX) is an up-to-the-minute market estimate of expected volatility that is calculated by using real-time S&P 500 Index option bid/ask quotes. VIX uses nearby and second nearby options with at least 8 days left to expiration and then weights them to yield a constant, 30-day measure of the expected volatility of the S&P 500 Index. FTSE Real Estate Indices (NAREIT Index and EPRA/NAREIT Index) includes only those companies that meet minimum size, liquidity and free float criteria as set forth by FTSE and is meant as a broad representation of publicly traded real estate securities. Relevant real estate activities are defined as the ownership,
HFRI Monthly Indices (HFRI) are equally weighted performance indexes, compiled by Hedge Fund Research, Inc. (HFR), and are used by numerous hedge fund managers as a benchmark for their own hedge funds. The HFRI are broken down into 37 different categories by strategy, including the HFRI Fund Weighted Composite, which accounts for over 2,000 funds listed on the internal HFR Database. The HFRI Fund of Funds Composite Index is an equal weighted, net of
J.P. Morgan’s Global Index Research group produces proprietary index products that track emerging markets, government debt, and corporate debt asset classes. Some of these indices include the JPMorgan Emerging Market Bond Plus Index, JPMorgan Emerging Market Local Plus Index, JPMorgan Global Bond Non-US
Merrill Lynch high yield indices measure the performance of securities that pay interest in cash and have a credit rating of below investment grade. Merrill Lynch uses a composite of Fitch Ratings, Moody’s, and Standard & Poor’s credit ratings in selecting bonds for these indices. These ratings measure the risk that the bond issuer will fail to pay interest or to repay principal in full. See www.ml.com for more information.
Morgan Stanley Capital International – MSCI is a series of indices constructed by Morgan Stanley to help institutional investors benchmark their returns. There
Russell Investments
S&P 500 Index consists of 500 stocks chosen for market size, liquidity and industry group representation, among other factors by the S&P Index Committee, which is a team of analysts and economists at Standard & Poor's. The S&P 500 is a market-value weighted index, which means each stock’s weight in the index is proportionate to its market value and is designed to be a leading indicator of U.S. equities, and meant to reflect the risk/return characteristics of the
Information on any indices mentioned can be obtained either through your advisor or by written request to information@feg.com.
DISCLOSURES
This report was prepared by FEG (also known as Fund Evaluation Group, LLC), a federally registered investment adviser under the Investment Advisers Act of 1940, as amended, providing non-discretionary and discretionary investment advice to its clients on an individual basis. Registration as an investment adviser does not imply a certain level of skill or training. The oral and written communications of an adviser provide you with information about which you determine to hire or retain an adviser. Fund Evaluation Group, LLC, Form ADV Part 2A & 2B can be obtained by written request directly to: Fund Evaluation Group, LLC, 201 East Fifth Street, Suite 1600, Cincinnati, OH 45202, Attention: Compliance Department.
The information herein was obtained from various sources. FEG does not guarantee the accuracy or completeness of such information provided by third parties. The information in this report is given as of the date indicated and believed to be reliable. FEG assumes no obligation to update this information, or to advise on further developments relating to it. FEG, its affiliates, directors, officers, employees, employee benefit programs and client accounts may have a long position in any securities of issuers discussed in this report.
Index performance results do not represent any managed portfolio returns. An investor cannot invest directly in a presented index, as an investment vehicle replicating an index would be required. An index does not charge management fees or brokerage expenses, and no such fees or expenses were deducted from the performance shown.
Bloomberg Index Services Limited. BLOOMBERG® is a trademark and service mark of Bloomberg Finance L.P. and its affiliates (collectively “Bloomberg”). Bloomberg or Bloomberg’s licensors own all proprietary rights in the Bloomberg Indices. Bloomberg does not approve or endorse this material or guarantee the accuracy or completeness of any information herein, nor does Bloomberg make any warranty, express or implied, as to the results to be obtained therefrom, and, to the maximum extent allowed by law, Bloomberg shall not have any liability or responsibility for injury or damages arising in connection therewith.
Neither the information nor any opinion expressed in this report constitutes an offer, or an invitation to make an offer, to buy or sell any securities.
Any return expectations provided are not intended as, and must not be regarded as, a representation, warranty or predication that the investment will achieve any particular rate of return over any particular time period or that investors will not incur losses.
Past performance is not indicative of future results.
Investments in private funds are speculative, involve a high degree of risk, and are designed for sophisticated investors.
All data is as of July 31, 2022 unless otherwise noted.