The strong positive momentum across most major asset classes and categories in 2021 encountered meaningful headwinds in the first month of 2022, particularly among rate-sensitive assets, as market participants digested the Federal Reserve’s (Fed) pivot to incrementally tighter policy. With certain economic data witnessing cooling pressures in January, concerns of tighter Fed policy in the wake of moderating economic activity weighed on investor sentiment. Financial market performance was broadly negative in January, as many equity indices dropped into technical correction and—in some instances—bear market territory, with notably poor momentum witnessed across the domestic growth and small cap constituency. Despite overwhelmingly negative equity returns, most major fixed income indices faced similar performance challenges amid a sharp increase in Treasury interest rates and widening below-investment-grade credit risk premiums. Real assets returns were mixed, as the rate-sensitive domestic Real Estate Investment Trust (REIT) sector suffered its worst monthly decline since March 2020. Still, strong gains were generated across the commodities complex, particularly in energy-related sectors.
Economic Update
Despite a Strong Fourth Quarter, U.S. Economic Growth Faces Headwinds in Early 2022
The U.S. economy strengthened considerably in the final quarter of 2021, as real GDP advanced at an annualized pace of 6.9%, easily besting the Bloomberg median consensus estimate’s call for a 5.5% gain. The 6.9% pace was the second strongest quarterly reading in the post-COVID era behind the base-effect-distorted third quarter
2020 reading.
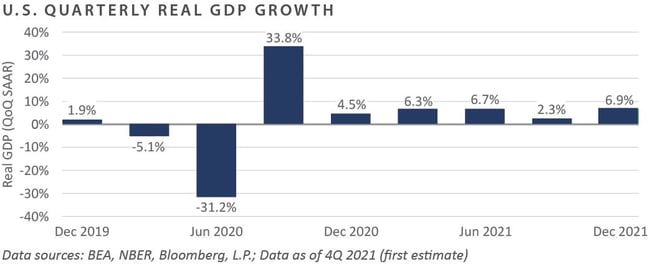
Against a divided backdrop that included near-zero policy rates and a strengthening labor market juxtaposed against persistent supply chain bottlenecks and multi-decade high inflation, the U.S. economy’s inflation-adjusted performance in the fourth quarter added to the overwhelming evidence pointing to the need for policymakers to rein in their pandemic-driven ultra-accommodative stances.
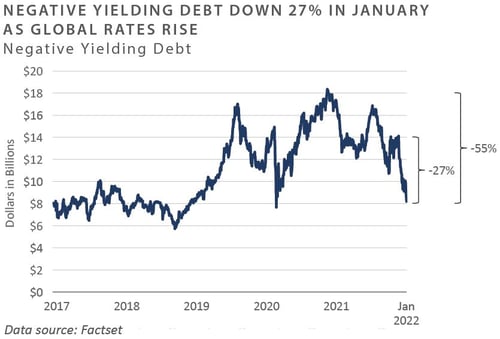
Both the Fed and bond market participants continue to discount multiple increases to the federal funds rate throughout 2022 and 2023, with the latest pricing on fixed income derivatives—such as Eurodollar futures and overnight index swaps—suggesting at least five, 25 basis point hikes could occur in 2022, with the potential for multiple subsequent hikes in 2023.
Despite continued robust sentiment for tighter monetary policy, certain real-time measures of early 2022 business activity have turned lower, sparking concerns of a Fed “policy error.” Through January, for example, Markit Partners reported a notable decline across their Services Purchasing Manager Index (PMI), which declined to an index level of 51.2, dangerously close to the 50 expansion/contraction threshold. The level was nearly 20 index level points below readings witnessed last summer and the weakest print since July 2020.
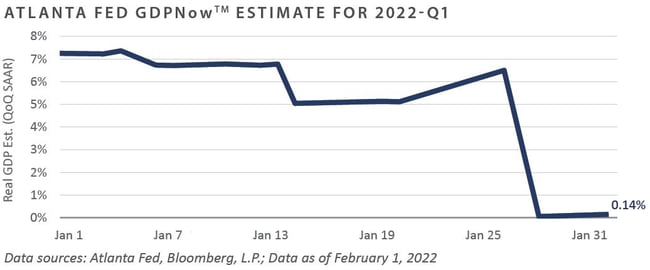
In addition to weakness emanating from recent survey-based growth estimates, some model-based current quarter growth estimates have also experienced downward pressure. The Atlanta Fed’s GDPNow model, which tracks current quarter GDP growth based on real-time incoming economic data, slumped to an essentially flat reading as of the latest update in early February.
The ongoing spread of COVID-19 variant Omicron has undoubtedly weighed on these measures, yet policymakers in the U.S. do not appear particularly concerned, as persistent above-trend inflation and a labor market exhibiting qualities of “maximum employment” have provided a green light to begin policy tightening.
While a single month of hit-or-miss economic data hardly defines a trend—particularly on the heels of solid late-2021 momentum—the cooling of business activity in early 2022 has the potential to hinder the Fed’s intentions of meaningfully tightening policy absent a near-term resumption of 2021’s positive economic trends.
To summarize, global investors were faced with a revival of volatility to the downside across most major risk sectors and safe-haven assets alike in January, as market participants grappled with continued sentiment for less-accommodative Fed policies paired with potential warning signs of a slowdown in economic activity, the combination of these two forces sparked worries of a policy mishap that could drive market volatility to even higher levels.
Market Returns
Global Equity
-
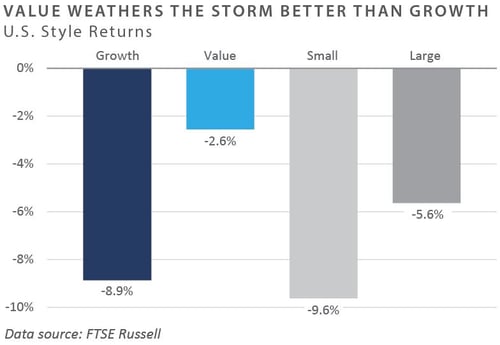
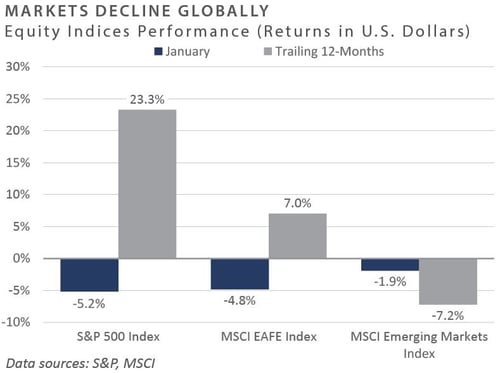
Global equity markets stumbled into the new year in the red following strong performance in 2021. Inflation, expected monetary tightening, rising yields, the Omicron variant, and supply chain bottlenecks helped prompt nervous investors to increase selling pressures on risky assets. Emerging market equities experienced a tough 2021 and ended the year trading at 20-year lows relative to the S&P 500. Consequently, emerging markets did not witness the same declines in January as elevated valuations compressed in developed international and U.S. equity markets.
-
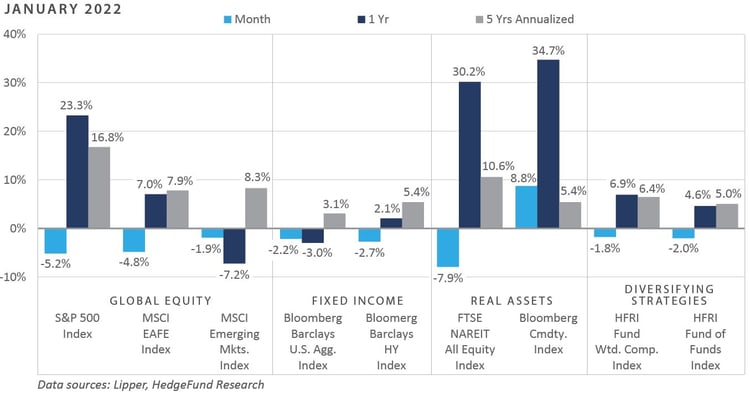
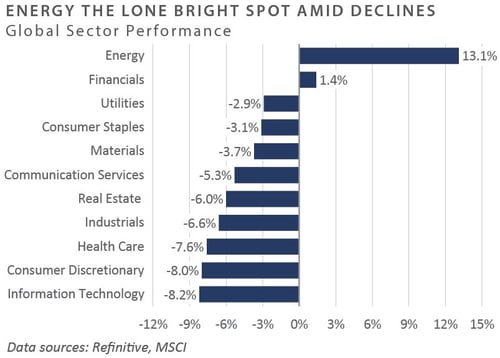
U.S. equities saw a sharp reversal in January, despite a solid start to corporate earnings season, with the S&P 500 down approximately 5.2%. Market participants favored value sectors, such as energy and financials, at the expense of information technology and consumer discretionary throughout the market cap spectrum. Energy stocks also benefitted from potential sanctions on Russian equities in response to Russia’s increased military presence along the nation’s border with Ukraine, indicating the threat of invasion.
-
UK equity performance was essentially flat for the month, while companies reported healthy earnings growth across various sectors. The materials, financials, and consumer staples sectors drove returns in the UK as investors’ most robust demand was for the inexpensive areas of the market. The UK economy grew 0.9% in November, ahead of expectations and reaching pre-pandemic levels. Conversely, European equity performance trended with global markets and posted negative performance in January, with the situation between Russia and Ukraine hurting equity performance. However, like the UK, the eurozone economy returned to its pre-pandemic level, with GDP growing 0.3% in the fourth quarter.
-
Japanese equity market performance was negative in January. The technology and consumer discretionary sectors were hit hard because the semiconductor shortage has continued to put pressure on chip manufacturers and automobile companies, both of which contribute significantly to the Japanese economy. While the rest of the developed world is dealing with record-high inflation, Japan’s inflation remains muted due to a three-year low wage growth rate of 1.9%. The government is encouraging companies to raise wages, as consumer spending has been dampened by minimal wage growth.
-
Emerging market equity returns were negative but fared better than most regions. South Korea and Russia were poor performers over the month due to Korea’s Q4 earnings disappointing to the downside and Russia’s escalating tensions with Ukraine. Emerging market oil exporters such as Saudi Arabia, Qatar, and UAE all benefitted from the rising oil and energy prices and the tensions between Russia and the West.
Fixed Income
-
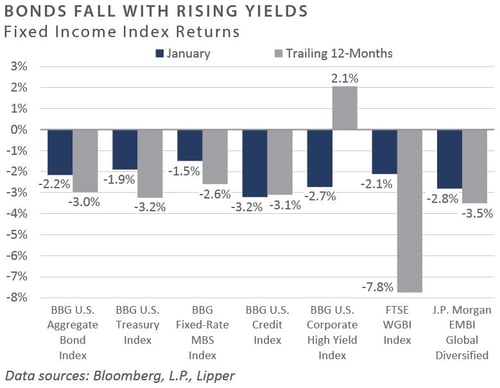
Interest rates sold off along the curve as the market discounted hawkish Fed policy guidance. The 10-year U.S. Treasury yield rose 25 bps to 1.79% during January. The 10-year Treasury also reached a new cycle high, eclipsing 1.9% before retreating. The 10-year/2-year Treasury spread continued to flatten, with the leading indicator falling 18 bps to 61 bps. Highlighting rate movements, the ICE BofA MOVE Index, which tracks interest rate volatility, reached its highest level since March 2020 as rate volatility moved in tandem with equity market volatility.
-
January’s employment data release surprised to the upside, providing more ammunition to the central bank to remove accommodative policies. Despite January’s ADP Employment Report showing results falling below expectations by nearly 500k jobs, nonfarm payrolls beat sell-side estimates with over 450k new jobs added during the month. Additionally, December saw over 700k net revisions while the labor force participation ratio surpassed estimates, rising to 62.2%. Rounding out the report, average hourly earnings beat estimates, increasing 0.7% and 5.7% on a month-over-month and year-over-year basis, respectively.
-
Increasing interest rates and widening spreads created a challenging backdrop for investment and non-investment grade credit. Floating-rate bank loans outperformed their fixed-rate counterparts, with the S&P/LSTA Performing Loan Index returning 0.4%. The outperformance was driven by positive fund flows as investors repositioned into floating-rate sectors and the lower interest rate sensitivity profile of floating-rate loans.
-
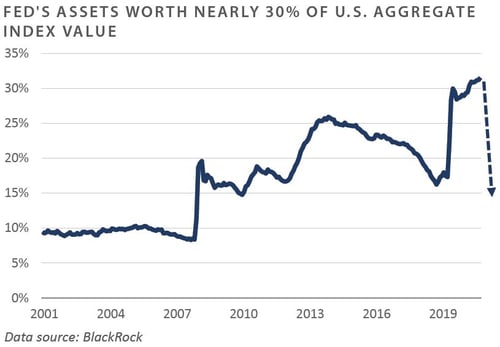
Within securitized credit, CMBS and ABS outperformed agency mortgages as agency spreads meaningfully widened. The Bloomberg US Aggregate MBS Index saw spreads widen 4 bps to reach 42 bps. Lower coupon mortgages—the target of Fed purchases—saw the widest spread widening as rising mortgage rates caused prepayment expectations to fall, thus increasing extension risk. Lower coupon agency mortgages also face technical headwinds as the Fed reduces purchases and eventually reduces the size of their balance sheet. The exit of a constant buyer during the quantitative easing era has led to the expectation that higher coupon mortgages may outperform.
Real Assets
REAL ESTATE
-
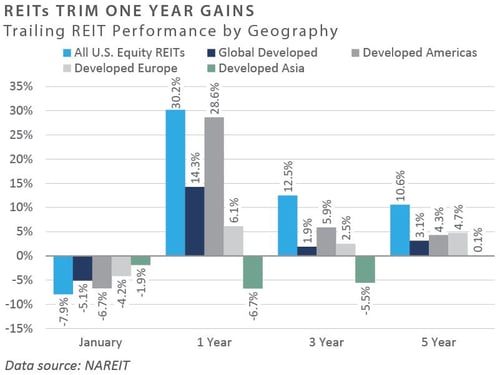
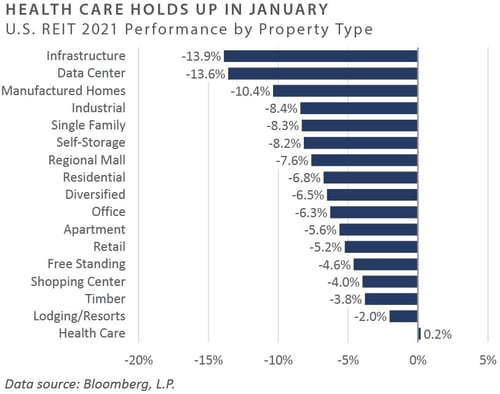
Publicly listed real estate posted negative performance to start 2022. Property sectors with longer life contracts and less inflationary related pricing power—such as data centers and cell towers—were most impacted, each declining more than 13% for the month. The hotel/lodging (-2.0%), retail (-5.2%), and healthcare (0.2%) sectors outperformed with less material declines. The prospect of higher interest rates was a key factor in the weakness in public real estate during the month, as investors favored REITs for their relatively attractive yields. As of the end of January 2022, the yield on the FTSE-NAREIT Index stood at 2.8%.
-
Healthcare REITs led U.S. REIT performance through January as the only sector to post positive performance for the month but returned just 0.2%. Healthcare facilities have generally struggled since the onset of the pandemic because many providers have had to cancel elective surgeries—procedures that typically drive hospital profits—due to the impact of COVID-19 on patient populations, hospital staff, and hospital systems. However, healthcare REITs recovered in January as investor sentiment on the sector improved.
-
Self-storage REITs continued to outperform, returning over 65% over the trailing 1-year through January. Self-storage continues to attract capital because the sector is viewed as a hedge against inflation due to its relatively low capital and labor needs. Additionally, the sector benefits from month-to-month leases, which allow owners to raise rents more frequently than properties with multi-year leases. Self-storage REITs were not immune to the January slowdown and declined nearly 8.2% on the month.
NATURAL RESOURCES
-
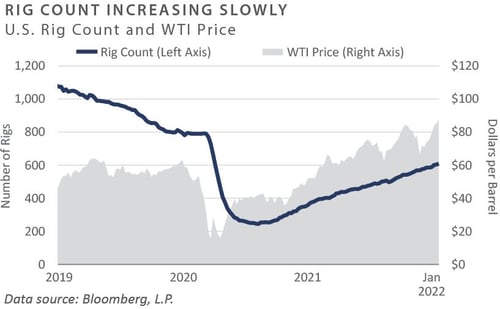
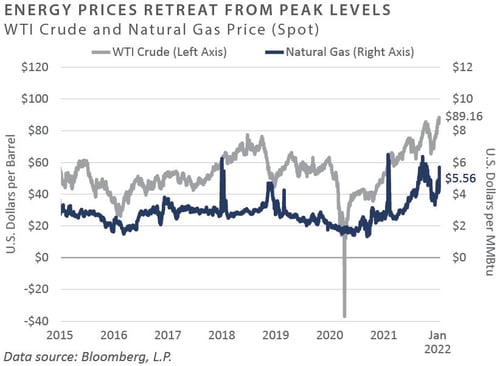
Against a backdrop of struggling equity markets, energy prices rallied in January. After ending 2021 at just over $75/barrel, crude oil prices rose 18% to start the year, finishing the month at a multi-year high of over $88/barrel. Global demand for crude has also continued to accelerate off pandemic lows in 2020, with demand expected to surpass pre-pandemic levels in coming periods. However, anticipated supply has struggled to match the pace of demand. The crude oil supply and demand imbalance are expected to persist as U.S. producers, historically the most significant contributors to global oil supply growth and capital expenditure, have instead elected to accelerate share buybacks and dividend distributions rather than invest in new production.
-
Natural gas started 2022 at $3.50/MMBtu, and prices experienced sharp volatility through January, rising roughly 37% to finish the month at $4.85/MMBtu, driven by colder-than-expected weather across much of North America and Europe. The expiration of contracts caused a brief squeeze in price mid-month; however, the price squeeze was isolated to a single-day contract expiration and had minimal bleed effects on broader natural gas pricing.
-
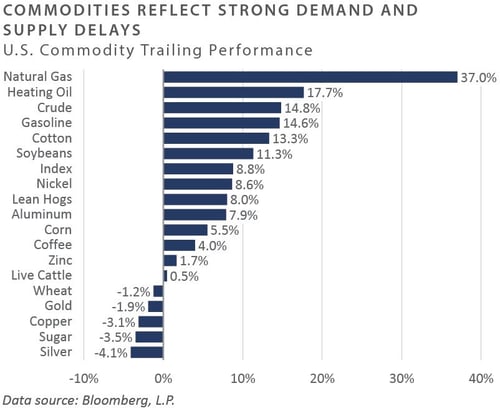
Commodity prices, as measured by the Bloomberg Commodity Index (BCOM), ended the month up 8.8%. Energy-related commodities outperformed during the month, with strong consumer demand, supply chain disruptions, and short labor supply resulting in strong demand for input materials and a decrease in the available production and supply of commodities. Precious metals continued to struggle along with some agricultural products.
INFRASTRUCTURE
-
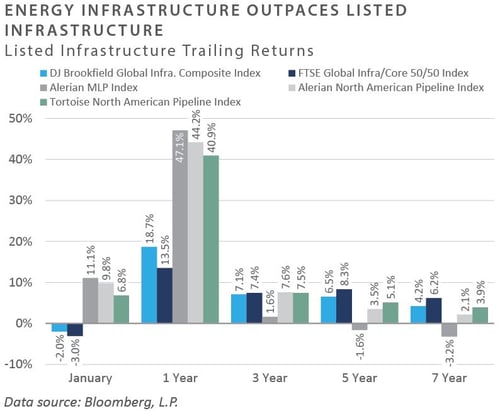
Midstream energy infrastructure, as measured by the Alerian MLP Index, ended January up roughly 11%, outperforming the broader equity market on the back of rising energy prices. Concern around domestic pipeline capacity from key basins, strong price fundamentals for energy commodities, and estimates that the U.S. will overtake Australia and Qatar to become the largest exporter of liquified natural gas in 2022 all helped drive strong price appreciation for midstream assets.
-
Listed infrastructure stocks, as measured by the FTSE Global Core Infrastructure 50/50 Index, ended the month down roughly 3.0%. Telecommunication and renewables assets were most impacted, as rising interest rates affected expected cell tower infrastructure returns. The drawdown in growth-oriented equities adversely impacted renewable-oriented listed equities.
Diversifying Strategies
-
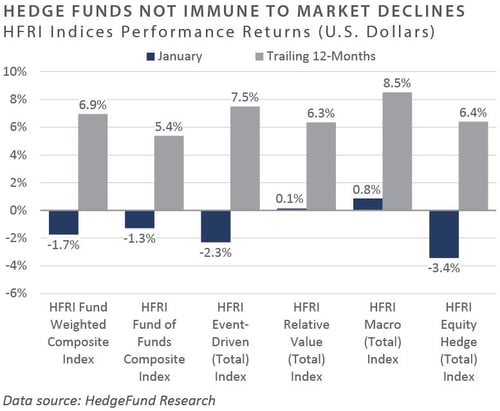
Hedge funds had a rocky start to the year as equity market volatility negatively impacted markets. Uncertainty surrounding the Fed’s new hawkish stance introduced a heightened level of uneasiness among investors.
-
Hedged equity strategies suffered the brunt of the pain, especially within specific growth-oriented sectors like healthcare and technology, which led to the drawdown.
-
Event-driven managers also faced significant headwinds, with equity-oriented strategies such as activism hit the hardest. Losses were broad-based across event-oriented positioning, with credit arbitrage eking out a slight gain.
-
Global macro was the lone bright spot as both discretionary and systematic managers tended to generate positive returns in January. Commodity-oriented strategies were the best performers, with long positions in the energy complex providing significant contributions.
INDICES
The Alerian MLP Index is a composite of the 50 most prominent energy Master Limited Partnerships that provides investors with an unbiased, comprehensive benchmark for this emerging asset class.
Barclays Capital Fixed Income Indices is an index family comprised of the Barclays Capital Aggregate Index, Government/Corporate Bond Index, Mortgage-Backed Securities Index, and Asset-Backed Securities Index, Municipal Index, High-Yield Index, and others designed to represent the broad fixed income markets and sectors within constraints of maturity and minimum outstanding par value. See https://ecommerce.barcap.com/indices/index.dxml for more information.
The CBOE Volatility Index (VIX) is an up-to-the-minute market estimate of expected volatility that is calculated by using real-time S&P 500 Index option bid/ask quotes. The Index uses nearby and second nearby options with at least 8 days left to expiration and then weights them to yield a constant, 30-day measure of the expected volatility of the S&P 500 Index. FTSE Real Estate Indices (NAREIT Index and EPRA/NAREIT Index) includes only those companies that meet minimum size, liquidity and free float criteria as set forth by FTSE and is meant as a broad representation of publicly traded real estate securities. Relevant real estate activities are defined as the ownership,
HFRI Monthly Indices (HFRI) are equally weighted performance indexes, compiled by Hedge Fund Research Inc. (HFX), and are used by numerous hedge fund managers as a benchmark for their own hedge funds. The HFRI are broken down into 37 different categories by strategy, including the HFRI Fund Weighted Composite, which accounts for over 2000 funds listed on the internal HFR Database. The HFRI Fund of Funds Composite Index is an equal weighted, net of
J.P. Morgan’s Global Index Research group produces proprietary index products that track emerging markets, government debt, and corporate debt asset classes. Some of these indices include the JPMorgan Emerging Market Bond Plus Index, JPMorgan Emerging Market Local Plus Index, JPMorgan Global Bond Non-US
Merrill Lynch high yield indices measure the performance of securities that pay interest in cash and have a credit rating of below investment grade. Merrill Lynch uses a composite of Fitch Ratings, Moody’s and Standard and Poor’s credit ratings in selecting bonds for these indices. These ratings measure the risk that the bond issuer will fail to pay interest or to repay principal in full. See www.ml.com for more information.
Morgan Stanley Capital International – MSCI is a series of indices constructed by Morgan Stanley to help institutional investors benchmark their returns. There
Russell Investments
S&P 500 Index consists of 500 stocks chosen for market size, liquidity and industry group representation, among other factors by the S&P Index Committee, which is a team of analysts and economists at Standard and Poor's. The S&P 500 is a market-value weighted index, which means each stock’s weight in the index is proportionate to its market value and is designed to be a leading indicator of U.S. equities, and meant to reflect the risk/return characteristics of the
Information on any indices mentioned can be obtained either through your advisor or by written request to information@feg.com.
DISCLOSURES
This report was prepared by FEG (also known as Fund Evaluation Group, LLC), a federally registered investment adviser under the Investment Advisers Act of 1940, as amended, providing non-discretionary and discretionary investment advice to its clients on an individual basis. Registration as an investment adviser does not imply a certain level of skill or training. The oral and written communications of an adviser provide you with information about which you determine to hire or retain an adviser. Fund Evaluation Group, LLC, Form ADV Part 2A & 2B can be obtained by written request directly to: Fund Evaluation Group, LLC, 201 East Fifth Street, Suite 1600, Cincinnati, OH 45202, Attention: Compliance Department.
The information herein was obtained from various sources. FEG does not guarantee the accuracy or completeness of such information provided by third parties. The information in this report is given as of the date indicated and believed to be reliable. FEG assumes no obligation to update this information, or to advise on further developments relating to it. FEG, its affiliates, directors, officers, employees, employee benefit programs and client accounts may have a long position in any securities of issuers discussed in this report.
Index performance results do not represent any managed portfolio returns. An investor cannot invest directly in a presented index, as an investment vehicle replicating an index would be required. An index does not charge management fees or brokerage expenses, and no such fees or expenses were deducted from the performance shown.
Bloomberg Index Services Limited. BLOOMBERG® is a trademark and service mark of Bloomberg Finance L.P. and its affiliates (collectively “Bloomberg”). Bloomberg or Bloomberg’s licensors own all proprietary rights in the Bloomberg Indices. Bloomberg does not approve or endorse this material or guarantee the accuracy or completeness of any information herein, nor does Bloomberg make any warranty, express or implied, as to the results to be obtained therefrom, and, to the maximum extent allowed by law, Bloomberg shall not have any liability or responsibility for injury or damages arising in connection therewith.
Neither the information nor any opinion expressed in this report constitutes an offer, or an invitation to make an offer, to buy or sell any securities.
Any return expectations provided are not intended as, and must not be regarded as, a representation, warranty or predication that the investment will achieve any particular rate of return over any particular time period or that investors will not incur losses.
Past performance is not indicative of future results.
Investments in private funds are speculative, involve a high degree of risk, and are designed for sophisticated investors.
All data is as of January 31, 2022 unless otherwise noted.