Earlier this summer, President Biden signed into law the Inflation Reduction Act (IRA) of 2022. This act allocates $369 billion for energy security and climate change with numerous investments into climate protection, including tax credits for households to offset energy costs, investments in clean energy production, and tax credits aimed at reducing carbon emissions. With this initiative, the IRA is projected to reduce total U.S. greenhouse gas emissions 40% by 2030, bringing the United States much closer to its Paris Climate Agreement emissions reduction goals.
The roughly $370 billion allocated to energy security is significant, but public dollars are not enough to address the systemic challenges of climate change and the U.S. energy infrastructure—that will require private investment as well. In fact, current estimates suggest the U.S. needs to spend $2.5 trillion by 2030 to reach zero carbon emissions by 2050.1 Recent studies suggest that by 2030, the steps outlined in the IRA could reduce U.S. net greenhouse gas emissions approximately 30-40% below 2005 levels.2
While substantial private investment is required to make up the more than $2 trillion gap between the public funding and the required funding, this challenge presents many areas of opportunity. To reach the energy and climate goals outlined in the IRA, many different issues need to be addressed, including production costs for solar and wind electricity production, energy storage and battery technology, resource extraction for lithium ion batteries, hydrogen cell production, grid resiliency, EV production, building and construction, agriculture, carbon removal, and waste recycling, just to name a few. Investments into these areas may help investors meet their double-bottom line of earning returns while also supporting an important need.
Current Environment
The trend toward renewable investment is nothing new; however, the cost structure for many forms of energy production and storage has changed considerably. Case in point is the significant decline in the cost of solar and wind power over the past 12 years. In fact, renewables are now among the cheapest forms of power generation in the world, and costs continue to fall.
COST OF RENEWABLES VS. TRADITIONAL ENERGY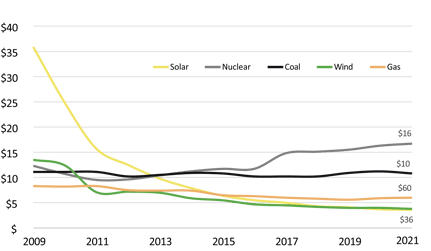
Additionally, renewables are now the second most prevalent source of electricity in the U.S., generating 834 billion kilowatt-hours of electricity, enough electricity to power 77 million homes a year.3
ANNUAL U.S. ELECTRICITY GENERATION (1950-2020)
.png?width=427&height=242&name=ANNUAL%20US%20ELECTRICITY%20GENERATION%20(1950-2020).png)
These graphs demonstrate where the trends are going in regard to renewable energy and the part it can and does play in energy independence and lowering costs to the consumer.
From an investment perspective, the potential could be compelling as public dollars via the IRA combine with private capital dollars within the renewable energy, climate mitigation, and adaptation spaces. What follows are FEG’s thoughts on the bill, its potential impacts to the investment landscape, and where the renewable energy space could go from here.
As outlined in EisnerAmper, the key takeaways for corporations and investors as it relates to ESG and sustainability are as follows:
Tax Credits for Renewable Energy
-
In an attempt to reduce greenhouse gas emissions, the IRA includes a system of tax credits for renewable energy, including the Renewable Energy Production Tax Credit, which provides tax relief for manufacturers of solar, offshore wind, geothermal, hydrogen, and nuclear power. The IRA also includes energy loans and reinvestment financing for energy-related projects.
Reduction in Carbon Emitting Industries
-
The IRA also allocated $300 million for emissions reduction and carbon capture, $2 billion to reduce emissions at shipping ports, and new tax deductions for converting existing real estate assets into high-efficiency green buildings. Additionally, the act increases the tax credit for companies that build and operate carbon capture and storage facilities. Several industries stand to benefit from these provisions, including real estate, agriculture, and shipping.
Funding for Emissions Reporting
-
The IRA reserves $5 million for the Environmental Protection Agency to support the standardization and transparency of climate disclosures at the company level. This seeks to address the demand of the ESG investor base for standardized information regarding energy efficiency and waste management.
Funding for Clean Technology
-
The IRA also offers incentives for emerging clean technologies that have struggled in the past to find funding. The long-term nature of these incentives and programs should provide the clean energy industry the stability needed to fund large-scale, longstanding projects.
Electric Vehicle Support
-
The IRA also expands tax credits for electric vehicle (EV) purchases. Prior tax considerations provided incentives to EV purchasers in the form of tax credits, but there were caps based on the number of vehicles produced, with tax credits of up to $7,500 capped at the first 200,000 vehicles sold. However, by 2018, Tesla had already sold more than 200,000 electric vehicles, which meant they had exhausted their government allowance and buyers were no longer entitled to the $7,500 credit. The IRA lifts this cap, making EV cars eligible for the subsidy again. Another point of consideration for investors is that demand for battery storage means increase demand for lithium, a positive sign for major lithium producers.
Support for Households
-
The IRA aims to reduce household energy costs by offering incentives to make homes more energy efficient through a series of tax credits and rebate programs. Direct consumer incentives to purchase electric appliances, heat pumps, rooftop solar panels, electric HVAC, EVs, and more can reduce the cost of energy and decrease utility bills while making individual investments in these areas more affordable.4
The awareness and effort to address large-scale, systemic challenges within our energy production, storage and transmission grid is welcomed and perhaps overdue. The effort to modernize and reenergize will take time, commitment on behalf of legislators, and significant investment. From this investment will come opportunity as private dollars flow in to participate in a growing industry. There is opportunity to both gain energy independence through increasing energy production locally, but also to address generational challenges surrounding climate change.
1Bloomberg Green, December 2020 “Getting US to Zero Carbon will take $2.5 Trillion”
2Larson, J., King, B., Kolus, H., Dasari, N., Hiltbrand, G., Herndon, W. (August, 2022.) A Turning Point for US Climate Progress: Assessing the Climate and Clean Energy Provisions in the Inflation Reduction Act. Rhodium Group. https://rhg.com/research/climate-clean-energy-inflation-reduction-act/
3Renewable Energy. Office of Energy Efficiency & Renewable Energy. https://www.energy.gov/eere/renewable-energy
4Barrs, D. (August, 2022.) What the Inflation Reduction Act Means for ESG and Sustainability. EisnerAmper. https://www.eisneramper.com/inflation-reduction-act-means-esg-sustainability-0822/
INDICES
The Alerian MLP Index is a composite of the 50 most prominent energy Master Limited Partnerships that provides investors with an unbiased, comprehensive benchmark for this emerging asset class.
Bloomberg Fixed Income Indices is an index family comprised of the Bloomberg US Aggregate Index, Government/Corporate Bond Index, Mortgage-Backed Securities Index, and Asset-Backed Securities Index, Municipal Index, High-Yield Index, Commodity Index and others designed to represent the broad fixed income markets and sectors. On August 24, 2016, Bloomberg acquired these long-standing assets from Barclays Bank PLC. and on August 24, 2021, they were rebranded as the Bloomberg Fixed Income Indices. See https://www.bloomberg.com/markets/rates-bonds/bloomberg-fixed-income-indices for more information..
The CBOE Volatility Index (VIX) is an up-to-the-minute market estimate of expected volatility that is calculated by using real-time S&P 500 Index option bid/ask quotes. The Index uses nearby and second nearby options with at least eight days left to expiration and then weights them to yield a constant, 30-day measure of the expected volatility of the S&P 500 Index.
FTSE Real Estate Indices (NAREIT Index and EPRA/NAREIT Index) includes only those companies that meet minimum size, liquidity and free float criteria as set forth by FTSE and is meant as a broad representation of publicly traded real estate securities. Relevant real estate activities are defined as the ownership, disposure, and development of income-producing real estate. See https://www.ftserussell.com/index/category/real-estate for more information.
HFRI Monthly Indices (HFRI) are equally weighted performance indexes, compiled by Hedge Fund Research Inc. (HFX), and are used by numerous hedge fund managers as a benchmark for their own hedge funds. The HFRI are broken down into 37 different categories by strategy, including the HFRI Fund Weighted Composite, which accounts for over 2,000 funds listed on the internal HFR Database. The HFRI Fund of Funds Composite Index is an equal weighted, net of fee, index composed of approximately 800 fund- of- funds which report to HFR. See www.hedgefundresearch.com for more information on index construction.
J.P. Morgan’s Global Index Research group produces proprietary index products that track emerging markets, government debt, and corporate debt asset classes. Some of these indices include the JPMorgan Emerging Market Bond Plus Index, JPMorgan Emerging Market Local Plus Index, JPMorgan Global Bond Non-U.S. Index and JPMorgan Global Bond Non-U.S. Index. See www.jpmorgan.com for more information.
Merrill Lynch high yield indices measure the performance of securities that pay interest in cash and have a credit rating of below investment grade. Merrill Lynch uses a composite of Fitch Ratings, Moody’s and Standard and Poor’s credit ratings in selecting bonds for these indices. These ratings measure the risk that the bond issuer will fail to pay interest or to repay principal in full. See www.ml.com for more information.
Morgan Stanley Capital International – MSCI is a series of indices constructed by Morgan Stanley to help institutional investors benchmark their returns. There are a wide range of indices created by Morgan Stanley covering a multitude of developed and emerging economies and economic sectors. See www.morganstanley.com for more information.
The FTSE Nareit All Equity REITs Index is a free-float adjusted, market capitalization-weighted index of U.S. equity REITs.
Russell Investments rank U.S. common stocks from largest to smallest market capitalization at each annual reconstitution period (May 31). The primary Russell Indices are defined as follows: 1) the top 3,000 stocks become the Russell 3000 Index, 2) the largest 1,000 stocks become the Russell 1000 Index, 3) the smallest 800 stocks in the Russell 1000 Index become the Russell Midcap index, 4) the next 2,000 stocks become the Russell 2000 Index, 5) the smallest 1,000 in the Russell 2000 Index plus the next smallest 1,000 comprise the Russell Microcap Index, and 6) U.S. Equity REITs comprise the FTSE Nareit All Equity REIT Index. See www.russell.com for more information.
S&P 500 Index consists of 500 stocks chosen for market size, liquidity and industry group representation, among other factors by the S&P Index Committee, which is a team of analysts and economists at Standard and Poor’s. The S&P 500 is a market-value weighted index, which means each stock’s weight in the index is proportionate to its market value and is designed to be a leading indicator of U.S. equities, and meant to reflect the risk/return characteristics of the large cap universe. See www.standardandpoors.com for more information.
Information on any indices mentioned can be obtained either through your advisor or by written request to information@feg.com.
DISCLOSURES
This report was prepared by FEG (also known as Fund Evaluation Group, LLC), a federally registered investment adviser under the Investment Advisers Act of 1940, as amended, providing non-discretionary and discretionary investment advice to its clients on an individual basis. Registration as an investment adviser does not imply a certain level of skill or training. The oral and written communications of an adviser provide you with information about which you determine to hire or retain an adviser. Fund Evaluation Group, LLC, Form ADV Part 2A & 2B can be obtained by written request directly to: Fund Evaluation Group, LLC, 201 East Fifth Street, Suite 1600, Cincinnati, OH 45202, Attention: Compliance Department.
The information herein was obtained from various sources. FEG does not guarantee the accuracy or completeness of such information provided by third parties. The information in this report is given as of the date indicated and believed to be reliable. FEG assumes no obligation to update this information, or to advise on further developments relating to it. FEG, its affiliates, directors, officers, employees, employee benefit programs and client accounts may have a long position in any securities of issuers discussed in this report.
Index performance results do not represent any managed portfolio returns. An investor cannot invest directly in a presented index, as an investment vehicle replicating an index would be required. An index does not charge management fees or brokerage expenses, and no such fees or expenses were deducted from the performance shown.
Bloomberg Index Services Limited. BLOOMBERG® is a trademark and service mark of Bloomberg Finance L.P. and its affiliates (collectively “Bloomberg”). Bloomberg or Bloomberg’s licensors own all proprietary rights in the Bloomberg Indices. Bloomberg does not approve or endorse this material or guarantee the accuracy or completeness of any information herein, nor does Bloomberg make any warranty, express or implied, as to the results to be obtained therefrom, and, to the maximum extent allowed by law, Bloomberg shall not have any liability or responsibility for injury or damages arising in connection therewith.
Neither the information nor any opinion expressed in this report constitutes an offer, or an invitation to make an offer, to buy or sell any securities.
Any return expectations provided are not intended as, and must not be regarded as, a representation, warranty or predication that the investment will achieve any particular rate of return over any particular time period or that investors will not incur losses.
Past performance is not indicative of future results.
Investments in private funds are speculative, involve a high degree of risk, and are designed for sophisticated investors.
All data is as of September 30, 2022 unless otherwise noted.