U.S. Private Equity Deal Activity Soars
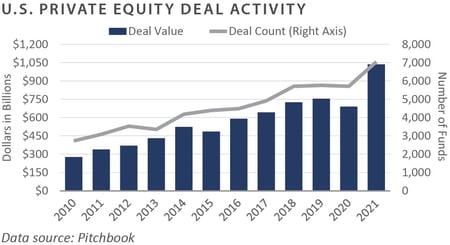
U.S. private equity deal-making has never been hotter, and in 2021, deal volume breached the trillion-dollar threshold. This new record measure was not reached by creeping past a milestone. Instead, the new record estimated by Pitchbook of $1.2 trillion is more than 60% higher than the pre-pandemic peak of $755 billion. This accomplishment is somewhat unexpected given the exhaustive list of challenges private equity firms faced last year.
A seemingly never-ending pandemic, the uncertain economy, and the potential for regulatory changes could easily have hampered deal-making activity. Yet, year-over-year deal volume grew by more than 20%, with richer deals increasing the aggregate value. What factors led to the surge in deal-making in 2021? Which sectors attracted the most capital? Is the activity likely to slow in the new year?
Factors That Influenced Deal Activity
FEG attributes last year’s record-setting deal activity to four related factors: unspent capital, accommodating credit markets, the COVID-19 pandemic, and the prospect of tax reform.
RECORD AMOUNT OF DRY POWDER
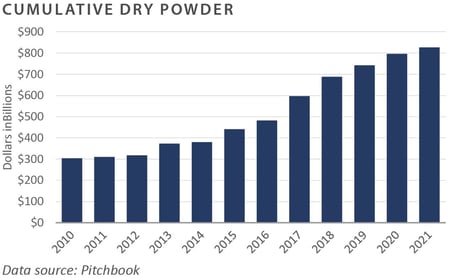
U.S. private equity firms entered the year with an unprecedented level of dry powder, or uncalled capital commitments. Midway through 2021, general partners had almost $830 billion in commitments available to be deployed, nearly double the amount from 2015, creating what FEG has called “the wall of money.” With approximately 75% of the capital overhang concentrated in fund sizes greater than $1.0 billion and less than three years old, ample opportunities exist for smaller funds to sell companies to their larger brethren.
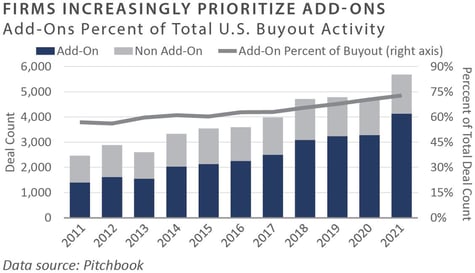
Last year, larger private equity firms could use the outstanding capital commitments to aggressively pursue transactions, particularly add-on acquisitions. According to Pitchbook, add-ons accounted for nearly three-fourths of all buyouts, as general partners focused on “buy-and-build” opportunities.
LOW INTEREST RATES
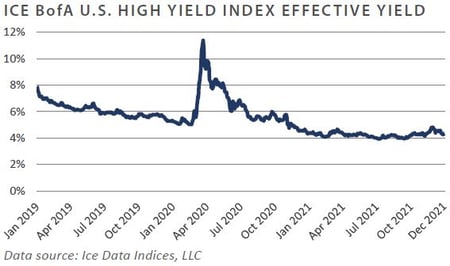
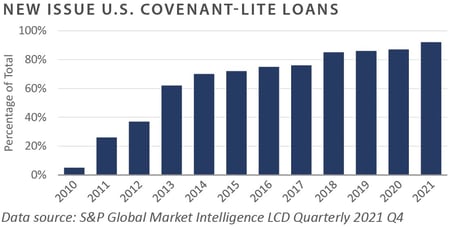
Persistently low interest rates also helped fuel private equity transaction activity in the past year. Excess liquidity, increased savings, and accommodative monetary policy contributed to abnormally low interest rates. During 2021, the effective yield on the BofA US High Yield Index ranged between 3.9% and 4.8%. At these levels, private equity firms could borrow relatively cheap debt to finance acquisitions. Further, given the increased competition among lenders, most of the private debt issuance was covenant-lite. These types of loans typically do not have maintenance requirements and are therefore considered borrower-friendly. According to S&P Global Market Intelligence, more than 90% of the new debt issuance of U.S. leveraged loans in 2021 was covenant-lite. In stark contrast, covenant-lite loans represented only 5% of the market in 2010.
THE PANDEMIC
Another reason for last year’s increased deal activity was the COVID-19 pandemic. Deal activity initially froze following the onset of the pandemic in March 2020, with both new investments and pending exits immediately tabled. During the second quarter of 2020, deal value and deal volume plummeted. Private equity firms paused new deal-making activity to reevaluate future demand as well as valuations. Ultimately, as investors became more comfortable with post-pandemic outlooks, confidence returned, and activity resumed. Private equity firms moved forward at a pace that clearly indicated a desire to make up for lost time by executing deals originally intended to be closed in the prior year.
POTENTIAL TAX REFORM
Lastly, the increase in deal activity can be attributed to concerns over an increase in taxes. When President Biden won the national election in November 2020, his administration put forth a widely publicized proposal to increase the top rate on the capital gains tax from 20% to 39.6% for those Americans earning over $1 million; however, as of the publication of this piece, the proposed changes have not occurred. Still, concerns about the potentially increased tax rate may have encouraged business owners interested in selling their businesses to accelerate their timelines to 2021.

Sectors That Attracted Capital
Business services, information technology (IT), and healthcare companies garnered the most attention—and capital—for the year. Collectively, businesses operating in these sectors accounted for more than 68% of deal value and 71% of deal volume in 2021. Many companies operating in these sectors absorbed the initial shock of the COVID-19 pandemic. Healthcare providers, software companies, warehouse and logistics providers, and others witnessed a sharp increase in demand for their essential products and services. Private equity buyers in these sectors looked for companies with variable cost structures, low capital expenditure requirements, and high levels of recurring revenues.
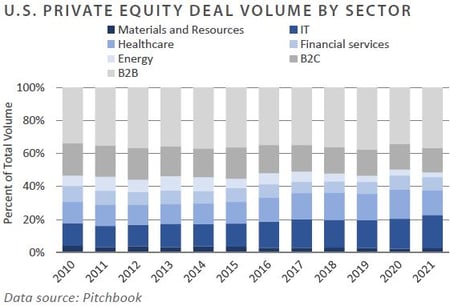
BUSINESS-TO-BUSINESS (B2B)
The business products and services sector witnessed the most activity by U.S. private equity firms in 2021. U.S. private equity firms invested more than $306 billion in the B2B space, representing nearly 30% of deal value. Though initially impacted by pandemic-related uncertainties, demand for business products and services quickly rebounded in 2021. Investors in this space were particularly attracted to companies that perform recurring operations and offer maintenance solutions, which result in stable cashflow profiles and revenue visibility. Examples include business outsource processing, specialty manufacturing, value-added distribution, infrastructure services, and others.
INFORMATION TECHNOLOGY AND SOFTWARE
The shift to a “work from home” environment combined with the overall adoption of technology-enabled solutions across nearly every business vertical resulted in robust demand, especially for software offerings. Private equity’s interest in the IT sector was largely attributed to the continued outperformance of IT and software companies. Per Pitchbook, software deals accounted for more than two-thirds of IT deal volume in 2021. During 2021, U.S. investors invested more than $233 billion across 1,411 deals in the IT space. The increase in deal activity was partially due to robust earnings and performance by enterprise software providers such as Zoom, Teladoc, and CrowdStrike. Private equity firms are likely to remain interested in the space as long as growth rates continue to exceed those of the overall economy.
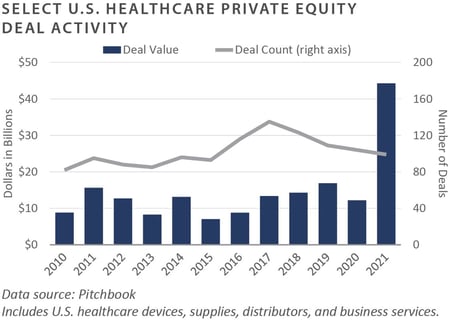
HEALTHCARE
Private equity’s interest in the healthcare sector remained healthy in 2021. In aggregate, the sector accounted for 17% of deal value and 15% of deal volume. General partners seemingly overcame any concerns about the pandemic’s impact on future healthcare spending. Private equity firms focused on companies that provide innovative and cost-effective products and services instead of provider consolidations. Areas of interest included revenue cycle management, virtual care, and medical supplies and distributors. Healthcare spending is projected to grow at an average rate of 5.5% annually over the next 10 years, escalating to more than 20% of U.S. gross domestic product (GDP). As such, U.S. private equity interest in the healthcare sector is likely to remain strong for the foreseeable future.
Looking Forward
The record level of deal activity seen in 2021 was impressive by any measure, and private equity deal-making momentum shows no signs of slowing. Long-term secular trends for sectors such as information technology and healthcare remain intact, the U.S. economy appears poised for growth, and robust fundraising markets continue to elevate dry powder. While higher interest rates are expected, the marginal increase is unlikely to dampen investment activity. As the calendar turns, FEG expects deal activity to either increase slightly or remain flat year-over-year in 2022.
Investor Implications
Despite the strong tailwinds for deal-making, FEG encourages investors to remain cautious with private capital commitments. Limited partners considering new commitments in 2022 should carefully evaluate the private equity firms’ value creation process post-investment. FEG continues to favor private equity firms with strategies that seek to generate returns from operational improvement over those managers that rely on financial engineering to achieve their stated return. Further, FEG increasingly values private equity firms comprised of experienced senior professionals who may have previously worked together during other fervent deal-making environments, as when the cycle eventually turns, those battle-tested managers with cooler heads are more likely to prevail.
Private Equity
Venture Capital
-
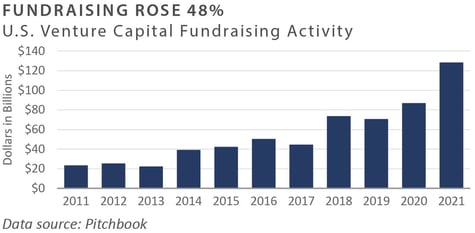
The past year was a record year for venture capital activity across nearly every metric, with the venture industry showing resiliency and growth throughout the COVID-19 pandemic.
-
U.S. venture funds raised $128 billion in 2021, a 48% increase over 2019.
-
Venture-backed companies received $330 billion in 2021, nearly double the previous record of $167 billion of capital in 2020. Investment activity increased across all stages, with sharp increases in crossover investors—hedge funds, sovereign wealth funds, etc.—and corporate venture programs.
-
Mega-deals—financing rounds of $100 million or more—rose exponentially, with last year’s count exceeding the aggregate number of mega-deals in 2018-2020.
-
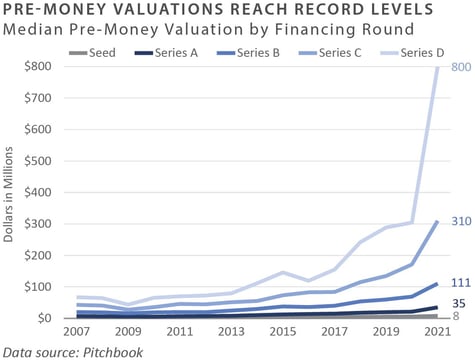
Pre-money valuations continued to rise for venture-backed companies across all stages, particularly for later-stage financings (Series C and Series D).
-
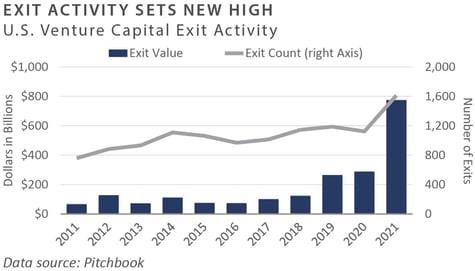
Exit activity in 2021 more than doubled that of the prior year on a value basis and saw a 40% increase in the number of exits. Venture-backed companies went public or were acquired at record levels last year.
-
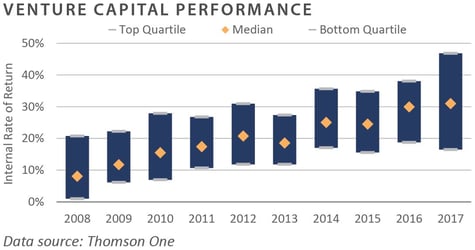
Higher valuations coupled with a record exit market also pushed venture fund performance higher, with median performance in recent years exceeding 20% internal rates of return (IRR) and top-quartile IRRs exceeding 30%.
INVESTOR IMPLICATIONS
Investors should be prepared for volatility due to the high valuations and capital flows.
Leveraged Buyouts
-
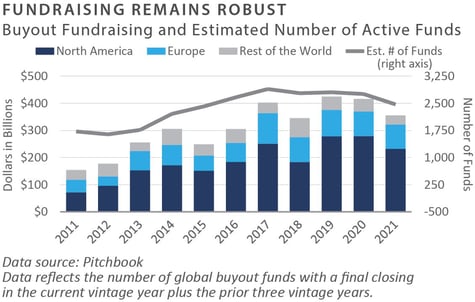
During 2021, global private equity fundraising was down roughly 15%. However, this number is skewed due to several multi-billion fundraises that carried over into 2022. In total, global leveraged buyout funds closed on roughly $355 billion of capital commitments for the year.¹ Approximately 63% of those were committed to U.S.-based private equity funds.²
-
U.S. private equity activity surged in 2021. Both value and volume were up more than 50% and 23% year-over-year.³ Add-ons accounted for more than 72% of the transaction volume for the year.⁴
-
Purchase prices remain elevated. In 2021, the median U.S. private equity buyout purchase price multiple was 13.7x earnings before interest, taxes, depreciation, and amortization (EBITDA). The median Debt/EBITDA ratio was 5.8x EBITDA.⁵
-
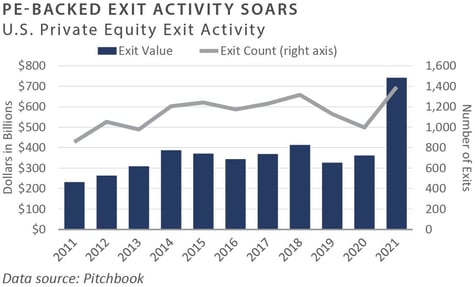
Last year, U.S. private equity exit value and volume were up 105% and 40%, respectively, from 2020.
6This shatters the previous record set in 2018. Trade sales to strategic or financial acquirers represented most of the U.S. private equity-backed exits by volume.7 -
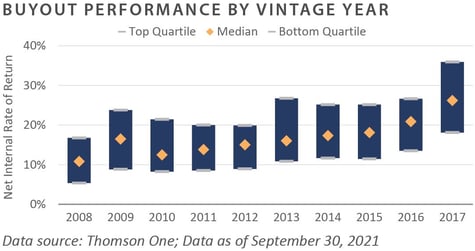
Private equity performance was strong through the third quarter of 2021. The spread between the top and bottom quartiles remained above 1,000 basis points.8
INVESTOR IMPLICATIONS
Private equity markets remain active. Deal activity, exits, and fundraising were all at robust levels for the year. Investors should remain cautious, and partner with experienced managers focused on creating value via operational improvements instead of financial engineering.
1-7 Pitchbook; Data as of December 31, 2021
8 Thomson One; Data as of September 30, 2021
Private Debt
-
The fourth quarter saw continued strength in the public credit markets. As of December 31, 2021, bank loans gained 0.8% for the quarter, and high yield bonds returned 0.7%.¹ Despite tight spreads, both sectors are in the process of delivering their coupon for 2021.
-
According to Preqin, estimated private debt assets under management reached $1.2 trillion at the end of 2021. This comes on the back of a 13.5% average annual growth rate, ahead of both private equity (11.5%) and venture capital (9.1%).²
-
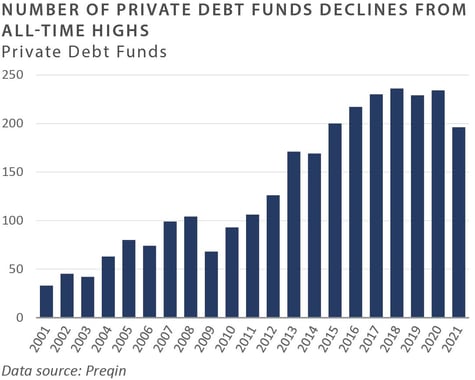
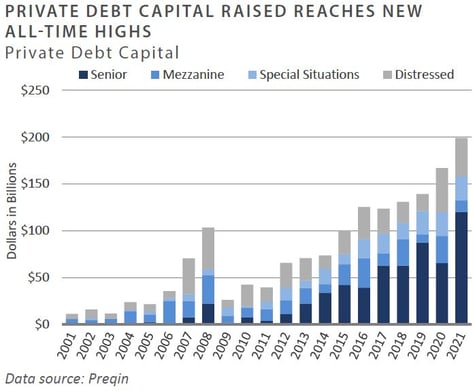
Private debt funds raised a record amount of capital in 2021, with $199.1 billion across 196 funds. The trend for the year was toward fewer but larger funds in the market.³
- Fundraising for distressed debt funds continued to moderate from 2020 levels, although the strategy still raised $40.1 billion in 2021. Investors continued to favor private senior and mezzanine debt strategies, with $132.6 billion in capital raised in 2021, 90% of which was private senior.⁴
INVESTOR IMPLICATIONS
Amid the sustained recovery in the public credit markets and increased illiquidity premium versus public market equivalents, private debt favored lenders versus distressed investors. Nevertheless, with the Federal Reserve shifting gears to remove extreme accommodation, eyes will begin to focus on the next recession and, potentially, the next distressed cycle.
1 Ice BofA US High Yield Master II Index and Credit Suisse Institutional Loan Index
2-4 Preqin Alternatives in 2022
Private Real Estate
-
The National Council of Real Estate Investment Fiduciaries (NCREIF) Property Index (NPI) posted a gain of 6.2% during the fourth quarter and returned 17.7% on a trailing 1-year basis.
-
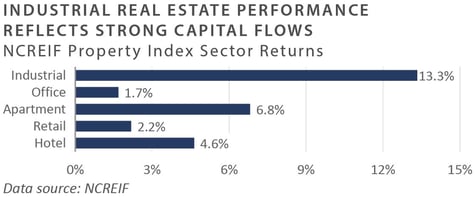
Industrial properties continued to out-perform, with a total return of 13.3% in the fourth quarter and 43% on a trailing 1-year basis. Alternatively, office properties underperformed, with a 1.7% gain for the quarter and a gain of 6.0% on a trailing 1-year basis.¹
-
According to Real Capital Analytics, commercial property sales totaled just over $800 billion in 2021, nearly double the 2020 total and above pre-pandemic levels of about $600 billion in 2019.²
-
Among major property types, apartments saw the highest transaction volume at $335 billion, followed by industrial at $166 billion. Among the most significant transactions announced during the quarter was the acquisition of data center operator Cyrus One by KKR and GIP in a $15 billion deal announced in November.³
-
Industrial and multifamily properties continue to dominate the real estate landscape in terms of demand from investors, fundamentals, and transaction volume. Single-family rental strategies are also attracting significant capital, driven by an ongoing shortage of available homes in the U.S. Apartment properties in some areas are trading at sub-4% cap rates.
-
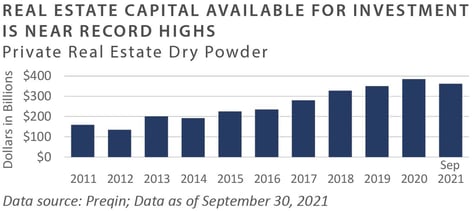
As of late 2021, more than 1,200 private real estate funds were raising funds in the market, a record high and more than double the number in the past five years. Additionally, private real estate “dry powder” was near record levels, at over $350 billion in late 2021.⁴
-
On top of the capital available for value-add, opportunistic, and core strategies, an additional $50 billion-plus from non-traded REIT vehicles was offered to high-net-worth individuals seeking yield-oriented investments. As reported by the Wall Street Journal, Blackstone’s “B-REIT” fund attracted $2 billion per month in new capital inflows during 2021, and Starwood, KKR, and Ares are raising similar funds.⁵ B-REIT funds could represent another source of competition for deals with a lower cost of capital than value-add or opportunistic real estate funds.
-
Private-label Commercial mortgage-backed security (CMBS) issuance reached $109 billion in 2021, a 95% increase over 2020 and the highest level since 2007. The issuance was indicative of the market’s liquidity, investors’ search for yield, and the relatively attractive yields offered by CMBS bonds. Single-borrower deals dominated the market, with 107 deals totaling nearly $78 billion completed in 2021, more than double the $24 billion issued in 2020.
6
INVESTOR IMPLICATIONS
Real estate–both public and private—has fully recovered from the pandemic downturn, with most property types trading at record-high valuations, reflecting solid fundamentals. This is expected to drive continued capital inflows in the coming year. The critical risk in 2022 will likely be the potential for higher interest rates, which could slow transaction volume or impact valuations. Real estate and debt markets with financing available from multiple sources should spur continued price increases for commercial real estate into 2022. There is no widespread “distressed opportunity” in real estate at this time; however, office and some retail properties have still not fully recovered to pre-pandemic levels, which points to growing competition for deals and could set the stage for lower returns in the future.
1 NCREIF; Data as of December 31, 2021
2 Grant, Peter, COVID 19 Fuels Best Ever Commercial Real Estate Sales, The Wall Street Journal, January 25, 2022
3 Bloomberg, November 15, 2021
4 Grant, Peter, Chicago Office Tower Valued at over $1.0 Billion in Purchase by Oak Hill Advisors, The Wall Street Journal, December 28, 2021
5 Stabile, Tom, Is Blackstone’s $90B Real Estate Fund an 'Outlier' or Bellwether? Fund Fire, February 2, 2022
6 Trepp CMBS Research, February 2022
Natural Resources
-
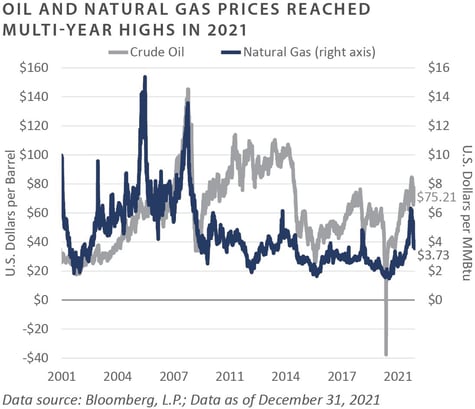
Oil prices were flat during the fourth quarter—closing at $75.21/ barrel—but rose approximately 55% for the entire year. Prices declined in late November on news of the emergence of a new COVID variant. However, they rebounded late in the year, surpassing $80/barrel in January 2022 and reaching a seven-year high. Over the year, multiple factors contributed to the rise in oil prices, including the reopening of economies from pandemic shutdowns, worries about major energy producers’ ability to ramp up output, and challenges related to the ongoing shift to renewable energy sources. Cuts in capital spending by upstream energy companies also drove concerns about potential supply gaps as demand recovers.¹
-
After a 60% gain in the third quarter, natural gas prices fell 36% in the fourth quarter to close the year at $3.37/MMBtu, down from $5.87/MMBtu at the end of the third quarter.² Warmer-than-expected weather through December created concerns about demand heading into the winter season, which weighed on prices. However, consistent underinvestment over the past seven years, coupled with increased demand for natural gas liquids from Europe and Asia, could increase prices. Additionally, as energy companies have cut back on crude oil production, there has been a decline in the “associated” natural gas and natural gas liquids produced along with oil.³
- Despite improving oil and natural gas prices, fundraising for upstream energy funds remains highly challenging, with many endowments and foundations pledging to divest of fossil fuels and unwind their private energy investments. This trend continued through 2021 and into the early part of 2022. Much of the capital being committed to private energy today is in renewables or “energy transition” strategies, and many upstream managers have pivoted to these types of offerings. Lime Rock Partners completed fundraising for its inaugural New Energy Fund at $375 million in capital commitments. Other managers have launched similar funds, suggesting that upstream energy investors will remain on the sidelines for the foreseeable future.⁴
- During the fourth quarter, the total U.S. rig count as measured by Baker Hughes increased to 586 rigs, compared to 521 rigs at the end of the third quarter and more than double the lows reached in August 2020. The U.S. natural gas rig count finished the year at 106, compared to 99 at the end of the third quarter. Finally, the U.S. oil rig count rose to 480 at the end of the fourth quarter, compared to 428 at the end of the third quarter. Notably, rig counts have not kept pace with commodity prices and remain well below the levels seen at the prior peak.⁵
INVESTOR IMPLICATIONS
The dramatic improvement in energy-related commodity prices from the lows of 2020 has thus far failed to attract capital from investors. As a result, energy remains one of the only sectors in the private equity landscape that has not seen significant inflows, creating an attractive environment for investors with capital to deploy, as competition for deals has diminished significantly. With the ongoing focus on energy transition and moves by investors to divest from fossil fuels, this will likely continue over the intermediate term. The upstream energy sector stands out as one of the few market areas characterized by limited capital availability. Meanwhile, the industry continues to right-size by paying down debt and emphasizing free cash flow generation. This stabilization is reflected in the performance of public energy stocks, with the S&P 500 Energy Sector gaining 54% throughout 2021. These trends should ultimately positively impact private equity energy and resources funds, which have underperformed over the past decade.
1, 2, 3 Energy Information Administration www.eia.gov; December 2021
4 Lime Rock Partners, Data as of December 31, 2021
5 Baker Hughes; Data as of December 31, 2021
INDICES
Bloomberg Barclays US Corporate High Yield Index represents the universe of fixed rate, non-investment grade debt. Eurobonds and debt issues from countries designated as emerging markets are excluded but, Canadian and global bonds (SEC registered) of issuers in non-EMG countries are included. The index includes the corporate sectors: Industrials, Utilities, and Finance, encompassing both US and non-US Corporations. See www.bloomberg.com for more information.
The Russell Indices are constructed by Russell Investment, There are a wide range of indices created by Russell covering companies with different market capitalizations, fundamental characteristics, and style tilts. See www.russellinvestments.com for more information.
The FTSE NAREIT Composite Index (NAREIT) includes only those companies that meet minimum size, liquidity and free float criteria as set forth by FTSE and is meant as a broad representation of publicly traded REIT securities in the U.S. Relevant real estate activities are defined as the ownership, disposure, and development of income-producing real estate. See www.ftse.com/Indices for more information. The S&P 500 Index is capitalization-weighted index of 500 stocks.
The S&P 500 Index is designed to measure performance of the broad domestic economy through changes in the aggregate market value of 500 stocks representing all major industries.
The NCREIF Property Index is a quarterly time series composite total rate of return measure of investment performance of a very large pool of individual commercial real estate properties acquired in the private market for investment purposes only.
HFRI ED: Distressed/Restructuring Index
Distressed/Restructuring strategies which employ an investment process focused on corporate fixed income instruments, primarily on corporate credit instruments of companies trading at significant discounts to their value at issuance or obliged (par value) at maturity as a result of either formal bankruptcy proceeding or financial market perception of near term proceedings. Managers are typically actively involved with the management of these companies, frequently involved on creditors' committees in negotiating the exchange of securities for alternative obligations, either swaps of debt, equity or hybrid securities. Managers employ fundamental credit processes focused on valuation and asset coverage of securities of distressed firms; in most cases portfolio exposures are concentrated in instruments which are publicly traded, in some cases actively and in others under reduced liquidity but in general for which a reasonable public market exists. In contrast to Special Situations, Distressed Strategies employ primarily debt (greater than 60%) but also may maintain related equity exposure.
Information on any indices mentioned can be obtained either through your advisor or by written request to information@feg.com.
DISCLOSURES
This report was prepared by Fund Evaluation Group, LLC (FEG), a federally registered investment adviser under the Investment Advisers Act of 1940, as amended, providing non-discretionary and discretionary investment advice to its clients on an individual basis. Registration as an investment adviser does not imply a certain level of skill or training. The oral and written communications of an adviser provide you with information about which you determine to hire or retain an adviser. Fund Evaluation Group, LLC, Form ADV Part 2A & 2B can be obtained by written request directly to: Fund Evaluation Group, LLC, 201 East Fifth Street, Suite 1600, Cincinnati, OH 45202, Attention: Compliance Department.
The information herein was obtained from various sources. FEG does not guarantee the accuracy or completeness of such information provided by third parties. The information in this report is given as of the date indicated and believed to be reliable. FEG assumes no obligation to update this information, or to advise on further developments relating to it. FEG, its affiliates, directors, officers, employees, employee benefit programs and client accounts may have a long position in any securities of issuers discussed in this report.
Index performance results do not represent any managed portfolio returns. An investor cannot invest directly in a presented index, as an investment vehicle replicating an index would be required. An index does not charge management fees or brokerage expenses, and no such fees or expenses were deducted from the performance shown.
Bloomberg Index Services Limited. BLOOMBERG® is a trademark and service mark of Bloomberg Finance L.P. and its affiliates (collectively “Bloomberg”). Bloomberg or Bloomberg’s licensors own all proprietary rights in the Bloomberg Indices. Bloomberg does not approve or endorse this material or guarantee the accuracy or completeness of any information herein, nor does Bloomberg make any warranty, express or implied, as to the results to be obtained therefrom, and, to the maximum extent allowed by law, Bloomberg shall not have any liability or responsibility for injury or damages arising in connection therewith.
Neither the information nor any opinion expressed in this report constitutes an offer, or an invitation to make an offer, to buy or sell any securities.
Any return expectations provided are not intended as, and must not be regarded as, a representation, warranty or predication that the investment will achieve any particular rate of return over any particular time period or that investors will not incur losses.
Past performance is not indicative of future results.
Investments in private funds are speculative, involve a high degree of risk, and are designed for sophisticated investors.
An investor could lose all or a substantial amount of his or her investment. Private capital funds’ fees and expenses may offset private capital funds’ profits. Private capital funds are not required to provide periodic pricing or valuation information to investors except as defined in the fund documents. Private capital funds may involve complex tax structures and delays in distributing important tax information. Private capital funds are not subject to the same regulatory requirements as mutual funds. Private capital funds are not liquid and require investors to commit to funding capital calls over a period of several years; any default on a capital call may result in substantial penalties and/or legal action. Private capital fund managers have total authority over the private capital funds. The use of a single advisor applying similar strategies could mean lack of diversification and, consequently, higher risk.
All data is as of December 31, 2021 unless otherwise noted..