Investors were confronted with many surprises throughout 2021, with positive developments including strong performance across most major risk-oriented asset classes and an ongoing global economic recovery overwhelming potential headwinds that included multi-decade-high inflation rates, several new strains of COVID-19, and a late-year initiation of quantitative easing (QE) tapering by the Federal Reserve (Fed). Risk assets, particularly those within domestic markets, shrugged off these possible volatility inducing wild cards, with many indices advancing to record high price and—in many instances—valuation levels.
Similar to the tail end of 2020, the macro backdrop investors faced in 2021 continued to reflect an overall recovering bias, as the combination of supply chain disruptions, a strengthening labor market, and continued accommodative fiscal and monetary policies helped drive inflation to the highest level since the early 1980s. Unlike the inflation that plagued the U.S. economy in the 1970s and early 1980s, however, the inflation experienced since spring 2020 has not been accompanied by a steep decline in the value of the U.S. dollar (USD), which steadily appreciated throughout 2021, particularly versus the Japanese yen and emerging market currencies.
Consistent with the theme generally in place since the Global Financial Crisis, domestic equities strongly outperformed international in 2021, particularly emerging market equities, which faced both exchange rate-related headwinds versus the USD and meaningfully poor performance from Chinese stocks on the year. Within domestic markets, large cap outpaced small cap throughout most of the year, while large cap growth companies outperformed their large cap value counterparts, a dynamic which reversed in the mid- and small cap space. Concurrent with the establishment of record new price levels across the major equity indices during the year was a marked increase in most major valuation readings, particularly among domestic large cap.
Fixed income performance in 2021 mainly favored the speculative-grade and inflation-sensitive sectors such as high yield credit, bank loans, and Treasury Inflation Protection Securities (TIPS), while the rate-sensitive corners of the market faced headwinds in the form of rising nominal interest rates and a related sharp increase in inflationary expectations. Speculative grade credit risk premiums tightened to below pre-pandemic low levels amid strong investor demand for relatively short duration credit risk.
Real assets attracted significant attention throughout the year, underpinned by the ongoing global economic recovery and the associated strong investor demand for inflation-sensitive assets. A laggard versus competing risk assets throughout most of 2020, Real Estate Investment Trusts (REITs), especially domestic, were one of the strongest major asset categories across the global investment universe in 2021, while commodities—excluding the safe-haven precious metals sector—and infrastructure also witnessed strong positive returns.
KEY MARKET THEMES AND DEVELOPMENTS
Multi-Decade High Inflation and Labor Market Recovery Signal the Fed to Begin Removing Accommodation
A mere year and a half since the depths of the COVID-19-induced recession, the Fed’s dual mandate of promoting price stability and maximum employment has called into question the need for continued pandemic-era accommodation, which previously included $120 billion of monthly asset purchases and near-zero policy rates. The Fed began its well-telegraphed initiation of QE tapering in November, which was followed by the announcement of a doubling in the pace of tapering at the Fed December policy meeting, leaving the current pace of asset purchases at $90 billion per month.
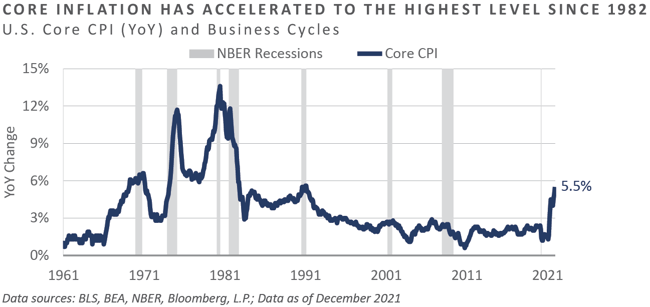
Both sides of the Fed’s dual mandate appear to confirm the need for a gradual return to a pre-pandemic monetary posture. Headline inflation, for example, has ascended to the highest level since the early 1980s, when the U.S. economy was exiting one of the most challenging inflationary episodes in the modern era. The core consumer price inflation indices, which are more relevant in policy-setting discussions, have experienced a similar recent sharp upward bias, with core CPI running 350 bps ahead of the Fed’s 2% target and at the highest rate since 1991 through the end of the year.
Factors helping to propel inflation higher in recent quarters include persistent supply chain disruptions, which appear to be abating at a stubbornly slow pace; ultra-accommodative monetary conditions, albeit becoming less so; immense fiscal support; and a labor market that continues to inch closer to achieving “maximum employment” status.
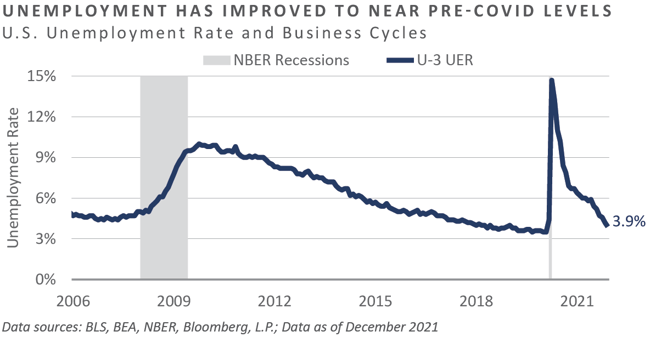
The headline unemployment rate, for example, reached a cyclical peak of 14.7% in April 2020, nearly 50% higher than the level witnessed at the depths of the Global Financial Crisis. Through the end of the year, however, this gauge had improved to a sub-4% reading, essentially matching the level witnessed before the pandemic.
The continued labor market recovery has not been without friction though. Nationwide, reports of labor shortages, employee demands for higher wages and more flexible work arrangements, irregular store hours and often closures, and a weak rebound across labor force participation have dominated the media headlines. Until the recent ruling from the U.S. Supreme Court, uncertainty surrounding the Biden administration’s vaccine-or-test mandate for larger employers also contributed to some angst among the employed populace.
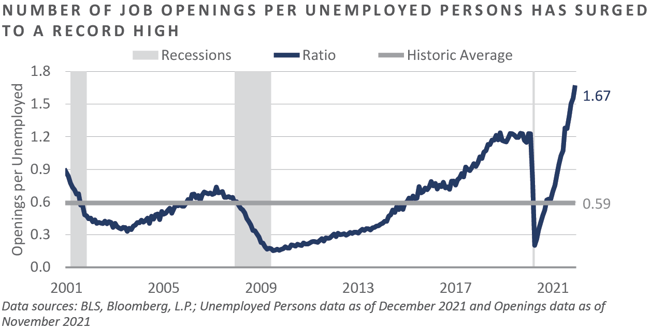
Nevertheless, despite a historically low unemployment rate, those seeking new employment have almost never been presented with such ripe hiring conditions. Not only has employee wage growth risen meaningfully in recent quarters, at least in nominal terms, the number of job openings also surged to the highest level in at least two decades during 2021.
Compared to the number of unemployed persons, which continues to sharply decline, the ratio of job openings to unemployed workers has surged to the highest reading in the history of available data, at nearly two vacant positions for every unemployed individual.
This evidence offers strong support for those favoring a reining-in of pandemic era emergency stimulus. After all, the Fed spent many years following the Global Financial Crisis attempting to spark inflation, which generally remained at or below their 2% targeted level until the COVID-19 pandemic. Now that inflation has finally arrived, the Fed is facing pressure from both market participants and the general public to act.
Moreover, calls for the Fed to get inflation under control could become even more pronounced in 2022 versus ordinary calendar years, given the confluence of ongoing societal angst around the inflation issue and the November mid-term elections.
The U.S. consumer appears to be justified in their relatively downbeat tone. Not only has inflation spiked to a 40-year high, but the ongoing threat posed by the COVID-19 Omicron variant—as well as the prospect of yet-to-be discovered variants—has increased worries the ongoing economic recovery will be plagued by a series of perpetual fits and starts.
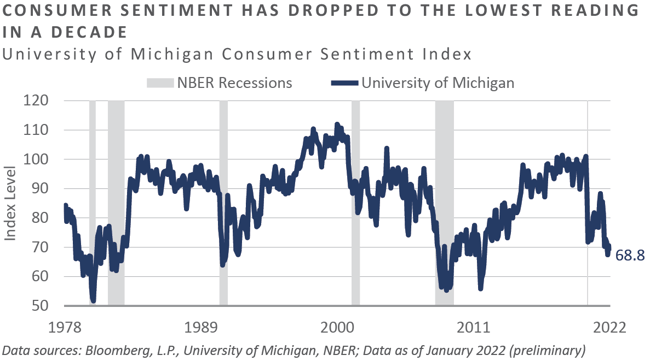
Indeed, despite near-record high price and valuation levels across most major risk sectors, near-record low policy rates, and a seemingly calm geopolitical backdrop, the U.S. consumer has not displayed this much pessimism in at least 10 years, according to the University of Michigan Consumer Sentiment Index, which deteriorated to the lowest level since 2011 in late 2021.
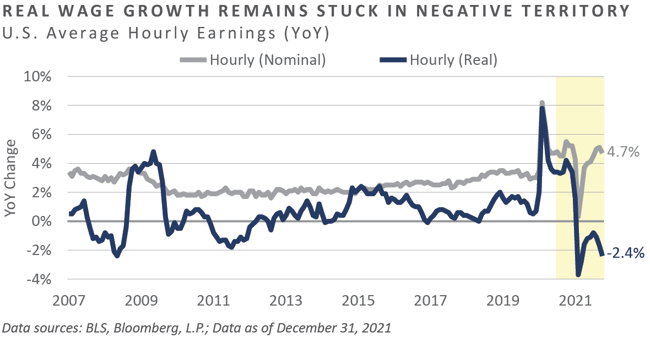
Likely eating away at consumers’ confidence in the overall state of affairs is the real-time problem of the dollar not going as far in purchasing power terms as in past years, the “regressive tax” nature of which appears to have the greatest impact on low-to-moderate income households, as they spend a relatively greater share of their income on the basic necessities such as food, energy, and housing. Through December, for example, annual inflation-adjusted wage growth stood in negative territory for the ninth consecutive month, with nominal wages growing 4.7% year-over-year, while real wage growth was -2.4% year-over-year.
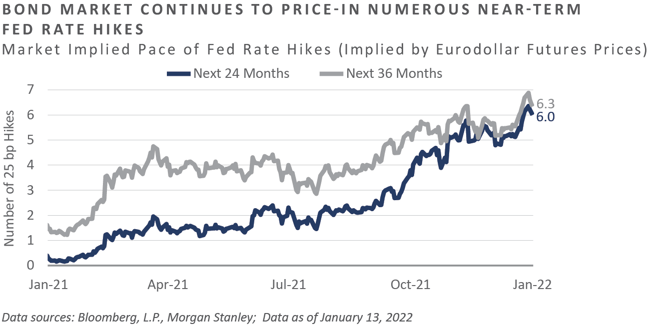
Despite a relatively pessimistic consumer, the Fed has remained steadfast in their efforts to shift the monetary gears in favor of marginally less accommodative policy in a bid to suppress the very inflationary problems that many face daily. Through the latest updates to the “dot plot” portion of their Summary of Economic Projections, the Fed has made it clear they anticipate at least three 25 basis point rate hikes to come in 2022, with the potential for three additional hikes to follow in 2023, resulting in an upper bound on the federal funds rate of 1.75%, versus today’s upper bound of 0.25%. Financial market participants appear equally hawkish on the near-term policy path, with eurodollar futures traders discounting six hikes to occur in the coming 24 months.
The Fed, like most global policymakers, appears to have arrived at a crossroads. The pressure to get inflation under control with the labor market enjoying no shortage of opportunities seemingly has dictated a hawkish path forward. The years of accommodative policy have coincided with the ascension of risky asset valuation levels to historically unprecedented levels, reflecting the inverse potential for more challenging market performance for a market that has become arguably more driven by Fed policy. The need to gain control of inflation as the economy continues to recover from the pandemic may have the Fed facing some bumps in the road as policy shifts and the markets react to a new environment.
OUTLOOK AND CONCLUDING THOUGHTS
Risk-seeking investors were generally rewarded for braving a highly uncertain market backdrop in 2021 with above-average gains—particularly for those with a domestic orientation. While macro dark clouds in the way of multi-decade high inflation, newly discovered COVID-19 strains, and the gradual removal of Fed stimulus filled the atmosphere, many risk-oriented sectors of the global investment universe increased to new highs in price and—in some instances—valuation.
The U.S. labor market recovered significantly in 2021 and inflation rates accelerated to the highest since the early-1980s, calling into question the need for continued Fed monetary stimulus. After widely advertising its plan to pare back stimulus measures, the Fed began tapering monthly Fed Treasury and agency mortgage-backed securities purchases in November. In the coming months, it appears likely the Fed will initiate the next leg of monetary tightening in the form of increases to the policy rate, which both bond market participants and the Fed expect to occur at least six times in the coming 24 months.
While an ever-present and often cliché risk to cite, the likelihood of a Fed “policy error” appears to be at the forefront of headwinds facing global asset allocators in the new year. With the U.S. political stage set to increasingly dominate the headlines through the year, the FED appears under meaningful pressure to get inflation under control in short order. Policymakers will embark on this voyage with the hopes of preventing the over-tightening of financial conditions—the error of which would likely drive risky asset volatility higher and valuation levels lower but uncover market opportunities for skilled actively-focused investment management teams to add value on behalf of their clients.
DISCLOSURES
Bloomberg Data Disclosure: Source- Bloomberg Index Services Limited. BLOOMBERG® is a trademark and service mark of Bloomberg Finance L.P. and its affiliates (collectively “Bloomberg”). Bloomberg or Bloomberg’s licensors own all proprietary rights in the Bloomberg Indices. Bloomberg does not approve or endorse this material or guarantee the accuracy or completeness of any information herein, nor does Bloomberg make any warranty, express or implied, as to the results to be obtained therefrom, and, to the maximum extent allowed by law, Bloomberg shall not have any liability or responsibility for injury or damages arising in connection therewith.
This report was prepared by Fund Evaluation Group, LLC (FEG), a federally registered investment adviser under the Investment Advisers Act of 1940, as amended, providing non-discretionary and discretionary investment advice to its clients on an individual basis. Registration as an investment adviser does not imply a certain level of skill or training. The oral and written communications of an adviser provide you with information about which you determine to hire or retain an adviser. Fund Evaluation Group, LLC, Form ADV Part 2A & 2B can be obtained by written request directed to: Fund Evaluation Group, LLC, 201 East Fifth Street, Suite 1600, Cincinnati, OH 45202 Attention: Compliance Department.
The information herein was obtained from various sources. FEG does not guarantee the accuracy or completeness of such information provided by third parties. The information in this report is given as of the date indicated and believed to be reliable. FEG assumes no obligation to update this information, or to advise on further developments relating to it. FEG, its affiliates, directors, officers, employees, employee benefit programs and client accounts may have a long position in any securities of issuers discussed in this report.
Diversification or Asset Allocation does not assure or guarantee better performance and cannot eliminate the risk of investment loss.
Index performance results do not represent any managed portfolio returns. An investor cannot invest directly in a presented index, as an investment vehicle replicating an index would be required. An index does not charge management fees or brokerage expenses, and no such fees or expenses were deducted from the performance shown.
Neither the information nor any opinion expressed in this report constitutes an offer, or an invitation to make an offer, to buy or sell any securities.
Any return expectations provided are not intended as, and must not be regarded as, a representation, warranty or predication that the investment will achieve any particular rate of return over any particular time period or that investors will not incur losses.
Past performance is not indicative of future results.
This report is intended for informational purposes only. It does not address specific investment objectives, or the financial situation and the particular needs of any person who may receive this report.
Published January 2022
INDICES
The Alerian MLP Index is a composite of the 50 most prominent energy Master Limited Partnerships that provides investors with an unbiased, comprehensive benchmark for this emerging asset class.
The Bloomberg Barclays Capital Aggregate Bond Index is a benchmark index made up of the Barclays Capital Government/Corporate Bond Index, Mortgage‐Backed Securities Index, and Asset‐Backed Securities Index, including securities that are of investment‐grade quality or better, have at least one year to maturity, and have an outstanding par value of at least $100 million.
The HFRI Monthly Indices (HFRI) are equally weighted performance indexes, compiled by Hedge Fund Research Inc., and are utilized by numerous hedge fund managers as a benchmark for their own hedge funds. The HFRI are broken down into 37 different categories by strategy, including the HFRI Fund Weighted Composite, which accounts for over 2000 funds listed on the internal HFR Database. The HFRI Fund of Funds Composite Index is an equal weighted, net of fee, index composed of approximately 800 fund of funds which report to HFR. See www.hedgefundresearch.com for more information on index construction.
The MSCI ACWI (All Country World Index) Index is a free float-adjusted market capitalization weighted index that is designed to measure the equity market performance of developed and emerging markets. The MSCI ACWI consists of 46 country indexes comprising 23 developed and 23 emerging market country indexes. The developed market country indexes included are: Australia, Austria, Belgium, Canada, Denmark, Finland, France, Germany, Hong Kong, Ireland, Israel, Italy, Japan, Netherlands, New Zealand, Norway, Portugal, Singapore, Spain, Sweden, Switzerland, the United Kingdom and the United States. The emerging market country indexes included are: Brazil, Chile, China, Colombia, Czech Republic, Egypt, Greece, Hungary, India, Indonesia, Korea, Malaysia, Mexico, Peru, Philippines, Poland, Qatar, Russia, South Africa, Taiwan, Thailand, Turkey* and United Arab Emirates.
The S&P 500 Index is a capitalization-weighted index of 500 stocks. The S&P 500 Index is designed to measure performance of the broad domestic economy through changes in the aggregate market value of 500 stocks representing all major industries.
Information on any indices mentioned can be obtained either through your advisor or by written request to information@feg.com.
Market Commentary: Fourth Quarter 2021
Investors were confronted with many surprises throughout 2021, with positive developments including strong performance across most major risk-oriented asset classes and an ongoing global economic recovery overwhelming potential headwinds that included multi-decade-high inflation rates, several new strains of COVID-19, and a late-year initiation of quantitative easing (QE) tapering by the Federal Reserve (Fed). Risk assets, particularly those within domestic markets, shrugged off these possible volatility inducing wild cards, with many indices advancing to record high price and—in many instances—valuation levels.
Similar to the tail end of 2020, the macro backdrop investors faced in 2021 continued to reflect an overall recovering bias, as the combination of supply chain disruptions, a strengthening labor market, and continued accommodative fiscal and monetary policies helped drive inflation to the highest level since the early 1980s. Unlike the inflation that plagued the U.S. economy in the 1970s and early 1980s, however, the inflation experienced since spring 2020 has not been accompanied by a steep decline in the value of the U.S. dollar (USD), which steadily appreciated throughout 2021, particularly versus the Japanese yen and emerging market currencies.
Consistent with the theme generally in place since the Global Financial Crisis, domestic equities strongly outperformed international in 2021, particularly emerging market equities, which faced both exchange rate-related headwinds versus the USD and meaningfully poor performance from Chinese stocks on the year. Within domestic markets, large cap outpaced small cap throughout most of the year, while large cap growth companies outperformed their large cap value counterparts, a dynamic which reversed in the mid- and small cap space. Concurrent with the establishment of record new price levels across the major equity indices during the year was a marked increase in most major valuation readings, particularly among domestic large cap.
Fixed income performance in 2021 mainly favored the speculative-grade and inflation-sensitive sectors such as high yield credit, bank loans, and Treasury Inflation Protection Securities (TIPS), while the rate-sensitive corners of the market faced headwinds in the form of rising nominal interest rates and a related sharp increase in inflationary expectations. Speculative grade credit risk premiums tightened to below pre-pandemic low levels amid strong investor demand for relatively short duration credit risk.
Real assets attracted significant attention throughout the year, underpinned by the ongoing global economic recovery and the associated strong investor demand for inflation-sensitive assets. A laggard versus competing risk assets throughout most of 2020, Real Estate Investment Trusts (REITs), especially domestic, were one of the strongest major asset categories across the global investment universe in 2021, while commodities—excluding the safe-haven precious metals sector—and infrastructure also witnessed strong positive returns.
KEY MARKET THEMES AND DEVELOPMENTS
Multi-Decade High Inflation and Labor Market Recovery Signal the Fed to Begin Removing Accommodation
A mere year and a half since the depths of the COVID-19-induced recession, the Fed’s dual mandate of promoting price stability and maximum employment has called into question the need for continued pandemic-era accommodation, which previously included $120 billion of monthly asset purchases and near-zero policy rates. The Fed began its well-telegraphed initiation of QE tapering in November, which was followed by the announcement of a doubling in the pace of tapering at the Fed December policy meeting, leaving the current pace of asset purchases at $90 billion per month.
Both sides of the Fed’s dual mandate appear to confirm the need for a gradual return to a pre-pandemic monetary posture. Headline inflation, for example, has ascended to the highest level since the early 1980s, when the U.S. economy was exiting one of the most challenging inflationary episodes in the modern era. The core consumer price inflation indices, which are more relevant in policy-setting discussions, have experienced a similar recent sharp upward bias, with core CPI running 350 bps ahead of the Fed’s 2% target and at the highest rate since 1991 through the end of the year.
Factors helping to propel inflation higher in recent quarters include persistent supply chain disruptions, which appear to be abating at a stubbornly slow pace; ultra-accommodative monetary conditions, albeit becoming less so; immense fiscal support; and a labor market that continues to inch closer to achieving “maximum employment” status.
The headline unemployment rate, for example, reached a cyclical peak of 14.7% in April 2020, nearly 50% higher than the level witnessed at the depths of the Global Financial Crisis. Through the end of the year, however, this gauge had improved to a sub-4% reading, essentially matching the level witnessed before the pandemic.
The continued labor market recovery has not been without friction though. Nationwide, reports of labor shortages, employee demands for higher wages and more flexible work arrangements, irregular store hours and often closures, and a weak rebound across labor force participation have dominated the media headlines. Until the recent ruling from the U.S. Supreme Court, uncertainty surrounding the Biden administration’s vaccine-or-test mandate for larger employers also contributed to some angst among the employed populace.
Nevertheless, despite a historically low unemployment rate, those seeking new employment have almost never been presented with such ripe hiring conditions. Not only has employee wage growth risen meaningfully in recent quarters, at least in nominal terms, the number of job openings also surged to the highest level in at least two decades during 2021.
Compared to the number of unemployed persons, which continues to sharply decline, the ratio of job openings to unemployed workers has surged to the highest reading in the history of available data, at nearly two vacant positions for every unemployed individual.
This evidence offers strong support for those favoring a reining-in of pandemic era emergency stimulus. After all, the Fed spent many years following the Global Financial Crisis attempting to spark inflation, which generally remained at or below their 2% targeted level until the COVID-19 pandemic. Now that inflation has finally arrived, the Fed is facing pressure from both market participants and the general public to act.
Moreover, calls for the Fed to get inflation under control could become even more pronounced in 2022 versus ordinary calendar years, given the confluence of ongoing societal angst around the inflation issue and the November mid-term elections.
The U.S. consumer appears to be justified in their relatively downbeat tone. Not only has inflation spiked to a 40-year high, but the ongoing threat posed by the COVID-19 Omicron variant—as well as the prospect of yet-to-be discovered variants—has increased worries the ongoing economic recovery will be plagued by a series of perpetual fits and starts.
Indeed, despite near-record high price and valuation levels across most major risk sectors, near-record low policy rates, and a seemingly calm geopolitical backdrop, the U.S. consumer has not displayed this much pessimism in at least 10 years, according to the University of Michigan Consumer Sentiment Index, which deteriorated to the lowest level since 2011 in late 2021.
Likely eating away at consumers’ confidence in the overall state of affairs is the real-time problem of the dollar not going as far in purchasing power terms as in past years, the “regressive tax” nature of which appears to have the greatest impact on low-to-moderate income households, as they spend a relatively greater share of their income on the basic necessities such as food, energy, and housing. Through December, for example, annual inflation-adjusted wage growth stood in negative territory for the ninth consecutive month, with nominal wages growing 4.7% year-over-year, while real wage growth was -2.4% year-over-year.
Despite a relatively pessimistic consumer, the Fed has remained steadfast in their efforts to shift the monetary gears in favor of marginally less accommodative policy in a bid to suppress the very inflationary problems that many face daily. Through the latest updates to the “dot plot” portion of their Summary of Economic Projections, the Fed has made it clear they anticipate at least three 25 basis point rate hikes to come in 2022, with the potential for three additional hikes to follow in 2023, resulting in an upper bound on the federal funds rate of 1.75%, versus today’s upper bound of 0.25%. Financial market participants appear equally hawkish on the near-term policy path, with eurodollar futures traders discounting six hikes to occur in the coming 24 months.
The Fed, like most global policymakers, appears to have arrived at a crossroads. The pressure to get inflation under control with the labor market enjoying no shortage of opportunities seemingly has dictated a hawkish path forward. The years of accommodative policy have coincided with the ascension of risky asset valuation levels to historically unprecedented levels, reflecting the inverse potential for more challenging market performance for a market that has become arguably more driven by Fed policy. The need to gain control of inflation as the economy continues to recover from the pandemic may have the Fed facing some bumps in the road as policy shifts and the markets react to a new environment.
OUTLOOK AND CONCLUDING THOUGHTS
Risk-seeking investors were generally rewarded for braving a highly uncertain market backdrop in 2021 with above-average gains—particularly for those with a domestic orientation. While macro dark clouds in the way of multi-decade high inflation, newly discovered COVID-19 strains, and the gradual removal of Fed stimulus filled the atmosphere, many risk-oriented sectors of the global investment universe increased to new highs in price and—in some instances—valuation.
The U.S. labor market recovered significantly in 2021 and inflation rates accelerated to the highest since the early-1980s, calling into question the need for continued Fed monetary stimulus. After widely advertising its plan to pare back stimulus measures, the Fed began tapering monthly Fed Treasury and agency mortgage-backed securities purchases in November. In the coming months, it appears likely the Fed will initiate the next leg of monetary tightening in the form of increases to the policy rate, which both bond market participants and the Fed expect to occur at least six times in the coming 24 months.
While an ever-present and often cliché risk to cite, the likelihood of a Fed “policy error” appears to be at the forefront of headwinds facing global asset allocators in the new year. With the U.S. political stage set to increasingly dominate the headlines through the year, the FED appears under meaningful pressure to get inflation under control in short order. Policymakers will embark on this voyage with the hopes of preventing the over-tightening of financial conditions—the error of which would likely drive risky asset volatility higher and valuation levels lower but uncover market opportunities for skilled actively-focused investment management teams to add value on behalf of their clients.
DISCLOSURES
Bloomberg Data Disclosure: Source- Bloomberg Index Services Limited. BLOOMBERG® is a trademark and service mark of Bloomberg Finance L.P. and its affiliates (collectively “Bloomberg”). Bloomberg or Bloomberg’s licensors own all proprietary rights in the Bloomberg Indices. Bloomberg does not approve or endorse this material or guarantee the accuracy or completeness of any information herein, nor does Bloomberg make any warranty, express or implied, as to the results to be obtained therefrom, and, to the maximum extent allowed by law, Bloomberg shall not have any liability or responsibility for injury or damages arising in connection therewith.
This report was prepared by Fund Evaluation Group, LLC (FEG), a federally registered investment adviser under the Investment Advisers Act of 1940, as amended, providing non-discretionary and discretionary investment advice to its clients on an individual basis. Registration as an investment adviser does not imply a certain level of skill or training. The oral and written communications of an adviser provide you with information about which you determine to hire or retain an adviser. Fund Evaluation Group, LLC, Form ADV Part 2A & 2B can be obtained by written request directed to: Fund Evaluation Group, LLC, 201 East Fifth Street, Suite 1600, Cincinnati, OH 45202 Attention: Compliance Department.
The information herein was obtained from various sources. FEG does not guarantee the accuracy or completeness of such information provided by third parties. The information in this report is given as of the date indicated and believed to be reliable. FEG assumes no obligation to update this information, or to advise on further developments relating to it. FEG, its affiliates, directors, officers, employees, employee benefit programs and client accounts may have a long position in any securities of issuers discussed in this report.
Diversification or Asset Allocation does not assure or guarantee better performance and cannot eliminate the risk of investment loss.
Index performance results do not represent any managed portfolio returns. An investor cannot invest directly in a presented index, as an investment vehicle replicating an index would be required. An index does not charge management fees or brokerage expenses, and no such fees or expenses were deducted from the performance shown.
Neither the information nor any opinion expressed in this report constitutes an offer, or an invitation to make an offer, to buy or sell any securities.
Any return expectations provided are not intended as, and must not be regarded as, a representation, warranty or predication that the investment will achieve any particular rate of return over any particular time period or that investors will not incur losses.
Past performance is not indicative of future results.
This report is intended for informational purposes only. It does not address specific investment objectives, or the financial situation and the particular needs of any person who may receive this report.
Published January 2022
INDICES
The Alerian MLP Index is a composite of the 50 most prominent energy Master Limited Partnerships that provides investors with an unbiased, comprehensive benchmark for this emerging asset class.
The Bloomberg Barclays Capital Aggregate Bond Index is a benchmark index made up of the Barclays Capital Government/Corporate Bond Index, Mortgage‐Backed Securities Index, and Asset‐Backed Securities Index, including securities that are of investment‐grade quality or better, have at least one year to maturity, and have an outstanding par value of at least $100 million.
The HFRI Monthly Indices (HFRI) are equally weighted performance indexes, compiled by Hedge Fund Research Inc., and are utilized by numerous hedge fund managers as a benchmark for their own hedge funds. The HFRI are broken down into 37 different categories by strategy, including the HFRI Fund Weighted Composite, which accounts for over 2000 funds listed on the internal HFR Database. The HFRI Fund of Funds Composite Index is an equal weighted, net of fee, index composed of approximately 800 fund of funds which report to HFR. See www.hedgefundresearch.com for more information on index construction.
The MSCI ACWI (All Country World Index) Index is a free float-adjusted market capitalization weighted index that is designed to measure the equity market performance of developed and emerging markets. The MSCI ACWI consists of 46 country indexes comprising 23 developed and 23 emerging market country indexes. The developed market country indexes included are: Australia, Austria, Belgium, Canada, Denmark, Finland, France, Germany, Hong Kong, Ireland, Israel, Italy, Japan, Netherlands, New Zealand, Norway, Portugal, Singapore, Spain, Sweden, Switzerland, the United Kingdom and the United States. The emerging market country indexes included are: Brazil, Chile, China, Colombia, Czech Republic, Egypt, Greece, Hungary, India, Indonesia, Korea, Malaysia, Mexico, Peru, Philippines, Poland, Qatar, Russia, South Africa, Taiwan, Thailand, Turkey* and United Arab Emirates.
The S&P 500 Index is a capitalization-weighted index of 500 stocks. The S&P 500 Index is designed to measure performance of the broad domestic economy through changes in the aggregate market value of 500 stocks representing all major industries.
Information on any indices mentioned can be obtained either through your advisor or by written request to information@feg.com.
Recent posts
Subscribe to blog