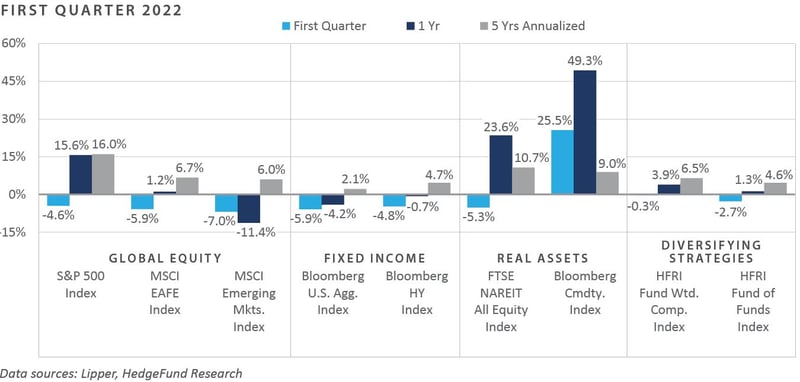
Multi-decade high inflation, the interest rate liftoff by the Federal Reserve (Fed), sharply rising energy prices, and Russia’s invasion of Ukraine were a few of the key drivers behind the spike in volatility across the financial markets in the first quarter of 2022. Despite a general sense of unease, the month of March presented global asset allocators with performance gains across most major domestic equity and real assets sectors, while bond returns continued to face headwinds in the way of rising interest rates. For the quarter, domestic equities outperformed international—particularly emerging markets—and large cap relatively outperformed small cap. Stylistically, value strongly outperformed growth, buoyed by a 39% return for the S&P 500 Energy Sector Total Return Index—the strongest quarterly performance by the energy sub-index since the index’s inception in 1989. Fixed income performance, particularly among rate-sensitive sectors, struggled throughout the quarter as persistent inflationary pressures and an expected steep Fed policy path discounted by the bond market helped send interest rates higher. Performance across real assets continued to appear robust, especially among the energy-related corners of the universe. At the same time, REIT returns were pressured lower by the sharp rise in Treasury rates and the renewed potential for an economic slowdown.
Economic Update
Treasury Yield Curve Inverts, Sparking Slowdown and Fed Policy Error Concerns
Several macro and geopolitical forces helped drive financial market volatility higher in the first quarter, with macro factors such as Fed tightening, persistent inflationary pressures, and a historically tight labor market taking a brief backseat to the vast humanitarian crisis associated with Russia’s invasion of Ukraine in late February.
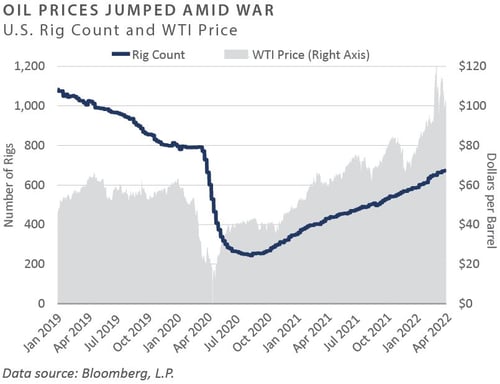
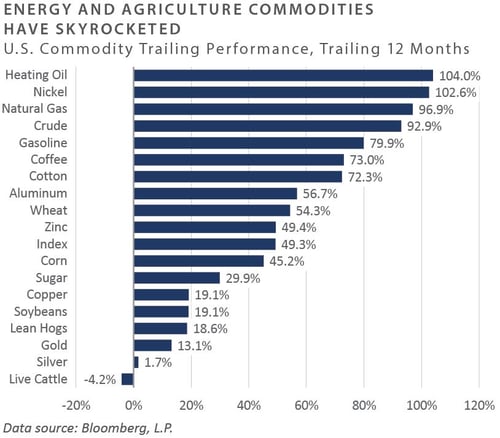
The inflationary issue that has plagued the U.S. economy over the trailing year appears at risk of escaping policymakers’ control, given the recent introduction of energy supply disruptions across Europe stemming from the war in Ukraine. For example, crude oil spot prices (WTI) surged more than 30% during the quarter, reaching as high as $124 per barrel in early March before settling modestly lower to conclude the quarter at $100.28. Natural gas spot prices witnessed similar upward pressure and gained more than 50% in the quarter.
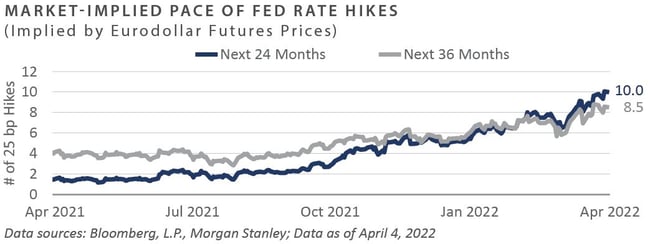
Soaring energy costs and their ultimate transmission into headline inflation measures in the coming months have put policymakers in a challenging position. To contain ongoing inflationary pressures, the Fed initiated “liftoff” from the zero-bound policy rate level in March and signaled at least six 25 basis point increases to the policy rate throughout the year. Market-implied measures of the Fed’s expected policy path reflect this hawkish sentiment; at the time of publication, ten 25 basis point rate hikes have been discounted by the Eurodollar futures market over the coming 24-month period.
The steep anticipated Fed policy path, paired with the Fed’s guidance at their March meeting indicating $95 million of balance sheet runoff expected to begin in May, represents a pivotal shift in monetary policy from an ultra-accommodative stance to one incrementally less so. While consumer balance sheets have recovered significantly since the spring 2020 downturn, the continued inflationary impulse has dented consumer confidence, which slumped to an 11-year low during the quarter, as measured by the University of Michigan’s Consumer Sentiment Index.
The Fed’s deliberate tempering of inflationary pressures through higher interest rates could ease rising cost pressures over the near term. Still, it might come at the expense of a slowdown in business activity and a rise in risk premiums, particularly among the frothier corners of the investment landscape. Moreover, the Fed has initiated a tightening campaign when much of the Treasury yield curve beyond the 2-year maturity portion appears flat or inverted, which has been historically reflective of pre-recession conditions. The widely referenced spread between 2-year and 10-year Treasury notes inverted at the tail end of the quarter and into the early trading days of April, which may indicate the Fed left financial conditions excessively easy for an extended period and now must tighten policy aggressively or run the risk of getting too far behind the curve.
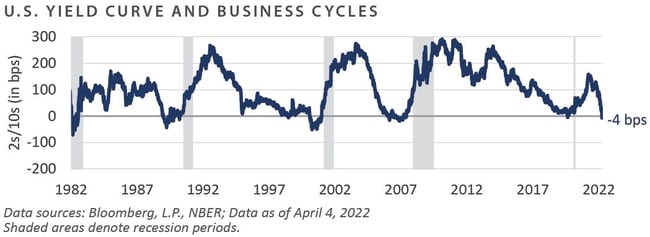
However, a flat term structure represents a significant problem for the Fed, as tightening campaigns have historically served to flatten the yield curve further. With both the Fed and the bond market positioned for a substantially higher policy rate in the coming quarters, the margin of error for the Fed appears uncomfortably slim.
In conclusion, both the equity and fixed income markets posted broad-based losses in the first quarter, with performance headwinds stemming from sharply rising inflation, energy prices, and interest rates colliding with the initiation of the Fed’s tightening campaign and the outbreak of war in Eastern Europe. While the financial markets appear to have regained some footing in recent weeks, ongoing inflationary pressures and a historically tight labor market have driven sentiment for tighter financial conditions meaningfully higher, with a flat yield curve and continued elevated risky asset valuations serving as complicating factors in the Fed’s attempts to get inflation under control without risking tripping the economy into recession.
Market Returns
Global Equity
-
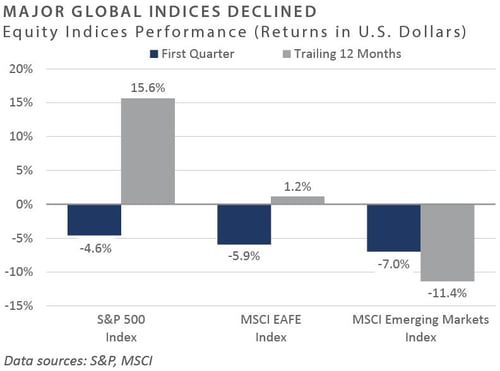
The first quarter was defined by volatility among most major equity markets. Investors faced headwinds from nearly every facet of global market drivers during the first quarter of 2022 after a solid ending to 2021. Inflation, geopolitical risks due to the war in Ukraine, and central bank action were just a few significant events behind investors' concerns.
-
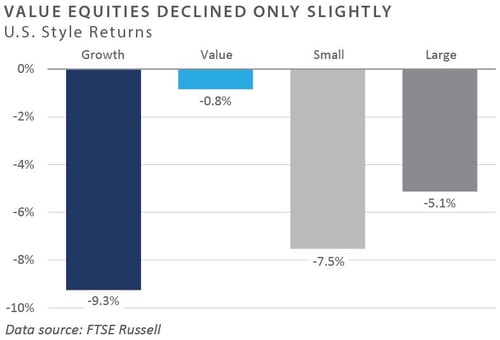
U.S. value equities outperformed growth equities during the quarter as the rising rate environment has put pressure on long-duration assets with historically high valuations. Additionally, the Russian-Ukrainian conflict has placed tremendous upward pressure on energy prices, which boosted stocks in the energy sector and aided value indices. Large cap domestic equities outperformed small cap equities during the quarter as investors assessed company fundamentals, potential capital access, and debt servicing risks facing small companies.
-
Although returns were negative, developed market equities outperformed emerging market equities during the quarter. In addition to Russia’s attack on Ukraine weighing on the emerging market index, a resurgence of COVID-19 in China and the nation’s lockdown and quarantine response increased concerns of reduced economic activity in the country and further supply chain delays globally.
-
Energy price spikes were felt heavily throughout Europe, and the price increases serve as a headwind to economic growth. However, the magnitude of that impact remains to be seen. European economic data has been generally positive—e.g., a strong labor market, fiscal stimulus, and accumulated personal savings during COVID-19 lockdowns—which could help mitigate the impact of increased energy prices and possible rationing throughout the region. The United Kingdom is less reliant on Russian energy than many of its continental neighbors but has higher gas and oil consumption. As such, the UK announced a rebate program to provide support to households facing increased energy prices.
-
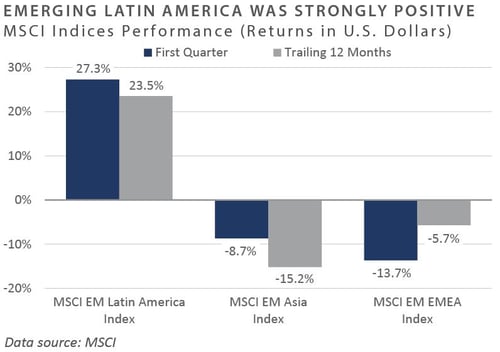
Latin America was among the best-performing regions within emerging markets, predominately driven by the performance of the Brazilian and Mexican markets, which have both seen tailwinds due to increased energy demand and nearshoring of production.
Fixed Income
-
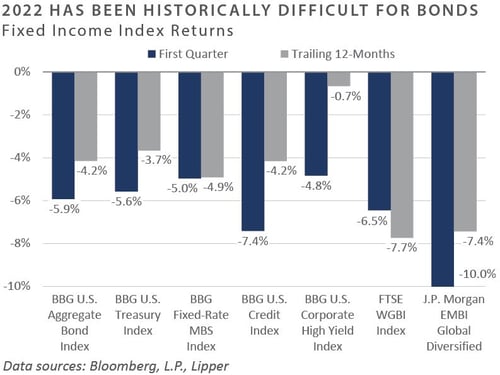
Rate-sensitive bonds remained under pressure as inflation, and a tight labor market stoked hawkish Fed language. The 2-year U.S. Treasury yield rose a staggering 155 bps to 2.28% during the quarter, nearly overtaking the 10-year U.S. Treasury yield, which rose 80 bps to 2.32%.
-
The 10-year/2-year Treasury spread garnered investor intention as the curve flattened and then inverted on an intraday basis. The bellwether metric plummeted 75 bps as the front end of the yield curve priced in hawkish Fed policy. The Fed’s Summary of Economic Projections from their March meeting pointed towards a policy rate of 1.9%, a full percentage point above their December estimate. Post-meeting, the market priced in successive 50 bps hikes in May and June. Notably, sell-side firms, such as Citi, are calling for three to four 50 bps hikes for the remainder of 2022.
-
February’s CPI release saw headline and core prints of 7.9% and 6.4%, respectively, on a year-over-year basis. Consumer balance sheets, which have been a bright spot since the onset of COVID-19, are beginning to bow under inflationary pressures. February’s Personal Savings Rate read was 6.3%, falling below its 10-year average of 8.7% and post-COVID-19 rate of 14.0%.
-
Corporate credit came under pressure as spreads widened and rates rose. Leveraged loans fared much better than high yield as loans’ shorter duration profile and floating-rate coupons insulated them from rising rates. IG and HY spreads reached their widest levels in over a year before retreating as risk appetite reentered the bond market. IG spreads widened 53 bps to 1.45% and finished at 1.16%. More volatile HY spreads rose 111 bps to 4.21% before falling to 3.43% as of quarter-end.
-
Securitized sectors were not immune to the risk-off environment during the first quarter. ABS, investment-grade CMBS, and MBS pass-throughs were down -2.9%, -5.6%, and -5.0%, respectively. Unlike other spread sectors, the CMBS new issue market was extremely active, with the first quarter seeing the highest quarterly issuance since before the Great Financial Crisis. Conduit new issuance reached $10.3 billion while single-asset single-borrower new issuance totaled $18.7 billion, up 72% and 82% year-over-year, respectively. Below investment grade securities outperformed the top of the capital structure as the need for deals to close to fund transactions was juxtaposed against a spread widening environment.
Real Assets
REAL ESTATE
-
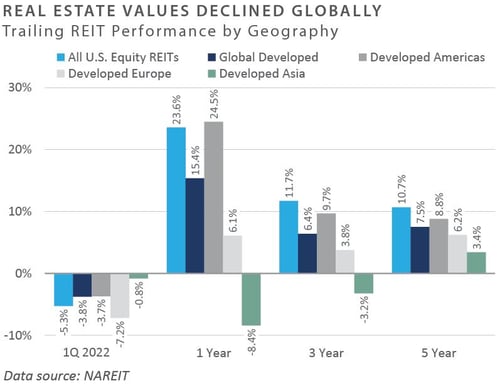
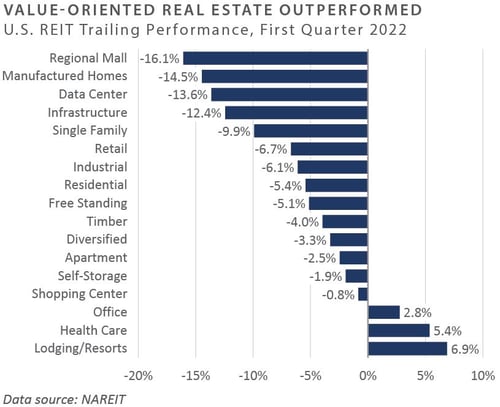
Publicly traded real estate securities (REITs) declined in the first quarter on concerns related to the potential impact of higher interest rates on real estate values. Nearly all REIT sectors posted negative returns for the quarter, with data centers, infrastructure (cell towers), and regional malls under-performing the benchmark. Lodging, health care, and office REITs were the lone sectors to post positive performance. As of the end of the first quarter, the yield on REITs stood at 2.9%.
-
Similar to the broader market, REITs saw a rotation into value-oriented sectors, with the lodging and office sectors outperforming for the quarter. These property types underperformed over the past year due to concerns about the impact of COVID-19 and its emerging variants on occupancy levels. During the quarter, however, hotels benefited partly from their potential to offer an inflation hedge due to their ability to reset rates daily. After poor performance during the pandemic, office REITs showed attractive valuations compared to other sectors.
NATURAL RESOURCES
-
Oil and natural gas prices rose to multi-year highs during the first quarter; energy was the top-performing sector in the S&P 500 with a gain of 39%. Oil ended the quarter at $100/barrel, up 33% from year-end 2021, driven by tighter supplies, recovering demand, and U.S. sanctions against Russian oil following Russia’s invasion of Ukraine.
-
Natural gas prices rose 58% during the first quarter to close at $5.64/MMBtu. Colder winter weather and the geopolitical situation in Europe were the key factors contributing to higher natural gas prices. Europe remains heavily reliant on Russian oil and natural gas imports and is struggling to secure gas from other sources as it seeks to reduce Russian imports.
-
Higher oil prices contributed to elevated gasoline prices, with the average cost of gas in the U.S. rising 37% in the first quarter. The Biden administration responded by announcing the largest-ever release from the Strategic Petroleum Reserve of one million barrels of crude oil per day, up to 180 million total barrels over the next six months. However, crude inventories in the U.S. remain below the five-year average, and the uncertainty around the ability to bring more crude production online kept prices elevated.
-
The global energy markets are facing extraordinary uncertainty as European countries looking to sanction Russian oil and gas in response to the Russia-Ukraine conflict need to reconfigure supply chains and seek alternative sources of traditional energy. Germany took a significant step in this direction by halting the certification of Nord Stream 2, the 750-mile pipeline running through the Baltic Sea that was completed in September 2021 to bring additional gas into Europe.
-
Years of underinvestment have made it challenging for energy companies to ramp up production to meet growing demand. OPEC has remained steadfast in its commitment to incremental production increases. However, global spare production capacity for oil is at multi-year lows.
-
Other commodity markets saw significant increases driven by the war in Eastern Europe, which is expected to exacerbate supply chain issues and impact a broad range of commodities, including grains, fertilizer, and basic materials. These events contributed to record gains in commodity futures indexes during the quarter, with the Bloomberg Commodity Index increasing by 25%. Within commodity markets, the focus remains on exports from Russia and Ukraine, including potential shortages of wheat, fertilizer, and nickel—among others—all of which have seen volatility and price increases through the first quarter of 2022.
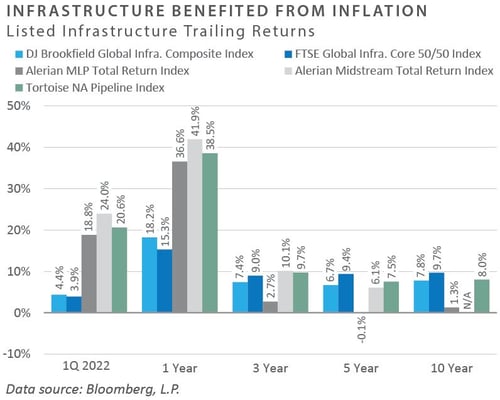
INFRASTRUCTURE
-
Midstream energy infrastructure, as measured by the Alerian MLP Index, significantly outperformed the broader market, benefiting from strength in energy-related commodity prices through the first quarter of 2022. Growing demand from Europe for U.S. liquified natural gas contributed to gains in midstream energy, as U.S. natural gas has quickly become recognized as a global commodity. North American-based midstream companies are expected to benefit as the U.S. emerges as the world’s largest exporter of liquified natural gas (LNG) in 2022.
-
Listed infrastructure stocks, as measured by the FTSE Global Core Infrastructure 50/50 Index, rose just under 4% in the first quarter, led by gains in energy infrastructure stocks and railroads. Declines in telecommunication infrastructure stocks offset these gains; however, listed infrastructure outperformed the broader equity markets, pushing first-quarter performance into positive territory.
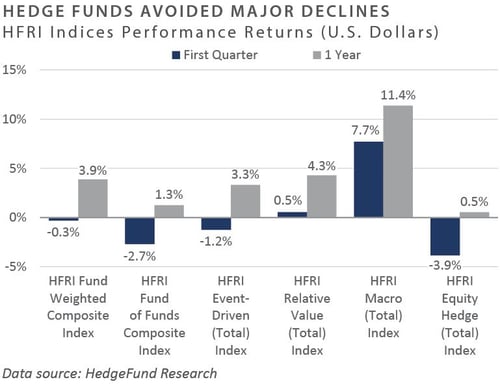
Diversifying Strategies
-
Hedge funds continued to perform relatively well in the first quarter despite heightened volatility. Outside of hedged equity, most underlying strategies’ returns were positive, with a few exceptions.
-
Global macro funds enjoyed strong performance throughout the first quarter. Commodities were the underlying story within global macro as several market trends held steady, notably surging energy prices. Short positions within fixed income markets were also positive contributors to performance.
-
Hedged equity managers bounced back from a rocky start at the beginning of the quarter to end on a positive note. Technology and healthcare specialists endured significant losses in January. The health care sector broadly ended the quarter with a gain while the technology side declined.
INDICES
The Alerian MLP Index is a composite of the 50 most prominent energy Master Limited Partnerships that provides investors with an unbiased, comprehensive benchmark for this emerging asset class.
Barclays Capital Fixed Income Indices is an index family comprised of the Barclays Capital Aggregate Index, Government/Corporate Bond Index, Mortgage-Backed Securities Index, and Asset-Backed Securities Index, Municipal Index, High-Yield Index, and others designed to represent the broad fixed income markets and sectors within constraints of maturity and minimum outstanding par value. See https://ecommerce.barcap.com/indices/index.dxml for more information.
The CBOE Volatility Index (VIX) is an up-to-the-minute market estimate of expected volatility that is calculated by using real-time S&P 500 Index option bid/ask quotes. The Index uses nearby and second nearby options with at least 8 days left to expiration and then weights them to yield a constant, 30-day measure of the expected volatility of the S&P 500 Index. FTSE Real Estate Indices (NAREIT Index and EPRA/NAREIT Index) includes only those companies that meet minimum size, liquidity and free float criteria as set forth by FTSE and is meant as a broad representation of publicly traded real estate securities. Relevant real estate activities are defined as the ownership,
HFRI Monthly Indices (HFRI) are equally weighted performance indexes, compiled by Hedge Fund Research Inc. (HFX), and are used by numerous hedge fund managers as a benchmark for their own hedge funds. The HFRI are broken down into 37 different categories by strategy, including the HFRI Fund Weighted Composite, which accounts for over 2000 funds listed on the internal HFR Database. The HFRI Fund of Funds Composite Index is an equal weighted, net of
J.P. Morgan’s Global Index Research group produces proprietary index products that track emerging markets, government debt, and corporate debt asset classes. Some of these indices include the JPMorgan Emerging Market Bond Plus Index, JPMorgan Emerging Market Local Plus Index, JPMorgan Global Bond Non-US
Merrill Lynch high yield indices measure the performance of securities that pay interest in cash and have a credit rating of below investment grade. Merrill Lynch uses a composite of Fitch Ratings, Moody’s and Standard and Poor’s credit ratings in selecting bonds for these indices. These ratings measure the risk that the bond issuer will fail to pay interest or to repay principal in full. See www.ml.com for more information.
Morgan Stanley Capital International – MSCI is a series of indices constructed by Morgan Stanley to help institutional investors benchmark their returns. There
Russell Investments
S&P 500 Index consists of 500 stocks chosen for market size, liquidity and industry group representation, among other factors by the S&P Index Committee, which is a team of analysts and economists at Standard and Poor's. The S&P 500 is a market-value weighted index, which means each stock’s weight in the index is proportionate to its market value and is designed to be a leading indicator of U.S. equities, and meant to reflect the risk/return characteristics of the
Information on any indices mentioned can be obtained either through your advisor or by written request to information@feg.com.
DISCLOSURES
This report was prepared by FEG (also known as Fund Evaluation Group, LLC), a federally registered investment adviser under the Investment Advisers Act of 1940, as amended, providing non-discretionary and discretionary investment advice to its clients on an individual basis. Registration as an investment adviser does not imply a certain level of skill or training. The oral and written communications of an adviser provide you with information about which you determine to hire or retain an adviser. Fund Evaluation Group, LLC, Form ADV Part 2A & 2B can be obtained by written request directly to: Fund Evaluation Group, LLC, 201 East Fifth Street, Suite 1600, Cincinnati, OH 45202, Attention: Compliance Department.
The information herein was obtained from various sources. FEG does not guarantee the accuracy or completeness of such information provided by third parties. The information in this report is given as of the date indicated and believed to be reliable. FEG assumes no obligation to update this information, or to advise on further developments relating to it. FEG, its affiliates, directors, officers, employees, employee benefit programs and client accounts may have a long position in any securities of issuers discussed in this report.
Index performance results do not represent any managed portfolio returns. An investor cannot invest directly in a presented index, as an investment vehicle replicating an index would be required. An index does not charge management fees or brokerage expenses, and no such fees or expenses were deducted from the performance shown.
Bloomberg Index Services Limited. BLOOMBERG® is a trademark and service mark of Bloomberg Finance L.P. and its affiliates (collectively “Bloomberg”). Bloomberg or Bloomberg’s licensors own all proprietary rights in the Bloomberg Indices. Bloomberg does not approve or endorse this material or guarantee the accuracy or completeness of any information herein, nor does Bloomberg make any warranty, express or implied, as to the results to be obtained therefrom, and, to the maximum extent allowed by law, Bloomberg shall not have any liability or responsibility for injury or damages arising in connection therewith.
Neither the information nor any opinion expressed in this report constitutes an offer, or an invitation to make an offer, to buy or sell any securities.
Any return expectations provided are not intended as, and must not be regarded as, a representation, warranty or predication that the investment will achieve any particular rate of return over any particular time period or that investors will not incur losses.
Past performance is not indicative of future results.
Investments in private funds are speculative, involve a high degree of risk, and are designed for sophisticated investors.
All data is as of March 31, 2022 unless otherwise noted.