Back From the Brink:
A Revival in the Energy Sector
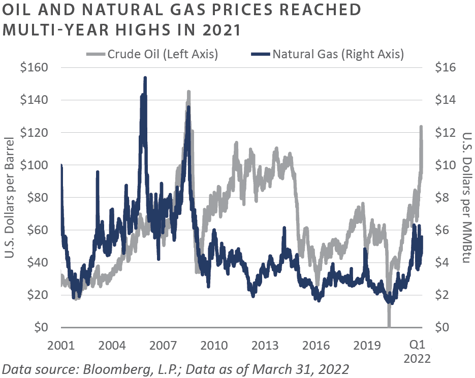
The energy sector took center stage in the first quarter of 2022, as economies emerged from pandemic shutdowns, travel increased, and oil and natural gas inventories fell due to limited drilling activity by producers over the past several years. As energy-related commodity prices—e.g., oil, natural gas, gasoline—rose to multi-year highs, the world was awakened to the fact that hydrocarbons are still a necessary and critical part of the energy mix and that bringing new supply online to meet growing demand would not happen instantaneously.
Then, in late February, Russia’s invasion of Ukraine sparked an immediate disruption in the global energy supply chains, as countries worldwide moved to impose sanctions on Russian oil and gas. With Europe heavily reliant on Russia for much of its oil and natural gas needs—e.g., heating homes, powering factories—the region has scrambled to determine how to secure alternate sources of much-needed fuels.
“The events of the first half of 2020 may represent both the final and
necessary ‘washout’ for the energy sector, as well as the turning point
toward a more stable future…. After a prolonged period of misallocation
of capital accompanied by a loss of confidence from investors, the
energy industry may be moving into an era of better returns.”
— FEG Research Insights – Death in the Oil Patch, June 2020
Importing liquid natural gas from the U.S. and other countries is one option, and renewables are another, but neither is sufficient to address near-term shortages. Energy markets now face a myriad of uncertainties as the world seeks to move to cleaner, renewable fuel sources while at the same time balancing the need for hydrocarbons to bridge the gap to greater adoption of sustainable energy.
BACKDROP — HOW WE GOT HERE
It is difficult to believe that oil prices were negative just over two years ago in April of 2020, reaching -$37/barrel in the wake of massive demand destruction brought on by the emergence of the COVID-19 pandemic. At the time, it was unfathomable to think that oil would trade at the current levels of approximately $100/barrel. Also, in the first quarter of 2020, natural gas prices fell to $1.64/mcf; however, as of early May 2022, they have exceeded $7.50/mcf. Understanding the path that led to the current energy environment requires looking back at the beginnings of the U.S. shale boom nearly a decade ago.
In the early 2010s, the U.S. emerged as the world’s leading producer of hydrocarbons due largely to the application of fracking technology to extract previously inaccessible oil and gas reserves. During this time, the U.S. surpassed Saudi Arabia as the world’s largest oil producer. In response, massive amounts of capital flowed into energy—publicly-traded upstream, mid-stream, and oilfield services, as well as private energy funds—which raised increasingly larger pools of capital to meet investor demand.
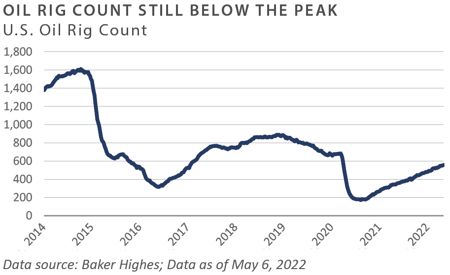
One key metric that captured the excess of this period was the U.S oil rig count, which, by September 2014, had risen to approximately 1,600—an all-time high. As a frame of reference, by August of 2020, the U.S. oil rig count had fallen to 172, a drop of more than 90% from the peak.¹
As with bubbles in other sectors, such as technology and real estate, this period was characterized by an epic misallocation of debt and equity capital in the energy sector, the results of which were catastrophic for investors.
During the downturn in energy from early 2015 through 2020, over 600 companies went bankrupt across upstream, midstream, and oilfield services.2 By 2020, investors had largely abandoned energy, with the sector comprising less than 3% of the S&P 500. As a final blow, ExxonMobil was removed from the Dow Jones Industrial Average in August of that year, a place it had held since 1928.
THE TIDE TURNS
Today’s energy sector stands in stark contrast to that of two years ago, which was characterized by extreme financial distress. In the wake of the 2020 washout, companies that survived began to adopt financial discipline, stabilizing their balance sheets by paying down debt, limiting capital expenditures on new drilling projects, and returning capital to shareholders in the form of dividends and share buybacks.
By 2021, signs emerged that the world could be undersupplied relative to the demand for hydrocarbons. One indication was when Europe’s renewable energy sources fell short of meeting demand during the fall of 2021, and baseload power also proved inadequate. Additionally, through 2021 and into 2022, OPEC remained steadfast in its commitment not to raise its existing production targets—and in fact, has fallen short of those targets over the past year. Both oil and natural gas rig counts have grown incrementally but remain below peak levels of the prior cycle.
In the first quarter of 2022, oil prices crossed the $100/barrel mark for the first time since 2014. Natural gas also rose to levels not seen in nearly a decade. Taking all these factors into account, investors have now begun to consider energy.
REASSESSING THE CURRENT ENERGY PARADIGM
With inflation hitting 40-year highs, energy should be front of mind for investors. Apart from its place in the consumer price index, energy touches many parts of the economy. This is evident in recent earnings reports citing the impact of higher fuel costs on earnings. Even with a commitment to net-zero emissions by a targeted date or avoiding fossil fuel allocations altogether, a holistic view of the energy landscape is necessary.
As investors assess the evolving energy landscape, there are three critical areas for consideration. These are by no means comprehensive but could serve as a guide for dialogue on relevant issues within energy.
1. Lessons from the European Energy Crisis: One observation is the potential pitfalls of moving too rapidly in adopting renewable energy sources without sufficient baseload power. Additionally, energy security is a vital issue facing countries in Europe that have become overly reliant on one source—Russia—for their energy needs. A failure to address these issues is playing out in real-time as the region struggles to reconfigure its energy supply chains while moving away from dependence on Russia. Unfortunately, there is no quick fix to solving these issues, which have been years in the making.
2. Trade-offs in clean energy: There is a growing recognition that the infrastructure required for electric vehicles as well as wind and solar power requires significant basic inputs in the form of industrial metals like copper, nickel, lithium, and cobalt—all of which are produced through global mining activities which use extraction processes involving the use of heavy machinery powered by fossil fuels. Additionally, the refining processes needed to create these necessary inputs are also energy-intensive. The availability of these resources could pose significant challenges to the energy transition.
3. Incorporating an all-Inclusive approach to energy: To borrow an insight from a first-quarter update letter from one of FEG’s recommended energy managers: “Our view has consistently been that the future of global economic growth is contingent on securing reliable, low-cost aggregate energy, including power generation with an ‘all of the above’ approach. We must have power from all existing sources (renewables, hydrocarbons, etc.) to meet the world’s growing energy needs.”3 In order to transition to cleaner forms of energy and meet demands from developing countries, all available fuel sources will be needed.
IMPLICATIONS FOR INVESTORS — PRIVATE ENERGY FUNDS
Many institutional investors have understandably steered clear of the energy sector for a host of reasons, including fossil fuel divestment initiatives, the poor performance of energy funds for much of the past decade, and exceptional returns in other asset classes, such as venture capital, private equity, and real estate. As such, the upstream energy sector stands out as one of the few areas of the market characterized by limited capital commitments and dry powder. Additionally, attention has shifted to energy transition strategies targeting wind, solar, and battery storage, which have attracted significant capital. This is likely to continue over the intermediate term as investors look to invest in sustainable, renewable energy sources.
Investors holding private energy funds with vintages dating back to the mid-2010s have seen those positions languish during the years of the downturn. With increased commodity prices, valuations of these private energy funds should improve, and they should experience uplifts in valuation over the coming quarters as prices filter through to underlying portfolio companies and assets. Exits through initial public offerings or sales to strategic buyers could be in the works for high-quality upstream energy businesses held by some private energy funds.
CONCLUSION
As the energy landscape continues to evolve, investors will be faced with navigating the challenges of inflation, adoption of renewables, and rethinking the role of fossil fuels in the energy transition. While many will likely remain on the sidelines, avoiding new commitments to traditional energy, less capital, and fewer competitors, we believe a favorable commodity price environment may suggest a compelling opportunity for investors.
1, Baker Hughes, May 2022
2 Haynes Boone Oil Patch Bankruptcy Monitor, January 2022
3 RCH Capital, First Quarter 2022 Report
Private Equity
Venture Capital
-
Public market declines in the first quarter, particularly the volatility in the technology sector, affected venture capital activity in a variety of ways. Exit activity fell quickly as companies were hesitant to list on the public market during a sell-off. Fundraising and investing activity were less affected as the public market declines were back-end loaded within the quarter. FEG expects fundraising and investment activity to moderate in the second quarter.
-
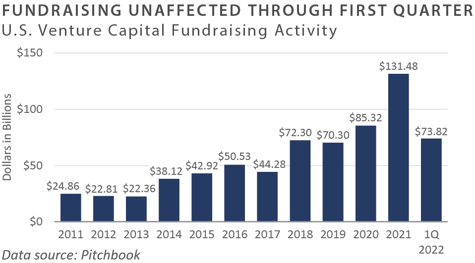
U.S. venture funds raised $74 billion in the first quarter of 2022, with large funds driving the fundraising data. Andreesen Horowitz raised $9 billion, while 19 other funds raised at least $1 billion. Bear in mind that fundraising data is often on a lag between the time LPs make a decision or commitment to a fund and the timing of the actual closing.
-
Investment activity was robust for the quarter—over $70 billion invested across over 3,000 companies—though short of last year’s record pace.
-
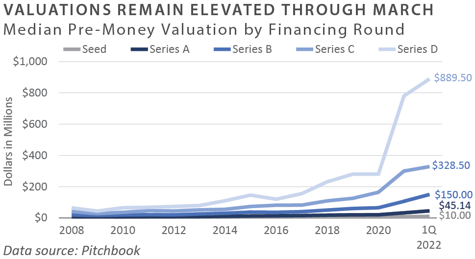
Pre-money valuations continued to rise for venture-backed companies across all stages, particularly for later-stage financings—i.e., Series C and Series D.
-
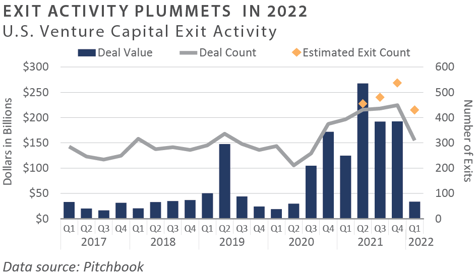
The pullback in the exit market was swift and robust. Exit activity fell to the lowest level since the onset of COVID-19.
-
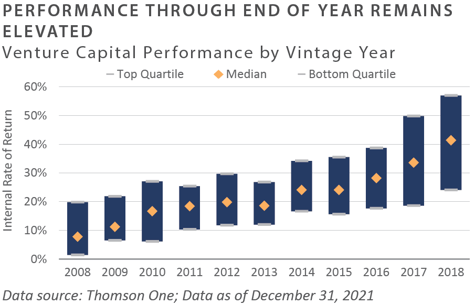
Venture performance through the end of 2021 was strong. Returns will be affected if the exit markets remain closed and hold periods extend.
INVESTOR IMPLICATIONS
FEG believes valuation pressures on existing venture-backed companies will likely come in the next three to six months if current conditions persist. Venture funds with uncalled capital may be able to invest in a lower valuation environment, which could lead to attractive returns in the future. In the interim, we believe investors should be prepared for further volatility.
Leveraged Buyouts
-
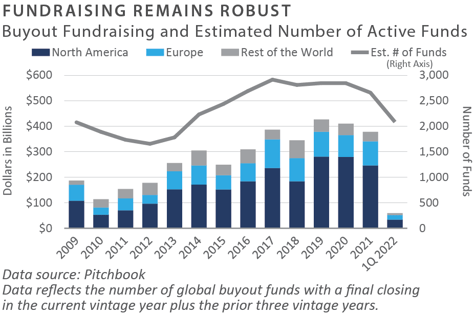
Private equity fundraising was active in the first quarter of 2022. In the U.S., 98 funds closed roughly $65 billion in aggregate commitments.¹ This number is likely to grow, as there are currently at least nine funds either fundraising or coming to market with a target fund size of $20 billion or more.²
-
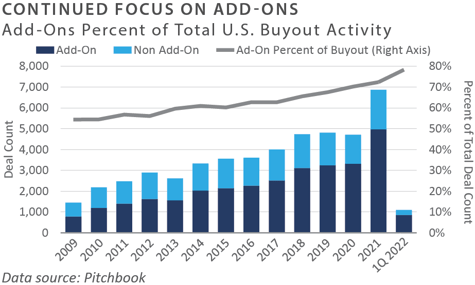
Fueled by high levels of dry powder, U.S. private equity deal activity remained strong in the first quarter of 2022. Both value and volume were up more than 51% and 16%, respectively, from the same period last year.³ Add-ons accounted for more than 78% of transaction volume.⁴
-
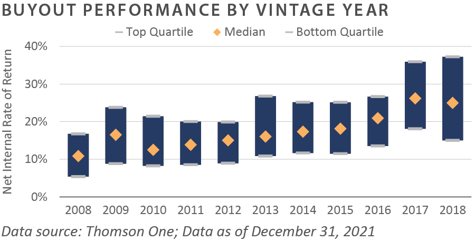
Purchase prices remain elevated. As of March 31, 2022, the median four-quarter buyout multiple was 14.6x earnings before interest, taxes, depreciation, and amortization (EBITDA). The median Debt/EBITDA ratio was 6.3x EBITDA.⁵
-
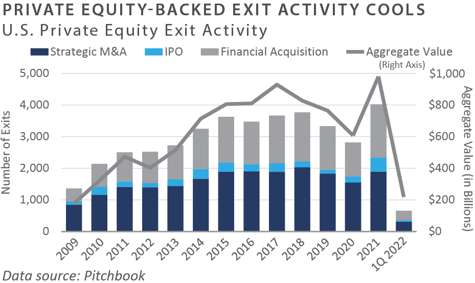
During the first quarter of 2022, U.S. private equity exit value and volume were down 40% and 16%, respectively, from the same period last year.
6Market volatility led to sluggish demand for public offerings. Trade sales to strategic or financial acquirers represented most of the U.S. private equity-backed exits by volume.7 -
Private equity performance was strong through the third quarter of 2021, which is the most recent data available. The spread between the top and bottom quartiles remained above 1,000 basis points.8
INVESTOR IMPLICATIONS
Despite recent public market volatility, the private equity markets remain active. Deal activity and fundraising were all at robust levels in the first quarter of 2022. We believe investors should remain cautious and continue to partner with experienced managers focused on creating value via operational improvements as opposed to financial engineering.
1-7 Pitchbook; Data as of March 31, 2022
8 Thomson One; Data as of December 31, 2021
Private Debt
-
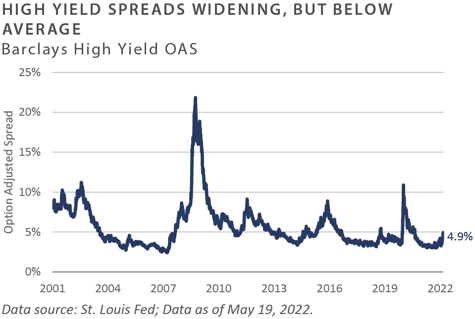
The first quarter saw the reluctant widening of credit spreads, as higher interest rates ruled the fixed income markets. As of March 31, 2022, the bank loan market was flat, while high-yield bonds lost 4.5%.¹
-
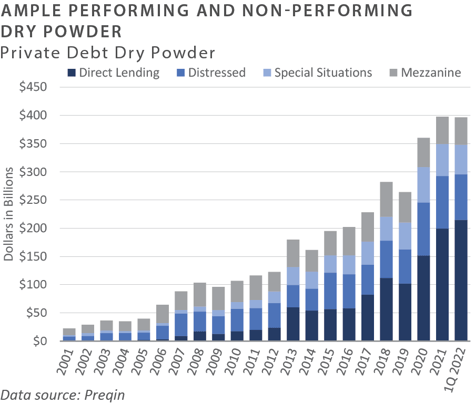
According to Preqin, estimated private debt dry powder almost reached $400 billion as of March 31, 2022. Despite the volatility in the public credit markets thus far in 2022, FEG anticipates this dry powder will find a home, as deal flow remains strong.
-
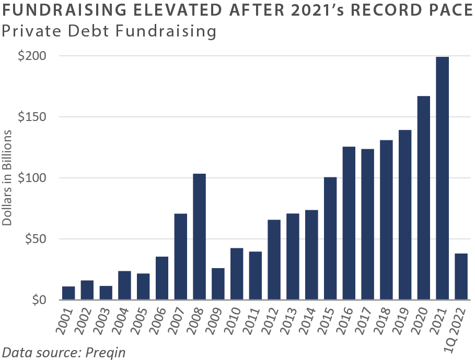
Private debt fundraising was soft in the first quarter with less than $40 billion raised—a weak comparison to the same period in 2021. There were no distressed debt funds raised in the first quarter, according to Preqin data.
- Spread widening in the high yield bond market has been commensurate with higher interest rates, and not yet wide enough—nor priced low enough—to attract the attention of distressed debt managers. Should the credit cycle begin to deteriorate over the remainder of 2022 and into 2023, an influx of distressed debt fund will likely come to market.
INVESTOR IMPLICATIONS
Amid the sustained recovery in public credit, the narrative for the markets and the U.S. economy has shifted toward one of bearish alarms. With the Federal Reserve focused on raising rates and reducing its balance sheet, risk assets have been declining in value. To date, private markets remain sound, with purchase price multiples continuing to be high and private lenders having little trouble finding deals. As the cycle continues to unfold, we believe investors should stay with seasoned lenders and begin to anticipate the next distressed cycle.
1 Ice BofA US High Yield Master II Index
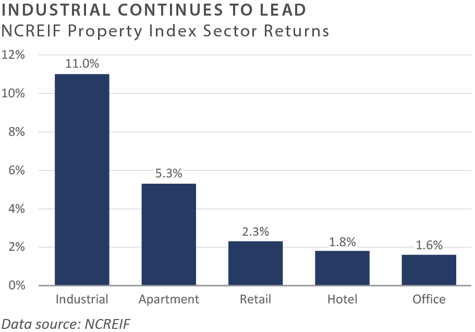
Private Real Estate
-
The National Council of Real Estate Investment Fiduciaries (NCREIF) Property Index (NPI) posted a gain of 5.3% during the first quarter, returning 21.9% on a trailing 1-year basis. Industrial properties continued to outperform. Market value-weighted capitalization rates dropped to 3.7% for the first quarter of 2022. This compares to the average market value-weighted cap rate over the history of the NPI of 6.6%.¹
-
According to Real Capital Analytics, commercial property sales totaled approximately $170 billion in the first quarter, a 56% increase compared to the same period in 2021.² Blackstone continued to lead the real estate acquisition market as it sought to deploy massive capital raised over the past year across its real estate platform. Publicly traded REITs have become a target for Blackstone because they allow an immediate foothold into specific property types.
-
According to Private Equity Real Estate (PERE) data, 71 funds closed in the first quarter of 2022, raising more than $33 billion. There were an estimated 1,000+ private real estate funds in the market raising funds as of the end of the first quarter, a near-record high.³ Mega-funds continue to dominate the fundraising landscape.
-
In addition to the capital available for private value-add, opportunistic, and core strategies, Blackstone recorded $9.8 billion of new inflows into its BREIT fund during the first quarter. With a lower cost of capital than value-add or opportunistic real estate funds, these funds could represent another source of competition for deals.
-
Domestic private-label Commercial Mortgaged Backed Security (CMBS) issuance totaled $29 billion in the first quarter of 2022, an 88% increase over the same period in 2021. Single-borrower deals comprised 64% of the total volume in the quarter. First-quarter CMBS issuance was indicative of the market’s liquidity, investors’ search for yield, and the relatively attractive yields offered by CMBS bonds.⁴
INVESTOR IMPLICATIONS
After a decade of strong returns, real estate is fairly valued by most measures at current levels. Some property types—specifically industrial and multi-family—are trading at record-low cap rates, reflecting solid fundamentals and strong demand from investors. Those seeking inflation protection will likely continue to allocate to real estate, which may drive capital inflows over the coming year. Higher interest rates could slow transaction volume and impact property values in the future. Additionally, declines in public real estate markets may be reflected in private market valuations, albeit with a lag. In a market dominated by mega-funds, we believe the opportunity for smaller real estate funds to sell stabilized properties upstream to larger core buyers remains an attractive opportunity.
1 NCREIF; Data as of March 31, 2022
2 Real Capital Analytics, May 6, 2022
3 Ou, Christie, Q1 Fundraising Shows Strong Momentum, PERE, May 6, 2022
4 Trepp, Quarterly Data Review, 2022
Natural Resource
-
Oil prices rose 33% during the first quarter, closing at $100/barrel, compared to $75/barrel at the end of 2021. This represents a multi-year high for oil price—a level not seen since 2014. A key factor driving price increases during the quarter was Russia’s invasion of Ukraine in late February.
-
OPEC has been steadfast in refusing to increase its production targets. During the quarter, President Biden announced the U.S would release one million barrels per day over the next six months from the Strategic Petroleum Reserve to curb price increases; however, the move has thus far failed to lower oil prices. Publicly traded U.S. oil and gas production companies have been reluctant to pursue new drilling due in part to pressure from shareholders to return capital.
-
Natural gas prices rose 51% in the first quarter to close at $5.64/MMBtu, compared to $3.73/MMBtu at year-end. Increased demand from Europe, as the region sought to ban Russian natural gas imports, elevated prices. Europe has sought to increase liquid natural gas (LNG) imports from the U.S. Still, it lacks the necessary infrastructure to support such imports.
-
Underinvestment in natural gas drilling over the past seven years, coupled with increased demand for natural gas liquids from Europe and Asia, could push prices higher. Another factor has been the decline in “associated” natural gas and natural gas liquids produced along with oil, as companies have cut back on drilling.¹
-
Despite improving oil and natural gas prices, the appetite among institutional investors for upstream energy funds remains limited. Much of the capital being committed to private energy today is in renewables or energy transition strategies, and many upstream managers have pivoted to these types of offerings.
- According to Baker Hughes, the total U.S. rig count increased 14% during the first quarter to 670 rigs, compared to 586 rigs at year-end.²
-
Notably, rig counts have not kept pace with commodity prices and remain well below levels seen at the prior peak.³ Additionally, the number of drilled but uncompleted wells (DUCs) is at the lowest level since 2014. DUCs are an important metric because they allow oil and gas producers the flexibility to rapidly bring production online.
INVESTOR IMPLICATIONS
The dramatic improvement in energy-related commodity prices from the lows of 2020 has thus far failed to attract significant new capital from investors. As a result, energy remains one of the only sectors in the private capital landscape that has not seen significant inflows. This has created an attractive environment for investors with capital to deploy, as competition for deals has diminished significantly. With the ongoing focus on energy transition and moves by investors to divest from fossil fuels, we believe this will likely continue to be the case over the course of the year.
1, Energy Information Administration www.eia.gov; March 31 2022
2, 3 Baker Hughes; Data as of March 31, 2022
INDICES
Bloomberg Barclays US Corporate High Yield Index represents the universe of fixed rate, non-investment grade debt. Eurobonds and debt issues from countries designated as emerging markets are excluded but, Canadian and global bonds (SEC registered) of issuers in non-EMG countries are included. The index includes the corporate sectors: Industrials, Utilities, and Finance, encompassing both US and non-US Corporations. See www.bloomberg.com for more information.
The Russell Indices are constructed by Russell Investment, There are a wide range of indices created by Russell covering companies with different market capitalizations, fundamental characteristics, and style tilts. See www.russellinvestments.com for more information.
The FTSE NAREIT Composite Index (NAREIT) includes only those companies that meet minimum size, liquidity and free float criteria as set forth by FTSE and is meant as a broad representation of publicly traded REIT securities in the U.S. Relevant real estate activities are defined as the ownership, disposure, and development of income-producing real estate. See www.ftse.com/Indices for more information. The S&P 500 Index is capitalization-weighted index of 500 stocks.
The S&P 500 Index is designed to measure performance of the broad domestic economy through changes in the aggregate market value of 500 stocks representing all major industries.
The NCREIF Property Index is a quarterly time series composite total rate of return measure of investment performance of a very large pool of individual commercial real estate properties acquired in the private market for investment purposes only.
HFRI ED: Distressed/Restructuring Index
Distressed/Restructuring strategies which employ an investment process focused on corporate fixed income instruments, primarily on corporate credit instruments of companies trading at significant discounts to their value at issuance or obliged (par value) at maturity as a result of either formal bankruptcy proceeding or financial market perception of near term proceedings. Managers are typically actively involved with the management of these companies, frequently involved on creditors' committees in negotiating the exchange of securities for alternative obligations, either swaps of debt, equity or hybrid securities. Managers employ fundamental credit processes focused on valuation and asset coverage of securities of distressed firms; in most cases portfolio exposures are concentrated in instruments which are publicly traded, in some cases actively and in others under reduced liquidity but in general for which a reasonable public market exists. In contrast to Special Situations, Distressed Strategies employ primarily debt (greater than 60%) but also may maintain related equity exposure.
Information on any indices mentioned can be obtained either through your advisor or by written request to information@feg.com.
DISCLOSURES
This report was prepared by Fund Evaluation Group, LLC (FEG), a federally registered investment adviser under the Investment Advisers Act of 1940, as amended, providing non-discretionary and discretionary investment advice to its clients on an individual basis. Registration as an investment adviser does not imply a certain level of skill or training. The oral and written communications of an adviser provide you with information about which you determine to hire or retain an adviser. Fund Evaluation Group, LLC, Form ADV Part 2A & 2B can be obtained by written request directly to: Fund Evaluation Group, LLC, 201 East Fifth Street, Suite 1600, Cincinnati, OH 45202, Attention: Compliance Department.
The information herein was obtained from various sources. FEG does not guarantee the accuracy or completeness of such information provided by third parties. The information in this report is given as of the date indicated and believed to be reliable. FEG assumes no obligation to update this information, or to advise on further developments relating to it. FEG, its affiliates, directors, officers, employees, employee benefit programs and client accounts may have a long position in any securities of issuers discussed in this report.
Index performance results do not represent any managed portfolio returns. An investor cannot invest directly in a presented index, as an investment vehicle replicating an index would be required. An index does not charge management fees or brokerage expenses, and no such fees or expenses were deducted from the performance shown.
Bloomberg Index Services Limited. BLOOMBERG® is a trademark and service mark of Bloomberg Finance L.P. and its affiliates (collectively “Bloomberg”). Bloomberg or Bloomberg’s licensors own all proprietary rights in the Bloomberg Indices. Bloomberg does not approve or endorse this material or guarantee the accuracy or completeness of any information herein, nor does Bloomberg make any warranty, express or implied, as to the results to be obtained therefrom, and, to the maximum extent allowed by law, Bloomberg shall not have any liability or responsibility for injury or damages arising in connection therewith.
Neither the information nor any opinion expressed in this report constitutes an offer, or an invitation to make an offer, to buy or sell any securities.
Any return expectations provided are not intended as, and must not be regarded as, a representation, warranty or predication that the investment will achieve any particular rate of return over any particular time period or that investors will not incur losses.
Past performance is not indicative of future results.
Investments in private funds are speculative, involve a high degree of risk, and are designed for sophisticated investors.
An investor could lose all or a substantial amount of his or her investment. Private capital funds’ fees and expenses may offset private capital funds’ profits. Private capital funds are not required to provide periodic pricing or valuation information to investors except as defined in the fund documents. Private capital funds may involve complex tax structures and delays in distributing important tax information. Private capital funds are not subject to the same regulatory requirements as mutual funds. Private capital funds are not liquid and require investors to commit to funding capital calls over a period of several years; any default on a capital call may result in substantial penalties and/or legal action. Private capital fund managers have total authority over the private capital funds. The use of a single advisor applying similar strategies could mean lack of diversification and, consequently, higher risk.
All data is as of December 31, 2021 unless otherwise noted..