Global investors endured a particularly volatile market environment during the first quarter, as both stocks and bonds generated broad-based losses amid the outbreak of war on the Eastern European front and a continued inflationary impulse that has sent both interest rates and Federal Reserve (Fed) tightening sentiment markedly higher. Concerns of an overheating economy prompted U.S. policymakers to initiate the monetary tightening process through an increase to the federal funds rate, as well as forward guidance pointing to further policy rate increases and the expectation for balance sheet runoff in the coming months.
Performance across the major areas of the financial markets favored inflation-sensitive sectors such as commodity and value equities, while rate-sensitive areas such as core bonds, long duration assets, and growth equities faced meaningful pressure. In line with the market environment that has been in place for much of the past decade, domestic-oriented assets generally outperformed their international counterparts during the quarter, particularly in emerging markets, which faced headwinds from Russia’s invasion of Ukraine as well as rising COVID-19 cases and related containment measures across China.
Global equities concluded the quarter with broadly negative performance, with bright spots found in strong relative performance on behalf of value equities, particularly the energy sub-indices, and performance challenges among smaller capitalization and growth-oriented equities. While negative in absolute terms, domestic equities outperformed their international cohorts during the quarter, with relatively stronger U.S. economic fundamentals and a strengthening U.S. dollar (USD) serving as tailwinds.
Similar to the equity markets, bond returns were broadly negative on the quarter, as immense upward pressure on interest rates drove steep declines across the rate-sensitive corners, such as core bonds. The Bloomberg U.S. Aggregate Bond Index, for example, declined by 5.9% in the first quarter, representing the worst quarterly performance since third quarter 1980 and the third worst quarterly total return in the nearly 50-year history of the index. Below investment-grade credit also posted total return losses, as risk premiums, such as high yield credit spreads, rose modestly, yet concluded March below the long-run average.
Investors that embraced asset allocation diversification beyond a traditional stock and bond portfolio likely found relief from their allocations to real assets, as this inflation-sensitive area of the investment universe witnessed robust performance, particularly among commodity and energy-oriented sectors. Returns across real estate-related categories, such as real estate investment trusts (REITs), lagged the broader real assets complex, with sentiment pressured by the sharp rise in interest rates and renewed prospects of a slowdown in economic activity.
KEY MARKET THEMES AND DEVELOPMENTS
Russia Invades Ukraine, Sending Energy Costs Soaring and Financial Market Volatility Higher
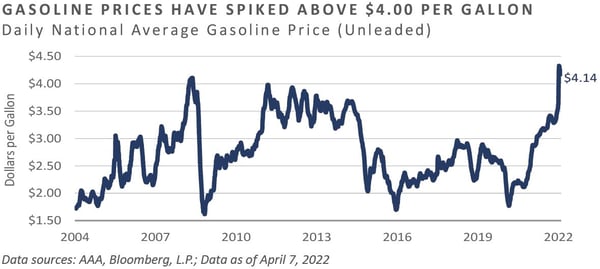
Russia’s late-February invasion of Ukraine was the dominant geopolitical event of the first quarter, the incursion of which has persisted into the second quarter and has been a pivotal factor in the recent surge in energy costs. Crude oil (WTI) spot prices ascended to approximately $125 per barrel in early March, the highest reading since 2008 and a key driver behind the surge in gasoline prices. At the national level, the average price paid for a gallon of regular unleaded gasoline surged to more than $4.30 per gallon in March, the highest price paid at the pump by U.S. consumers in at least 18 years.
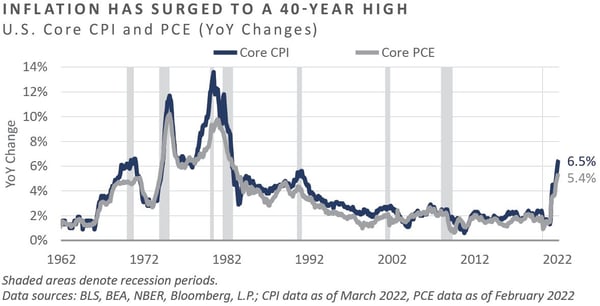
The continued inflationary impulse, which faced an ill-fated tailwind due to the outbreak of war in Eastern Europe during the quarter, has sent realized inflation gauges to their highest levels since the early 1980s, a period when the U.S. economy was exiting one of its worst inflationary episodes in the modern era.
Headline consumer price inflation—which includes the volatile food and energy components—accelerated at an 8.5% annual pace through March, the highest reading since December 1981. Moreover, the monthly change in headline consumer price inflation for March, at 1.2%, was the highest monthly print since September 2005 and nearly 17% on an annualized basis.
Excluding the “noisy” food and energy inputs, which often comprise a disproportionately larger share of household expenditures among low-to-moderate income households, shows a similar upward bias among core consumer price inflation, which has also accelerated to the highest level in at least four decades and significantly above the Fed’s 2% bogey.
The other pillar of the Fed’s stated mandate is the ambiguously defined goal of maximum employment. Although the labor force participation rate remains below pre-pandemic levels, the unemployment rate is now only at 3.6%, with many employers indicating difficulty in hiring. Despite the sub-4% unemployment rate and increased wages garnered by employees, consumers have faced 12 consecutive months of negative annual inflation-adjusted employee wage growth through the quarter. Inflation’s strength over wage growth resulted in real average hourly earnings growth running at a -2.7% annual pace through March.
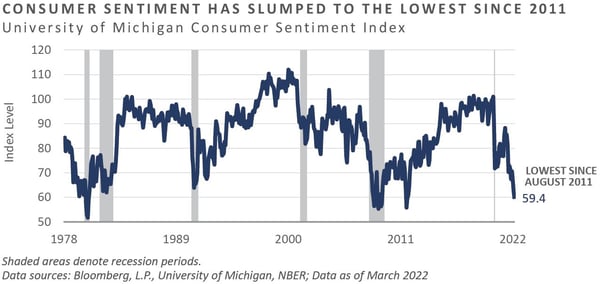
Given the current inflationary dynamic, it is unsurprising that survey-based gauges show the average consumer is reeling. The University of Michigan’s Consumer Sentiment Index, with a data history that extends to the 1950s, has weakened to its lowest level in more than a decade, at an index reading of 59.4.
While Fed tightening should help temper current inflationary pressures, meaningfully higher borrowing costs in the coming quarters may also help slow economic activity—particularly within the housing market. According to Bankrate.com, mortgage rates recently spiked above 5% on average at the national level for 30-year fixed rate loans, the highest level since 2011.
FED INITIATES POLICY RATE LIFTOFF, BUT BOND MARKET INDICATING POTENTIAL FOR "POLICY eRROR"
In light of the highest inflationary backdrop since the early 1980s and a historically tight labor market, the Fed hiked the federal funds rate by 25 basis points (bps) at their March policy meeting. Through updates to their “dot plot,” the Fed issued forward guidance pointing to an additional six hikes to come throughout the year. Additionally, the minutes to the Fed’s meeting highlighted their expectation to allow the nearly $9 trillion balance sheet to begin naturally running-off at a pace of $95 billion per month, potentially as early as May.
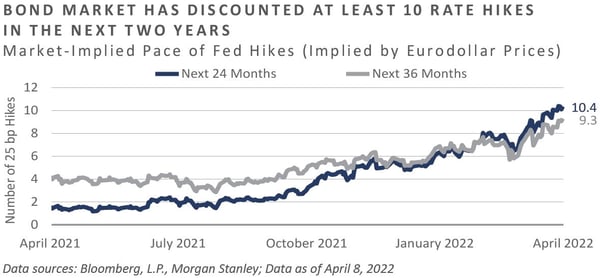
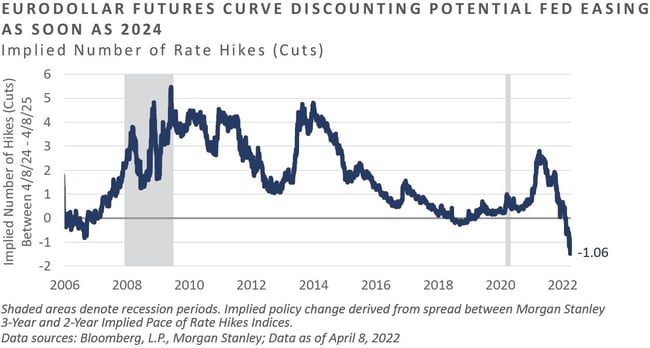
Market-implied measures, such as prices on Eurodollar futures, corroborate the need for significantly tighter near-term monetary conditions, with 10 rate hikes discounted by the bond market in the coming two years, which would place the upper bound on the federal funds rate at 3.00% by April 2024.
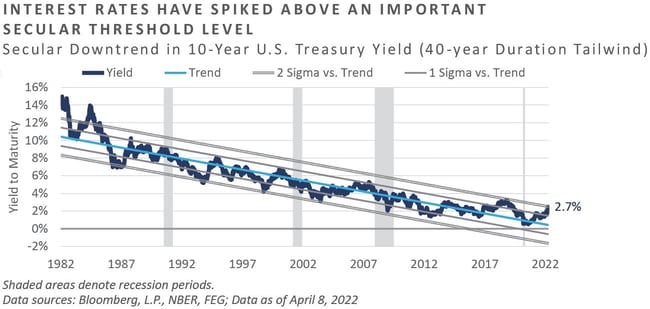
The combination of robust inflationary data and the Fed’s hawkish forward guidance helped send nominal interest rates soaring during the quarter, in turn placing immense pressure on the primary rate-sensitive sectors such as real estate, long duration assets, and core bonds. The yield on the benchmark 10-Year Treasury Note surged 83 bps during the quarter, to conclude March at 2.34%, with further upward pressure experienced in April. Reaching 2.70% in early April, the 10-Year Treasury Note yield pierced a potential critical secular inflection point, with this yield surpassing the two standard deviations above-trend threshold level based on the 40-year downtrend channel.
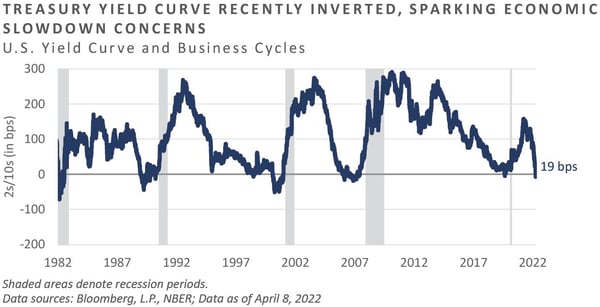
The surge in nominal interest rates has not appeared stable along the curve, as shorter-term rates—reflecting the Fed’s steep implied policy path—have reset to levels higher than that of longer-term rates, suggesting the Fed’s aggressive near-term tightening campaign could run the risk of sparking a material slowdown in economic activity.
Between 2-year and 10-year maturities, the commonly referenced 2-10 yield curve spread inverted at the tail end of the quarter, and while not a perfect recession timing indicator, its historical track record of anticipating inflection points in the business cycle from expansion to contraction has historically been reliable.
Coinciding with the flattening of the U.S. term structure is mounting sentiment for the Fed to reverse course on the policy tightening front in the coming years. The same Eurodollar futures curve data referenced above implies the potential for a Fed interest rate cut potentially as soon as 2024—an anticipated pivot in the Fed’s policy stance which highlights the growing risk of a Fed “policy error.”
As inflation accelerated throughout 2021 and into 2022, the Fed allowed the economy to run “hot,” but is now anticipated to tighten policy aggressively to get inflation under control, leading many market participants to believe the Fed is significantly “behind the curve.” Moreover, the Fed has launched a tightening campaign at a time when current growth fundamentals do not appear overly supportive of less-accommodative monetary conditions, with the Atlanta Fed’s GDPNow™ model tracking a paltry 1.1% inflation-adjusted quarterly growth rate in the first quarter. Should actual growth come in near this model estimate, it would represent the weakest quarterly real growth rate since the second quarter 2020, when U.S. business activity ground to a halt due to severe COVID-19 containment measures.
OUTLOOK AND CONCLUDING THOUGHTS
Soaring inflation, a further tightening of the labor market, Russia’s invasion of Ukraine, and the Fed’s liftoff from the zero bound dominated the macroeconomic landscape in the first quarter. Amid this unusually precarious market backdrop, stock and bond returns were broadly negative, while performance across much of the inflation-sensitive real assets complex remained positive.
In the coming quarters, the Fed is anticipated to hike policy rates to meaningfully higher levels, while allowing their nearly $9 trillion balance sheet to begin running-off. This tightening campaign has coalesced with a marked slowdown in economic activity and an enduring financial market landscape that remains littered with excessive valuations, as Fed “policy error” risks remain chief among investors’ concerns. Under these circumstances, the near-term risks appear to the downside, with nimble investors and skilled active managers poised to flourish once valuation levels—particularly among the frothier corners of the market—ultimately adjust to this new reality.
DISCLOSURES
Bloomberg Data Disclosure: Source- Bloomberg Index Services Limited. BLOOMBERG® is a trademark and service mark of Bloomberg Finance L.P. and its affiliates (collectively “Bloomberg”). Bloomberg or Bloomberg’s licensors own all proprietary rights in the Bloomberg Indices. Bloomberg does not approve or endorse this material or guarantee the accuracy or completeness of any information herein, nor does Bloomberg make any warranty, express or implied, as to the results to be obtained therefrom, and, to the maximum extent allowed by law, Bloomberg shall not have any liability or responsibility for injury or damages arising in connection therewith.
This report was prepared by Fund Evaluation Group, LLC (FEG), a federally registered investment adviser under the Investment Advisers Act of 1940, as amended, providing non-discretionary and discretionary investment advice to its clients on an individual basis. Registration as an investment adviser does not imply a certain level of skill or training. The oral and written communications of an adviser provide you with information about which you determine to hire or retain an adviser. Fund Evaluation Group, LLC, Form ADV Part 2A & 2B can be obtained by written request directed to: Fund Evaluation Group, LLC, 201 East Fifth Street, Suite 1600, Cincinnati, OH 45202 Attention: Compliance Department.
The information herein was obtained from various sources. FEG does not guarantee the accuracy or completeness of such information provided by third parties. The information in this report is given as of the date indicated and believed to be reliable. FEG assumes no obligation to update this information, or to advise on further developments relating to it. FEG, its affiliates, directors, officers, employees, employee benefit programs and client accounts may have a long position in any securities of issuers discussed in this report.
Diversification or Asset Allocation does not assure or guarantee better performance and cannot eliminate the risk of investment loss.
Index performance results do not represent any managed portfolio returns. An investor cannot invest directly in a presented index, as an investment vehicle replicating an index would be required. An index does not charge management fees or brokerage expenses, and no such fees or expenses were deducted from the performance shown.
Neither the information nor any opinion expressed in this report constitutes an offer, or an invitation to make an offer, to buy or sell any securities.
Any return expectations provided are not intended as, and must not be regarded as, a representation, warranty or predication that the investment will achieve any particular rate of return over any particular time period or that investors will not incur losses.
Past performance is not indicative of future results.
This report is intended for informational purposes only. It does not address specific investment objectives, or the financial situation and the particular needs of any person who may receive this report.
Published April 2022
INDICES
The Alerian MLP Index is a composite of the 50 most prominent energy Master Limited Partnerships that provides investors with an unbiased, comprehensive benchmark for this emerging asset class.
The Bloomberg Barclays Capital Aggregate Bond Index is a benchmark index made up of the Barclays Capital Government/Corporate Bond Index, Mortgage‐Backed Securities Index, and Asset‐Backed Securities Index, including securities that are of investment‐grade quality or better, have at least one year to maturity, and have an outstanding par value of at least $100 million.
The HFRI Monthly Indices (HFRI) are equally weighted performance indexes, compiled by Hedge Fund Research Inc., and are utilized by numerous hedge fund managers as a benchmark for their own hedge funds. The HFRI are broken down into 37 different categories by strategy, including the HFRI Fund Weighted Composite, which accounts for over 2000 funds listed on the internal HFR Database. The HFRI Fund of Funds Composite Index is an equal weighted, net of fee, index composed of approximately 800 fund of funds which report to HFR. See www.hedgefundresearch.com for more information on index construction.
The MSCI ACWI (All Country World Index) Index is a free float-adjusted market capitalization weighted index that is designed to measure the equity market performance of developed and emerging markets. The MSCI ACWI consists of 46 country indexes comprising 23 developed and 23 emerging market country indexes. The developed market country indexes included are: Australia, Austria, Belgium, Canada, Denmark, Finland, France, Germany, Hong Kong, Ireland, Israel, Italy, Japan, Netherlands, New Zealand, Norway, Portugal, Singapore, Spain, Sweden, Switzerland, the United Kingdom and the United States. The emerging market country indexes included are: Brazil, Chile, China, Colombia, Czech Republic, Egypt, Greece, Hungary, India, Indonesia, Korea, Malaysia, Mexico, Peru, Philippines, Poland, Qatar, Russia, South Africa, Taiwan, Thailand, Turkey* and United Arab Emirates.
The S&P 500 Index is a capitalization-weighted index of 500 stocks. The S&P 500 Index is designed to measure performance of the broad domestic economy through changes in the aggregate market value of 500 stocks representing all major industries.
Information on any indices mentioned can be obtained either through your advisor or by written request to information@feg.com.
Market Commentary: First Quarter 2022
Global investors endured a particularly volatile market environment during the first quarter, as both stocks and bonds generated broad-based losses amid the outbreak of war on the Eastern European front and a continued inflationary impulse that has sent both interest rates and Federal Reserve (Fed) tightening sentiment markedly higher. Concerns of an overheating economy prompted U.S. policymakers to initiate the monetary tightening process through an increase to the federal funds rate, as well as forward guidance pointing to further policy rate increases and the expectation for balance sheet runoff in the coming months.
Performance across the major areas of the financial markets favored inflation-sensitive sectors such as commodity and value equities, while rate-sensitive areas such as core bonds, long duration assets, and growth equities faced meaningful pressure. In line with the market environment that has been in place for much of the past decade, domestic-oriented assets generally outperformed their international counterparts during the quarter, particularly in emerging markets, which faced headwinds from Russia’s invasion of Ukraine as well as rising COVID-19 cases and related containment measures across China.
Global equities concluded the quarter with broadly negative performance, with bright spots found in strong relative performance on behalf of value equities, particularly the energy sub-indices, and performance challenges among smaller capitalization and growth-oriented equities. While negative in absolute terms, domestic equities outperformed their international cohorts during the quarter, with relatively stronger U.S. economic fundamentals and a strengthening U.S. dollar (USD) serving as tailwinds.
Similar to the equity markets, bond returns were broadly negative on the quarter, as immense upward pressure on interest rates drove steep declines across the rate-sensitive corners, such as core bonds. The Bloomberg U.S. Aggregate Bond Index, for example, declined by 5.9% in the first quarter, representing the worst quarterly performance since third quarter 1980 and the third worst quarterly total return in the nearly 50-year history of the index. Below investment-grade credit also posted total return losses, as risk premiums, such as high yield credit spreads, rose modestly, yet concluded March below the long-run average.
Investors that embraced asset allocation diversification beyond a traditional stock and bond portfolio likely found relief from their allocations to real assets, as this inflation-sensitive area of the investment universe witnessed robust performance, particularly among commodity and energy-oriented sectors. Returns across real estate-related categories, such as real estate investment trusts (REITs), lagged the broader real assets complex, with sentiment pressured by the sharp rise in interest rates and renewed prospects of a slowdown in economic activity.
KEY MARKET THEMES AND DEVELOPMENTS
Russia Invades Ukraine, Sending Energy Costs Soaring and Financial Market Volatility Higher
Russia’s late-February invasion of Ukraine was the dominant geopolitical event of the first quarter, the incursion of which has persisted into the second quarter and has been a pivotal factor in the recent surge in energy costs. Crude oil (WTI) spot prices ascended to approximately $125 per barrel in early March, the highest reading since 2008 and a key driver behind the surge in gasoline prices. At the national level, the average price paid for a gallon of regular unleaded gasoline surged to more than $4.30 per gallon in March, the highest price paid at the pump by U.S. consumers in at least 18 years.
The continued inflationary impulse, which faced an ill-fated tailwind due to the outbreak of war in Eastern Europe during the quarter, has sent realized inflation gauges to their highest levels since the early 1980s, a period when the U.S. economy was exiting one of its worst inflationary episodes in the modern era.
Headline consumer price inflation—which includes the volatile food and energy components—accelerated at an 8.5% annual pace through March, the highest reading since December 1981. Moreover, the monthly change in headline consumer price inflation for March, at 1.2%, was the highest monthly print since September 2005 and nearly 17% on an annualized basis.
Excluding the “noisy” food and energy inputs, which often comprise a disproportionately larger share of household expenditures among low-to-moderate income households, shows a similar upward bias among core consumer price inflation, which has also accelerated to the highest level in at least four decades and significantly above the Fed’s 2% bogey.
The other pillar of the Fed’s stated mandate is the ambiguously defined goal of maximum employment. Although the labor force participation rate remains below pre-pandemic levels, the unemployment rate is now only at 3.6%, with many employers indicating difficulty in hiring. Despite the sub-4% unemployment rate and increased wages garnered by employees, consumers have faced 12 consecutive months of negative annual inflation-adjusted employee wage growth through the quarter. Inflation’s strength over wage growth resulted in real average hourly earnings growth running at a -2.7% annual pace through March.
Given the current inflationary dynamic, it is unsurprising that survey-based gauges show the average consumer is reeling. The University of Michigan’s Consumer Sentiment Index, with a data history that extends to the 1950s, has weakened to its lowest level in more than a decade, at an index reading of 59.4.
While Fed tightening should help temper current inflationary pressures, meaningfully higher borrowing costs in the coming quarters may also help slow economic activity—particularly within the housing market. According to Bankrate.com, mortgage rates recently spiked above 5% on average at the national level for 30-year fixed rate loans, the highest level since 2011.
FED INITIATES POLICY RATE LIFTOFF, BUT BOND MARKET INDICATING POTENTIAL FOR "POLICY eRROR"
In light of the highest inflationary backdrop since the early 1980s and a historically tight labor market, the Fed hiked the federal funds rate by 25 basis points (bps) at their March policy meeting. Through updates to their “dot plot,” the Fed issued forward guidance pointing to an additional six hikes to come throughout the year. Additionally, the minutes to the Fed’s meeting highlighted their expectation to allow the nearly $9 trillion balance sheet to begin naturally running-off at a pace of $95 billion per month, potentially as early as May.
Market-implied measures, such as prices on Eurodollar futures, corroborate the need for significantly tighter near-term monetary conditions, with 10 rate hikes discounted by the bond market in the coming two years, which would place the upper bound on the federal funds rate at 3.00% by April 2024.
The combination of robust inflationary data and the Fed’s hawkish forward guidance helped send nominal interest rates soaring during the quarter, in turn placing immense pressure on the primary rate-sensitive sectors such as real estate, long duration assets, and core bonds. The yield on the benchmark 10-Year Treasury Note surged 83 bps during the quarter, to conclude March at 2.34%, with further upward pressure experienced in April. Reaching 2.70% in early April, the 10-Year Treasury Note yield pierced a potential critical secular inflection point, with this yield surpassing the two standard deviations above-trend threshold level based on the 40-year downtrend channel.
The surge in nominal interest rates has not appeared stable along the curve, as shorter-term rates—reflecting the Fed’s steep implied policy path—have reset to levels higher than that of longer-term rates, suggesting the Fed’s aggressive near-term tightening campaign could run the risk of sparking a material slowdown in economic activity.
Between 2-year and 10-year maturities, the commonly referenced 2-10 yield curve spread inverted at the tail end of the quarter, and while not a perfect recession timing indicator, its historical track record of anticipating inflection points in the business cycle from expansion to contraction has historically been reliable.
Coinciding with the flattening of the U.S. term structure is mounting sentiment for the Fed to reverse course on the policy tightening front in the coming years. The same Eurodollar futures curve data referenced above implies the potential for a Fed interest rate cut potentially as soon as 2024—an anticipated pivot in the Fed’s policy stance which highlights the growing risk of a Fed “policy error.”
As inflation accelerated throughout 2021 and into 2022, the Fed allowed the economy to run “hot,” but is now anticipated to tighten policy aggressively to get inflation under control, leading many market participants to believe the Fed is significantly “behind the curve.” Moreover, the Fed has launched a tightening campaign at a time when current growth fundamentals do not appear overly supportive of less-accommodative monetary conditions, with the Atlanta Fed’s GDPNow™ model tracking a paltry 1.1% inflation-adjusted quarterly growth rate in the first quarter. Should actual growth come in near this model estimate, it would represent the weakest quarterly real growth rate since the second quarter 2020, when U.S. business activity ground to a halt due to severe COVID-19 containment measures.
OUTLOOK AND CONCLUDING THOUGHTS
Soaring inflation, a further tightening of the labor market, Russia’s invasion of Ukraine, and the Fed’s liftoff from the zero bound dominated the macroeconomic landscape in the first quarter. Amid this unusually precarious market backdrop, stock and bond returns were broadly negative, while performance across much of the inflation-sensitive real assets complex remained positive.
In the coming quarters, the Fed is anticipated to hike policy rates to meaningfully higher levels, while allowing their nearly $9 trillion balance sheet to begin running-off. This tightening campaign has coalesced with a marked slowdown in economic activity and an enduring financial market landscape that remains littered with excessive valuations, as Fed “policy error” risks remain chief among investors’ concerns. Under these circumstances, the near-term risks appear to the downside, with nimble investors and skilled active managers poised to flourish once valuation levels—particularly among the frothier corners of the market—ultimately adjust to this new reality.
DISCLOSURES
Bloomberg Data Disclosure: Source- Bloomberg Index Services Limited. BLOOMBERG® is a trademark and service mark of Bloomberg Finance L.P. and its affiliates (collectively “Bloomberg”). Bloomberg or Bloomberg’s licensors own all proprietary rights in the Bloomberg Indices. Bloomberg does not approve or endorse this material or guarantee the accuracy or completeness of any information herein, nor does Bloomberg make any warranty, express or implied, as to the results to be obtained therefrom, and, to the maximum extent allowed by law, Bloomberg shall not have any liability or responsibility for injury or damages arising in connection therewith.
This report was prepared by Fund Evaluation Group, LLC (FEG), a federally registered investment adviser under the Investment Advisers Act of 1940, as amended, providing non-discretionary and discretionary investment advice to its clients on an individual basis. Registration as an investment adviser does not imply a certain level of skill or training. The oral and written communications of an adviser provide you with information about which you determine to hire or retain an adviser. Fund Evaluation Group, LLC, Form ADV Part 2A & 2B can be obtained by written request directed to: Fund Evaluation Group, LLC, 201 East Fifth Street, Suite 1600, Cincinnati, OH 45202 Attention: Compliance Department.
The information herein was obtained from various sources. FEG does not guarantee the accuracy or completeness of such information provided by third parties. The information in this report is given as of the date indicated and believed to be reliable. FEG assumes no obligation to update this information, or to advise on further developments relating to it. FEG, its affiliates, directors, officers, employees, employee benefit programs and client accounts may have a long position in any securities of issuers discussed in this report.
Diversification or Asset Allocation does not assure or guarantee better performance and cannot eliminate the risk of investment loss.
Index performance results do not represent any managed portfolio returns. An investor cannot invest directly in a presented index, as an investment vehicle replicating an index would be required. An index does not charge management fees or brokerage expenses, and no such fees or expenses were deducted from the performance shown.
Neither the information nor any opinion expressed in this report constitutes an offer, or an invitation to make an offer, to buy or sell any securities.
Any return expectations provided are not intended as, and must not be regarded as, a representation, warranty or predication that the investment will achieve any particular rate of return over any particular time period or that investors will not incur losses.
Past performance is not indicative of future results.
This report is intended for informational purposes only. It does not address specific investment objectives, or the financial situation and the particular needs of any person who may receive this report.
Published April 2022
INDICES
The Alerian MLP Index is a composite of the 50 most prominent energy Master Limited Partnerships that provides investors with an unbiased, comprehensive benchmark for this emerging asset class.
The Bloomberg Barclays Capital Aggregate Bond Index is a benchmark index made up of the Barclays Capital Government/Corporate Bond Index, Mortgage‐Backed Securities Index, and Asset‐Backed Securities Index, including securities that are of investment‐grade quality or better, have at least one year to maturity, and have an outstanding par value of at least $100 million.
The HFRI Monthly Indices (HFRI) are equally weighted performance indexes, compiled by Hedge Fund Research Inc., and are utilized by numerous hedge fund managers as a benchmark for their own hedge funds. The HFRI are broken down into 37 different categories by strategy, including the HFRI Fund Weighted Composite, which accounts for over 2000 funds listed on the internal HFR Database. The HFRI Fund of Funds Composite Index is an equal weighted, net of fee, index composed of approximately 800 fund of funds which report to HFR. See www.hedgefundresearch.com for more information on index construction.
The MSCI ACWI (All Country World Index) Index is a free float-adjusted market capitalization weighted index that is designed to measure the equity market performance of developed and emerging markets. The MSCI ACWI consists of 46 country indexes comprising 23 developed and 23 emerging market country indexes. The developed market country indexes included are: Australia, Austria, Belgium, Canada, Denmark, Finland, France, Germany, Hong Kong, Ireland, Israel, Italy, Japan, Netherlands, New Zealand, Norway, Portugal, Singapore, Spain, Sweden, Switzerland, the United Kingdom and the United States. The emerging market country indexes included are: Brazil, Chile, China, Colombia, Czech Republic, Egypt, Greece, Hungary, India, Indonesia, Korea, Malaysia, Mexico, Peru, Philippines, Poland, Qatar, Russia, South Africa, Taiwan, Thailand, Turkey* and United Arab Emirates.
The S&P 500 Index is a capitalization-weighted index of 500 stocks. The S&P 500 Index is designed to measure performance of the broad domestic economy through changes in the aggregate market value of 500 stocks representing all major industries.
Information on any indices mentioned can be obtained either through your advisor or by written request to information@feg.com.
Recent posts
Subscribe to blog