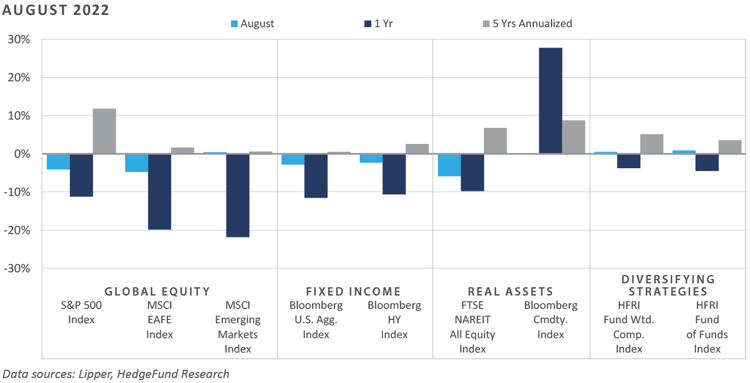
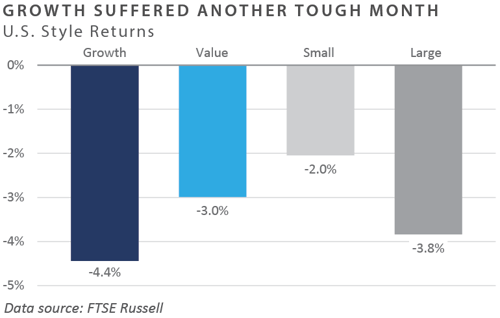
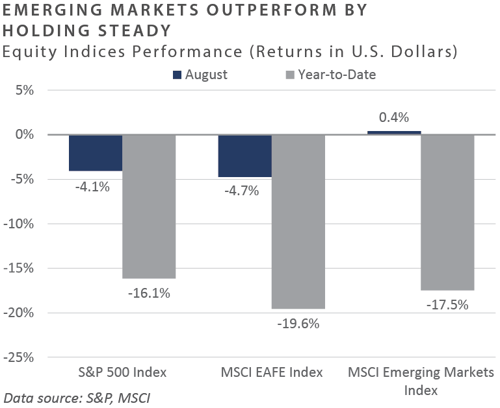
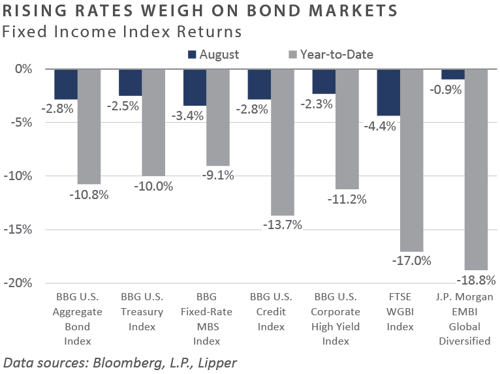
Following a July rally in both risk-oriented and high-quality assets, performance across the financial markets in August reverted to the general theme in place throughout most of 2022, with negative performance experienced in most major asset classes and categories. Hopes of a Federal Reserve (Fed) pivot from hawkish to dovish were dashed in a brief speech by Chair Jerome Powell at the Fed’s annual Jackson Hole Economic Symposium, in which the chairman warned of looming “pain” due to the ongoing tightening of monetary conditions. Across global equities, emerging markets outperformed domestic, small cap outperformed large cap, and value outperformed growth. Bond market performance was overwhelmingly negative on the month, as the ongoing rise of interest rates applied headwinds to the asset class. Credit risk premiums rose modestly but remained below historical averages through the month, likely reflecting a lack of consensus on whether the U.S. is amid a recession or potentially in the beginning stages of one. Like global equities and fixed income, real asset returns were broadly negative—particularly among the longer-duration real estate sector, as the FTSE NAREIT All Equity REIT Index posted a 5.9% loss on the month.
Economic Update
Fed Holds Firm on Tightening Path Despite Rising Unemployment, Slowing Growth
In late August, the Fed hosted its annual economic symposium in Jackson Hole, Wyoming, culminating in a brief speech by Chair Powell. In his remarks, the chairman shared three lessons learned from the management of monetary policy during the last high inflationary environment from the 1970s and 1980s:
“ … central banks can and should take responsibility for delivering low and stable inflation.”
“ … the public's expectations about future inflation can play an important role in setting
the path of inflation over time.”
“ … we must keep at it until the job is done.”
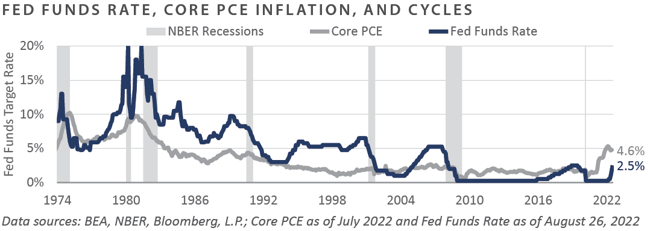
Powell’s third lesson appears to be the Fed’s aim at invoking a sense of Volcker-era inflation-fighting resolve, with parallels drawn to former Fed Chair Paul Volcker’s 2018 autobiography, Keeping At It: The Quest for Sound Money and Good Government. Indeed, despite multiple hikes to the policy rate and the recent expansion of quantitative tightening, the Fed’s preferred proxy of inflation—the personal consumption expenditure (PCE) core series—continues to run meaningfully above the policy rate, indicating more work is needed to tame the persistent cost of living pressures.
Chairman Powell also warned of impending “pain” due to the need to restore price stability.
“While higher interest rates, slower growth, and softer labor market conditions will bring down inflation, they will also bring some pain to households and businesses. These are the unfortunate costs of reducing inflation. But a failure to restore price stability would mean far greater pain.”
— Federal Reserve Board, Chairman Jerome Powell at “Reassessing Constraints on the Economy
and Policy,” an economic policy symposium sponsored by the Federal Reserve Bank of Kansas City;
Jackson Hole, Wyoming, August 26, 2022
Market participants anticipating a near-term reversal in the Fed’s tightening plans—a view likely emboldened by near-flat inflation readings in July—were met with disappointment following chairman Powell’s remarks. This was likely a factor in the downside volatility experienced across the financial markets in late August and early September.
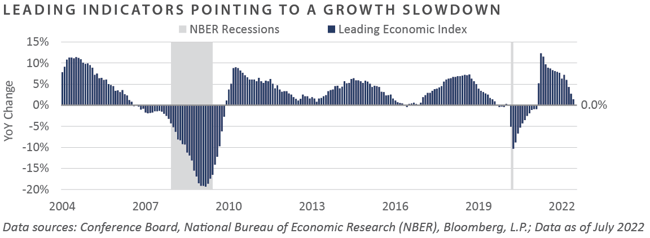
Unfortunately, stubbornly high inflation has persisted when economic growth has cooled and unemployment has risen, the latter two conditions of which would typically call for Fed easing versus tightening. Through August, the headline unemployment rate increased from a cyclical low of 3.5% to 3.7%, the most pronounced monthly increase since the height of COVID-19 containment measures in spring 2020. Moreover, through the most recently published data in July, The Conference Board Leading Economic Index—a composite of indicators designed to lead changes in the business cycle—registered a flat reading on a year-over-year basis, a pace typically reflective of pre-recessionary conditions.
In summary, broad-based performance losses beset the financial markets in August, as economic conditions witnessed further deterioration and longer-term inflationary gauges remained stubbornly high, despite easing through July. To instill confidence in the management of monetary policy within the scope of its dual mandate, the Fed reaffirmed its determination to restore price stability through a hawkish and somber tone at Chair Powell’s August 26 speech at the Fed’s annual Jackson Hole Economic Symposium, which warned of significant difficulty for U.S. households and businesses alike in the months to come.
Market Returns
Global Equity
-
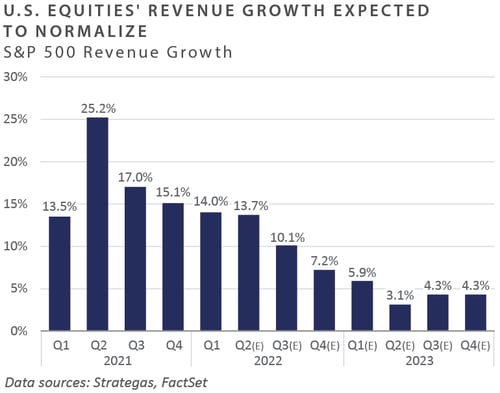
After rebounding strongly in July, global equity market performance was negative in August. Global central banks’ commitment to tamping inflation was the primary driver of equity returns. U.S. equities quickly began to decline mid-month after the Fed’s annual economic symposium in Jackson Hole, Wyoming, at which Chair Powell announced the Fed would maintain its hawkish stance on monetary policy. Expectations for tighter conditions have impacted expected revenue growth, which is forecasted to decline from recent double-digit levels.
-
Growth equities underperformed value equities as interest rates rose and economic growth concerns persisted. On a sector basis, the information technology, health care, and real estate sectors were the hardest hit. The supply chain and inflationary pressures negatively impacted information technology, as big names in the semiconductor industry like Nvidia and Advance Micro Devices signaled negative outlooks.
-
European equities performance was negative, with the ongoing war between Russia and Ukraine continuing to impact the broader European economy adversely. Consumer prices jumped 9.1% in August, driven heavily by rising gas and electricity prices. In early September, the generally more dovish European Central Bank aggressively raised rates by 75 bps to combat inflation. United Kingdom (UK) equities also declined as political change, and economic conditions weighed on investor sentiment. Amid these circumstances, consumer staples and discretionary areas of the market performed poorly, but the banking and energy sectors held up well.
-
Contrary to other developed markets, Japanese equity prices rose in August on the back of strong corporate earnings. Japan has historically faced disinflationary pressures, but as inflation impacts global markets, the country has seen mild inflation at about 2.4%. The Bank of Japan has not made any policy rate changes, and the yen has continued to exhibit weakness against the U.S. dollar.
-
Emerging market equity returns were modestly positive, outperforming developed market equities. Comprising roughly 34% of the index, Chinese equities posted gains as the country’s monetary and fiscal policies remained supportive, broadly benefiting the index. Emerging market countries with robust economic data, like India, Thailand, and Chile, performed well. Conversely, Korea and Taiwan lagged the broader market due to significant semiconductor exposure.
Fixed Income
-
Interest rates marched higher on the month as Fed Chair Powell echoed other Fed members’ pushback against a dovish pivot in policy. The move was especially acute along the front end of the yield curve and cascaded along the belly and long end of the yield curve. During the month, the 10-year U.S. Treasury yield rose 48 bps to 3.15% and was outpaced by the 2-year U.S. Treasury, which jumped 56 bps to 3.45%. The 10-year/2-year Treasury spread ended the month at -0.30% after reaching -0.48% before the Fed’s annual Jackson Hole Economic Symposium. Crystallizing the magnitude of the movement in rates, the 2-year Treasury yield has risen nearly 2.75% on a year-to-date basis and roughly 60 bps since the relative low in July.
-
Echoing the title of Paul Volcker’s biography, Keeping At It, Powell’s message at the Fed’s economic symposium was summarized by his statement of “keeping at it until the job is done.” Rates and risk assets were quick to discount the stern pushback against a policy pivot as interest rates rose along the curve and risk assets sold off. Powell emphasized the theme of “raise and hold,” where the Fed will keep rates elevated until presented with convincing evidence that inflation is abating. Fed Fund Futures marched higher to reflect the hawkish guidance provided by the Fed chair.
-
After a sustained period of spread tightening since July, high yield credit spreads widened in sympathy with the broader risk-off sentiment. The Bloomberg U.S. Credit Index (IG) and Corporate High Yield Index (HY) declined 2.8% and 2.3%, respectively. High yield credit spreads rose 20 bps to approach 5.0% during the month, roughly 80 bps off the month’s low. New issues within the investment grade segment of the market remained robust in August, with deals more than 3.5x oversubscribed on average. New issue concessions, which peaked at over 15 bps in June, settled below eight bps as appetite for investment grade credit resumed.
-
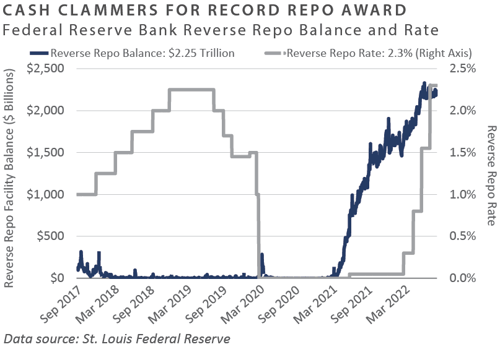
August marked the final month of the moderated pace of quantitative tightening (QT), as the Fed plans to double the pace of balance sheet reduction to $95 billion in September—an annualized rate of $1.1 trillion. During the first QT attempt, securities held outright by the Fed declined by roughly $700 billion before the Fed sharply reversed course due to adverse market impact. Monitoring bank reserves, repurchase agreement rates, and market liquidity will be key as QT ramps up.
Real Assets
REAL ESTATE
-
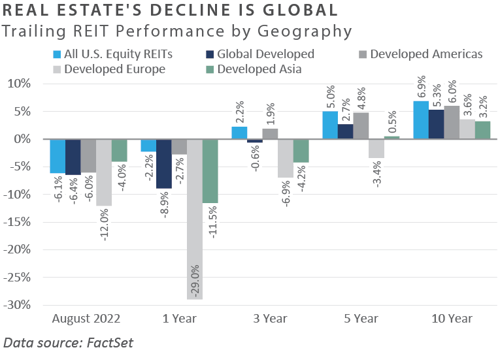
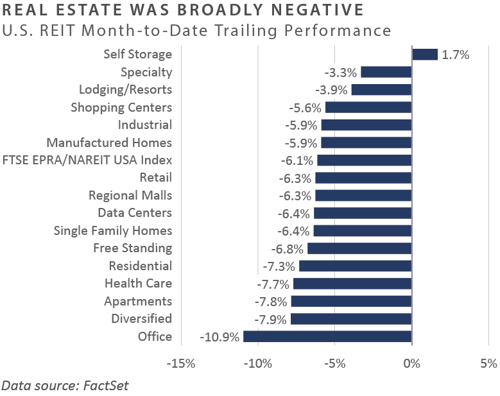
Publicly traded real estate securities (REITs) declined in August after a sharp rebound in July. REITs sold off primarily due to expectations of continued interest rate increases by the Fed and broad equity market weakness, as well as fears of a potential recession. All REIT sectors except self-storage posted negative returns for the month, and all sectors have declined year to date. Self-storage has experienced demand growth due to increased remote work, which has driven broad relocation trends throughout the pandemic. There are, however, concerns that valuations may be stretched, and the sector could experience slower growth in the future.
-
On a year-to-date basis, office REITs have continued to underperform as demand for office space sharply declined during the height of the pandemic and has failed to rebound. Future demand expectations for office remain uncertain, although recent “return to the office” mandates from larger corporations—including prominent Wall Street banks and technology companies—suggest that office space may improve in coming quarters. Regional malls underperformed due to their ties to consumer confidence, which weakened during the month, while industrial REITs were negatively impacted by indications that Amazon was accelerating its plans to reduce warehouse space across the U.S.
NATURAL RESOURCES
-
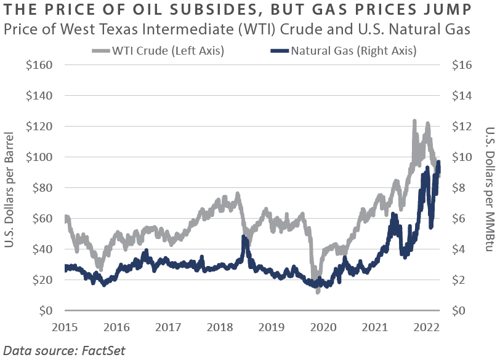
Crude oil and natural gas prices diverged in August, with oil prices declining 9.2% and natural gas prices rising 10.9% for the month. Future curves for both commodities remained in steep backwardation, with futures prices below spot prices. Crude oil prices declined due to expectations of a potential recession, increased production, and COVID-19-related lockdowns in China. U.S. natural gas prices rose to multi-year highs in August as Russia halted exports to Europe through the Nord Stream pipeline, presumably for maintenance. This raised uncertainty about Europe’s ability to secure sufficient natural gas for the coming winter and signaled a growing reliance on U.S. imports. The ability of the U.S. to meet international demand for liquified natural gas (LNG) will continue to be challenged until at least later this fall, as the Freeport LNG facility in Houston is expected to remain offline until October following a fire that damaged the facility in June.
-
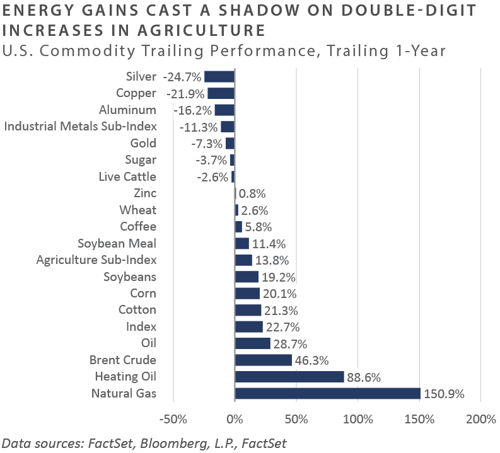
Year-to-date, energy-related commodities continue to outperform compared to industrial metals, precious metals, and soft commodities. Precious metals, typically viewed as an inflation hedge, have fallen due to a strengthening dollar, rising interest rates, and China’s economic slowdown. Slower economic growth put pressure on industrial metals, as the country accounted for roughly 50% of the total global refined copper consumption in 2021. Agriculture commodities returns remain positive year to date, with the war in Ukraine dealing a significant shock to the commodity markets, which may help keep prices at historically high levels for the near future.
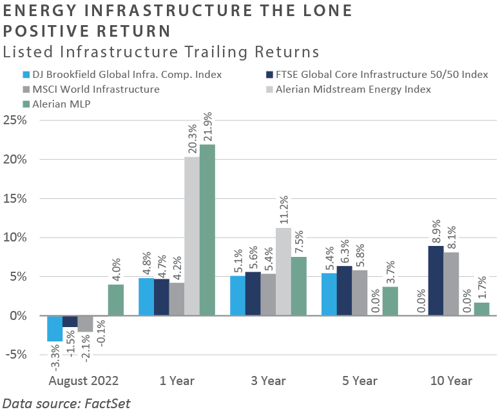
INFRASTRUCTURE
-
Midstream energy infrastructure out-performed all listed infrastructure sectors and the broad market through August, as companies continued to show a general improvement in earnings and cash flow growth. Midstream fundamentals strengthened year to date, with many companies utilizing record free cash flows to reduce debt, allowing for dividend increases and buybacks. Average leverage has declined from 4.2x in 2016 to 3.9x today for the companies comprising the Alerian MLP Index.
-
Listed infrastructure equity returns were negative for the month but continued to outperform the broad market. Utilities, midstream energy, and toll roads have all contributed to positive results year to date. The renewables infrastructure sector has underperformed this year, but the recently passed Inflation Reduction Act is expected to have a favorable impact, providing $369 billion in energy security and climate investments. Significant tailwinds are expected for wind, solar, hydrogen, carbon capture utilization and sequestration, electric vehicle (EV) manufacturing, and EV infrastructure.
Diversifying Strategies
-
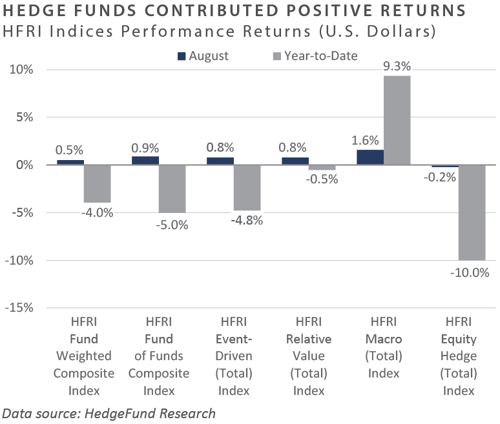
All main hedge fund strategies were contributors for the month, with the exception of equity hedge. Relative value and event-driven both performed well, but macro was the bright spot in August.
-
Both currency and commodities gained momentum during the month, contributing to the strong performance of macro strategies. Most notably, long U.S. dollar and short fixed income positions contributed to gains. Agricultural commodities exposure slightly offset some of those contributions.
-
Hedge equity faced headwinds due to high inflation and global slowdown fears, particularly in Europe. Technology-focused and quantitative directional strategies fared the worst.
-
Event-driven managers performed well across the underlying strategies, with activism and credit arbitrage leading. All underlying event strategies’ returns were positive.
INDICES
The Alerian MLP Index is a composite of the 50 most prominent energy Master Limited Partnerships that provides investors with an unbiased, comprehensive benchmark for this emerging asset class.
Bloomberg Fixed Income Indices is an index family comprised of the Bloomberg US Aggregate Index, Government/Corporate Bond Index, Mortgage-Backed Securities Index, and Asset-Backed Securities Index, Municipal Index, High-Yield Index, Commodity Index and others designed to represent the broad fixed income markets and sectors. On August 24, 2016, Bloomberg acquired these long-standing assets from Barclays Bank PLC. and on August 24, 2021, they were rebranded as the Bloomberg Fixed Income Indices. See https://www.bloomberg.com/markets/rates-bonds/bloomberg-fixed-income-indices for more information..
The CBOE Volatility Index (VIX) is an up-to-the-minute market estimate of expected volatility that is calculated by using real-time S&P 500 Index option bid/ask quotes. The Index uses nearby and second nearby options with at least eight days left to expiration and then weights them to yield a constant, 30-day measure of the expected volatility of the S&P 500 Index.
FTSE Real Estate Indices (NAREIT Index and EPRA/NAREIT Index) includes only those companies that meet minimum size, liquidity and free float criteria as set forth by FTSE and is meant as a broad representation of publicly traded real estate securities. Relevant real estate activities are defined as the ownership, disposure, and development of income-producing real estate. See https://www.ftserussell.com/index/category/real-estate for more information.
HFRI Monthly Indices (HFRI) are equally weighted performance indexes, compiled by Hedge Fund Research Inc. (HFX), and are used by numerous hedge fund managers as a benchmark for their own hedge funds. The HFRI are broken down into 37 different categories by strategy, including the HFRI Fund Weighted Composite, which accounts for over 2,000 funds listed on the internal HFR Database. The HFRI Fund of Funds Composite Index is an equal weighted, net of fee, index composed of approximately 800 fund- of- funds which report to HFR. See www.hedgefundresearch.com for more information on index construction.
J.P. Morgan’s Global Index Research group produces proprietary index products that track emerging markets, government debt, and corporate debt asset classes. Some of these indices include the JPMorgan Emerging Market Bond Plus Index, JPMorgan Emerging Market Local Plus Index, JPMorgan Global Bond Non-U.S. Index and JPMorgan Global Bond Non-U.S. Index. See www.jpmorgan.com for more information.
Merrill Lynch high yield indices measure the performance of securities that pay interest in cash and have a credit rating of below investment grade. Merrill Lynch uses a composite of Fitch Ratings, Moody’s and Standard and Poor’s credit ratings in selecting bonds for these indices. These ratings measure the risk that the bond issuer will fail to pay interest or to repay principal in full. See www.ml.com for more information.
Morgan Stanley Capital International – MSCI is a series of indices constructed by Morgan Stanley to help institutional investors benchmark their returns. There are a wide range of indices created by Morgan Stanley covering a multitude of developed and emerging economies and economic sectors. See www.morganstanley.com for more information.
The FTSE Nareit All Equity REITs Index is a free-float adjusted, market capitalization-weighted index of U.S. equity REITs.
Russell Investments rank U.S. common stocks from largest to smallest market capitalization at each annual reconstitution period (May 31). The primary Russell Indices are defined as follows: 1) the top 3,000 stocks become the Russell 3000 Index, 2) the largest 1,000 stocks become the Russell 1000 Index, 3) the smallest 800 stocks in the Russell 1000 Index become the Russell Midcap index, 4) the next 2,000 stocks become the Russell 2000 Index, 5) the smallest 1,000 in the Russell 2000 Index plus the next smallest 1,000 comprise the Russell Microcap Index, and 6) U.S. Equity REITs comprise the FTSE Nareit All Equity REIT Index. See www.russell.com for more information.
S&P 500 Index consists of 500 stocks chosen for market size, liquidity and industry group representation, among other factors by the S&P Index Committee, which is a team of analysts and economists at Standard and Poor’s. The S&P 500 is a market-value weighted index, which means each stock’s weight in the index is proportionate to its market value and is designed to be a leading indicator of U.S. equities, and meant to reflect the risk/return characteristics of the large cap universe. See www.standardandpoors.com for more information.
Information on any indices mentioned can be obtained either through your advisor or by written request to information@feg.com.
DISCLOSURES
This report was prepared by FEG (also known as Fund Evaluation Group, LLC), a federally registered investment adviser under the Investment Advisers Act of 1940, as amended, providing non-discretionary and discretionary investment advice to its clients on an individual basis. Registration as an investment adviser does not imply a certain level of skill or training. The oral and written communications of an adviser provide you with information about which you determine to hire or retain an adviser. Fund Evaluation Group, LLC, Form ADV Part 2A & 2B can be obtained by written request directly to: Fund Evaluation Group, LLC, 201 East Fifth Street, Suite 1600, Cincinnati, OH 45202, Attention: Compliance Department.
The information herein was obtained from various sources. FEG does not guarantee the accuracy or completeness of such information provided by third parties. The information in this report is given as of the date indicated and believed to be reliable. FEG assumes no obligation to update this information, or to advise on further developments relating to it. FEG, its affiliates, directors, officers, employees, employee benefit programs and client accounts may have a long position in any securities of issuers discussed in this report.
Index performance results do not represent any managed portfolio returns. An investor cannot invest directly in a presented index, as an investment vehicle replicating an index would be required. An index does not charge management fees or brokerage expenses, and no such fees or expenses were deducted from the performance shown.
Bloomberg Index Services Limited. BLOOMBERG® is a trademark and service mark of Bloomberg Finance L.P. and its affiliates (collectively “Bloomberg”). Bloomberg or Bloomberg’s licensors own all proprietary rights in the Bloomberg Indices. Bloomberg does not approve or endorse this material or guarantee the accuracy or completeness of any information herein, nor does Bloomberg make any warranty, express or implied, as to the results to be obtained therefrom, and, to the maximum extent allowed by law, Bloomberg shall not have any liability or responsibility for injury or damages arising in connection therewith.
Neither the information nor any opinion expressed in this report constitutes an offer, or an invitation to make an offer, to buy or sell any securities.
Any return expectations provided are not intended as, and must not be regarded as, a representation, warranty or predication that the investment will achieve any particular rate of return over any particular time period or that investors will not incur losses.
Past performance is not indicative of future results.
Investments in private funds are speculative, involve a high degree of risk, and are designed for sophisticated investors.
All data is as of August 31, 2022 unless otherwise noted.