Private Lending - State of Play
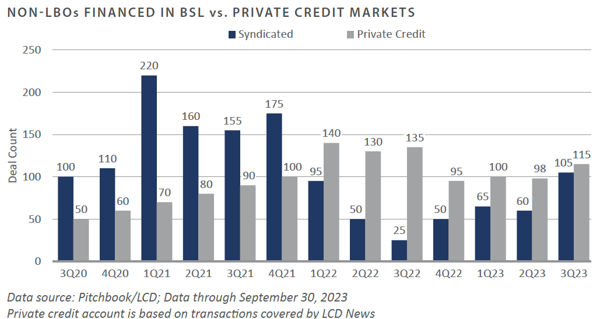
Bolstered by the higher interest rate environment set forth by the Federal Reserve’s (Fed’s) shift in monetary policy over the past two years, an already attractive private lending investment opportunity set has garnered even more interest among investors. In recent years, private lending has continued to gain market share from both the broadly syndicated loan (BSL) market and the high-yield bond market—i.e., public credit markets. Recent new issuances have mainly favored higher-rated credits in the BSL market, comprised of larger, floating-rate debt. At the same time, private lenders have been more supportive of lower-rated and non-rated companies.
The chart shows the shifting landscape of non-leveraged buyout (LBO) transactions financed in the BSL versus private credit markets over the past three years. FEG believes private lenders are well-positioned to continue growing in size and scale relative to the public credit markets. Private lending is here to stay regardless of how deals are financed in the future.
Approximately 85% of the private lending market is comprised of floating-rate securities. This area saw significant growth in the post-Global Financial Crisis (GFC) era due in part to the Fed’s zero-interest rate policy (ZIRP) environment in response to the GFC—and later COVID-19—from December 2008 to December 2015 and again from March 2020 to March 2022. Of late, the Fed’s response to inflation has been to rapidly raise overnight borrowing costs for banks, which has driven a variety of base rates higher, including the Secured Overnight Financing Rate (SOFR). This shift in monetary policy seems to be a regime shift that has had, and will continue to have, significant effects on the private lending market and all corporations as higher loan yields—due to higher base rates—attract more investors.
GROWING COMPETITION
The market’s gravitation toward private lending over the past decade-plus has unsurprisingly led asset managers to consider how to capitalize on this shift. This includes traditional fixed income managers as well as credit-oriented hedge funds seeking growth opportunities for their firms and higher management fees versus what they currently charge in liquid and semi-liquid investment offerings. Existing private lenders are also continuously looking to build market share; as one manager recently described his firm at their annual group meeting, “We are basically a bank.” However, as private lending continues its growth trajectory, FEG believes this area of the market—particularly the U.S. upper middle market—is beginning to resemble a form of private credit beta, so rational investors must consider what they are willing to pay for the perceived exclusivity of entry into the private credit club.
PRIVATE vs PUBLIC
A corporation may favor issuing in public or private credit markets for many reasons. Corporate issuers might prefer private loans due to advantages in flexibility, ease of execution, and potentially lower costs compared to public credit markets. Private loans also offer more customization, involve fewer intermediaries, and remain accessible even during market disruptions when public credit markets could potentially be temporarily frozen. The cost of a private loan can also be more favorable to an issuer based on the borrower's credit profile and market competition among private lenders. The benefits are likely to be most pronounced in the U.S. upper middle market,1 where mega-cap managers primarily compete on price and execution certainty.
LOWER FEES PLEASE
As the competition for doling out private loans grows, management fees charged by private lenders should be expected to decline as the market share winners and losers sort themselves out. The current incentive structures—i.e., carry—created during the ZIRP regime of old, featured preferred returns of 6% to 7%, which were once considered reasonable but are now considered ridiculously low. Instead, FEG expects they will be replaced by flat management fee—no carry—structures. This may take some time, however, as managers are loathe to cut fees until forced by competitive pressure. With the 3-month SOFR at ~5.3% and the market’s growing acceptance that higher-for-longer has become the new normal, 6% to 7% preferred return structures are no longer sufficient.
ADD-ONS INSTEAD OF EXITS
While the illiquidity premium between public and private lending markets remains a hallmark of the asset class, a similar premium should persist between public and private equity over time. With the public equity markets actively trying to determine appropriate valuations in a higher-for-longer world, private equity sponsors have been at a bottleneck in determining the right price to buy or sell companies at their current valuations. As such, many are choosing to punt the ball down the field and bridge the gap by borrowing from private lenders to grow through "add-on" investments. This strategy can ultimately add value to the companies involved and improve multiples, but it also extends the investment horizon for these transactions and delays distributions to private equity investors. Private lenders generally view the practice favorably, as it allows them to deploy capital into a market where new deal activity is soft.
CHALLENGES
The current situation poses an intriguing challenge for investors considering new private lending allocations. In addition to near-term debt maturities having to be refinanced at current levels, today’s higher interest costs translate to higher yields for investors, and companies are grappling with the dual challenge of lower interest coverage ratios (ICR)2 and lower fixed charge coverage ratios (FCCR).3 These financial metrics depend on the level and direction of interest costs and corporate earnings. Higher interest rate costs have a direct negative impact on these metrics. Thus far in the Fed’s rate hiking cycle, corporate earnings for public and private companies have generally remained strong. However, if the Fed continues to increase overnight borrowing costs, which increases interest rate costs for companies, the situation will likely have a negative impact on corporate earnings.
A recent example from one of FEG’s recommended middle market private lenders shows the potential impact of the Fed’s interest rate hiking cycle on the ICR and FCCR of a portfolio. At the close of the initial portfolio transactions made during the COVID-19 ZIRP period, the average ICR was 2.5x, and the average FCCR was 1.7x. As of September 2023, the ICR had declined 28% to 1.8x, and the FCCR had declined 18% to 1.4x. While these declines are concerning, these numbers still provide ample cushion for some additional interest rate hikes, but eventually, the cushion will wear thin.
CONCLUSION
As FEG was at the forefront of allocating to private lenders well before private credit became an institutional asset class in the late 2000s, the firm maintains strong support for these strategies from a strategic standpoint and foresees ongoing growth in the asset class. Legendary investor and author Jim Rogers once stated, "Money flows where it is treated best," a principle that has generally held true over time. With starting yields in the low double-digits, money is being treated quite well.
The current landscape of higher base rates as a starting point for new allocations and the growing potential for these rates to remain higher for longer suggests that private lending currently offers an exceptional risk-adjusted return profile. While higher interest rates heighten the credit risk for companies across the board, negatively impacting key financial metrics, credit risk can be mitigated through prudent manager or lender selection and broad diversification. We believe the capacity to sort through the broad universe of private lending options and differentiate among opportunities is one of FEG's greatest strengths.
1 The U.S. middle market consists of businesses with annual revenues between $10 million and $1 billion. There are about 200,000 middle-market firms in the U.S.; most are privately owned or closely held, and their annual revenues combined total more than $10 trillion. Sources: Investopedia.com and MiddleMarketCenter.org
2 The interest coverage ratio (ICR) measures how well a company can pay the interest on its debt with its earnings. It is calculated by dividing the company’s earnings before interest and taxes (EBIT) by its interest expense for a given period. A higher ratio means that the company has more earnings to cover its interest payments, while a lower ratio means that the
company may struggle to meet its debt obligations.
3 The fixed-charge coverage ratio (FCCR) compares a company’s EBIT plus fixed charges before tax (FCBT) to fixed charges plus interest. This ratio shows how well the company can cover its fixed charges and interest with its operating income. A higher FCCR implies a company has more earnings to cover its fixed expenses, while a lower FCCR means a company may have difficulty meeting its debt obligations.
PRIVATE EQUITY
Venture Capital
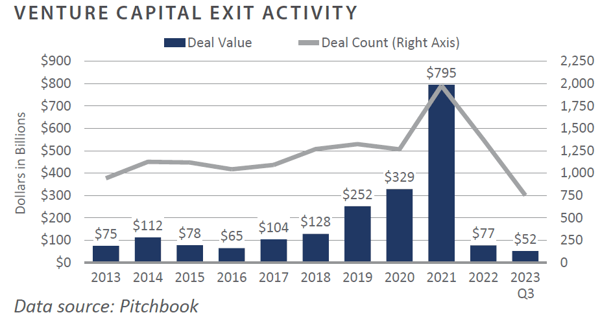
- Venture capital fundraising and investment activity over the quarter remained well below the peak levels seen in recent years. Exit activity remains muted due to a more risk-averse sentiment in which investors and management teams are placing more emphasis on profitability than the grow-that- all-cost environment seen at the turn of the decade.
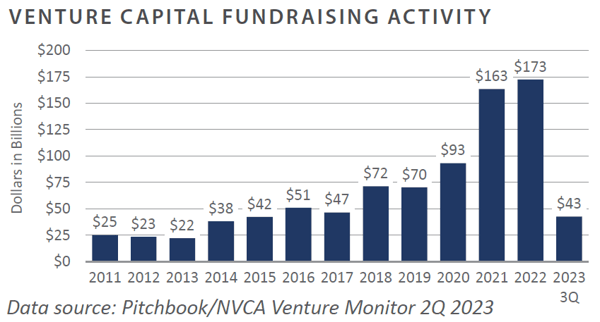
- U.S. venture funds have raised $43 billion for the year through September 30. This reflects a more normalized, albeit different, environment compared to the last several years. From 2010-2019, the average annual fundraising amount was $40 billion. Fundraising spiked over the past several years, however, as investors sought potential returns from the private markets.
- Investment activity also returned to pre-COVID levels in the third quarter. Venture funds invested $126 billion year-to-date through the third quarter. Notably, the third quarter saw the lowest quarterly deal value since the second quarter of 2019. On an annualized basis, 2023 may look more like 2019 and 2020 than the past two years.
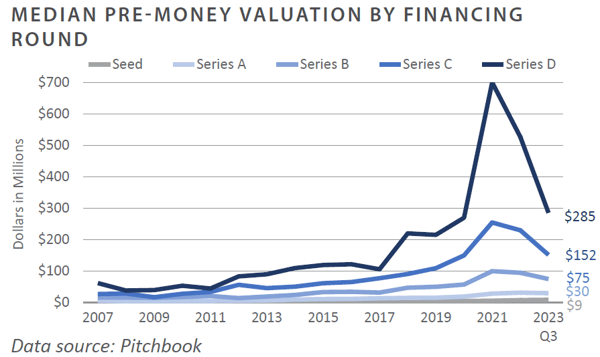
- Pre-money valuations have continued to fall as they return to pre-COVID levels. Late-stage (Series D) valuations experienced the most dramatic rise and subsequent fall over the past few years as investor appetite for risk subsided in the current environment.
- The pullback in the exit market over the quarter was swift and robust. The initial public offering (IPO) window cracked open in the third quarter, with two notable venture-backed companies going public: Instacart and Klaviyo.
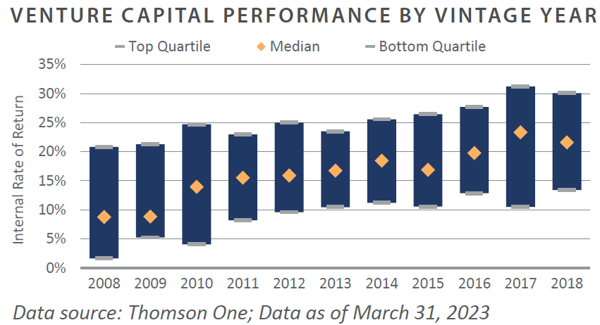
- Venture performance through the first quarter of 2023, the most recent available, was off prior year highs. Returns will likely be affected if the exit markets remain closed and hold periods extend.
INVESTOR IMPLICATIONS
We believe investors should be prepared for volatility due to high valuations and capital flows.
Leveraged Buyouts
- U.S. private equity (PE) raised more than $242 billion through the third quarter.1 As of September 30, 2023, both capital raised and
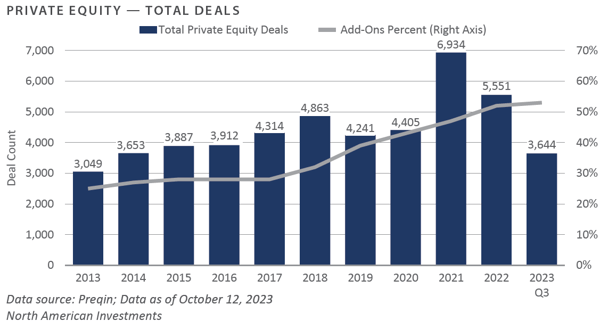
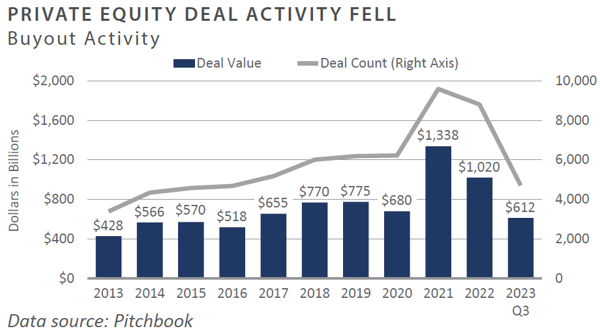
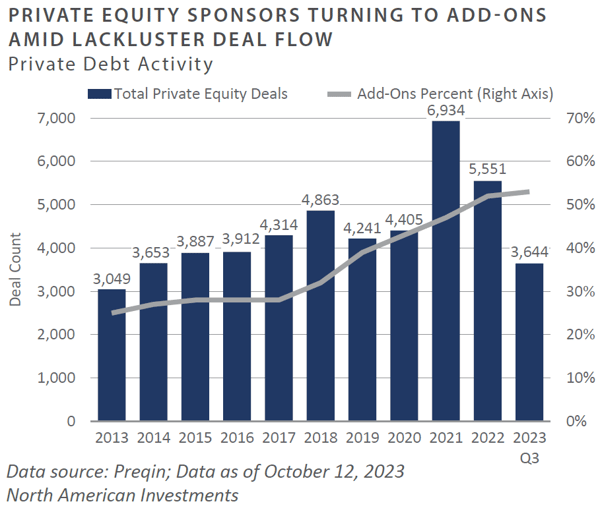
fund counts are off 6% and 13% from the same period last year, respectively.2 - U.S. private equity deal activity continued 2023’s decline during the third quarter. Year-to-date deal value and volume fell by 25% and 29% from the same time last year.3 Trailing 12 months (TTM) value and volume decreased by 32% and 13%, respectively.4 Add-on transactions represented roughly 76% of U.S. PE deal activity thus far in 2023.5
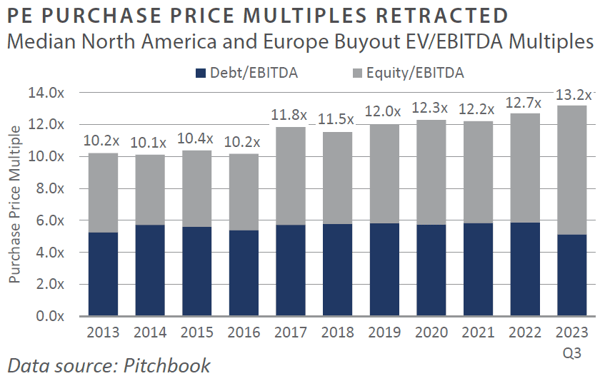
- Last quarter, North American PE purchase price multiples contracted marginally from 2022 levels. As of September 30, 2023, the TTM median private equity buyout purchase price multiple was 12.0x earnings before interest, taxes, depreciation, and amortization (EBITDA).6 The TTM median Debt/EBITDA ratio was 5.1x EBITDA.7
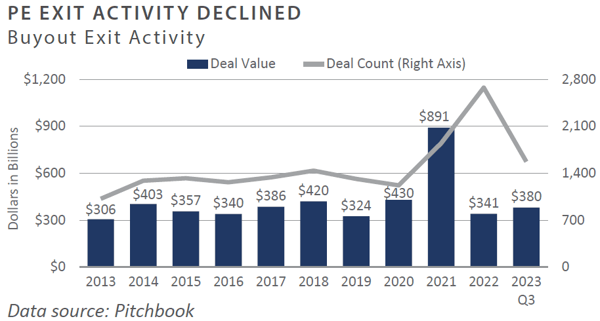
- U.S. PE exit activity declined during the third quarter of 2023. Exit value and volume have begun to reflect the altered pricing triggered by higher interest rates and the elevated cost of financing, with TTM exit value and volume being off 45% and 24%, respectively.8
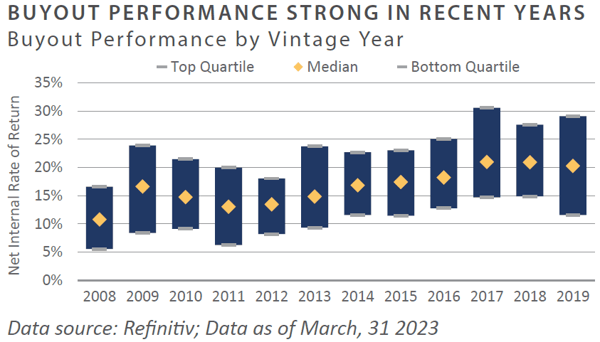
- Private equity performance was strong through the first quarter of 2023, the most recent data available. The spread between the top and bottom quartiles was above 1,000 basis points.9
INVESTOR IMPLICATIONS
Higher interest rates and concerns about a possible economic recession during the third quarter dampened private equity activity. Increasing public market volatility and geopolitical risks will likely present near-term performance headwinds for the asset class. FEG recommends that clients continue to remain cautious with new commitments.
1-8 Pitchbook; Data of September 30, 2023
9 Refinitiv; Data as of March 31, 2023 (most recent available)
Private Debt
-
The third quarter of 2023 saw continued strength in the public credit markets, with bank loans continuing to benefit from higher base rates. The 3-month SOFR was 5.3% at quarter-end. Bank loans gained more than 3% over the quarter, while high yield bonds gained 0.3%.1 Year-to-date, bank loans have nearly doubled the return of high yield bonds.
-
Lackluster deal flow amid a continued bottleneck between private equity buyers and sellers kept new issuance light in the third quarter. Private equity sponsors have continued to focus on add-ons to existing platforms, and private lenders have generated attractive yields for senior secured loans.
-
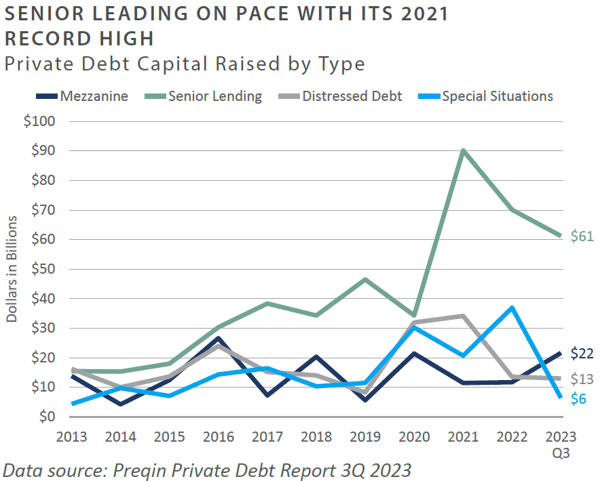
Private debt fundraising has not been spared by the denominator effect of 2022, reducing demand for private capital overall. Mezzanine debt is up versus 2022, while senior lending is on pace to at least keep up with its $90 billion 2021 record.2
INVESTOR IMPLICATIONS
While the economy remains relatively strong, higher interest costs and a higher-for-longer mentality have seeped into the market fabric. With materially higher yields compared to the prior year, the near-term opportunity set in private lending is attractive. The intermediate-term opportunity set favors distressed managers dealing with a tougher environment and higher defaults.
1 Pitchbook – LCD Quarterly Review 2Q 2023
2 Preqin Private Debt Report 3Q 2023
Private Real Estate
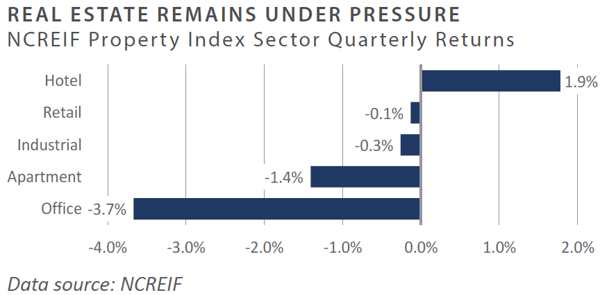
- The National Council of Real Estate Investment Fiduciaries (NCREIF) Property Index (NPI) declined 1.4% during the third quarter after a 2.0% decline in the second quarter. Hotel properties outperformed, with a total return of 1.9% for the quarter, while the office sector fell 3.7% following a 5.8% decline in the second quarter. Hotels benefited from higher occupancy rates driven by increased travel through the summer months. The office sector continues to face headwinds from remote-working trends and high vacancy rates. Market value-weighted cap rates based on appraisals for unsold properties in the index increased to 4.3%, compared to 4.2% in the prior quarter; however, for properties that sold during the quarter, the average cap rate was significantly higher at 5.1%.1
- As measured by the FTSE NAREIT Index, public real estate securities declined 8.3% during the third quarter, following a 1.2% gain in the second quarter. Public real estate stocks continue to be negatively impacted by higher interest rates, and public market cap rates remained above private market cap rates. REIT valuations are attractive on several metrics, including lower debt levels and more fixed-rate financing options.2
- Private real estate transaction volume declined 15% in the third quarter to $27 billion. Multifamily sales volume showed the most substantial declines, falling 62% year-over-year to $30 billion. The sector is facing headwinds from new deliveries and slower rent growth. The third quarter was the weakest for office deal volume since the opening quarter of 2010. In late October, two multi-billion-dollar merger deals were announced: Realty Income agreed to buy Dallas-based Spirit Realty Capital in a $9 billion3 deal, and Healthpeak Properties and Physicians Realty Trust agreed to combine in an all-stock deal valued at $21 billion.4
- According to Preqin, 61 private equity real-estate funds raised approximately $18 billion during the third quarter, a 71% decline from the second quarter. The number of funds in the market remained at a record high, with over 2,700 funds in the market globally as of September 2023. Among the larger funds raised during the quarter were the PIMCO Commercial Real Estate Debt Fund II at $3.0 billion and the Henderson Park Real Estate Fund II at $2.7 billion.5
- Credit availability for commercial real estate remains constrained, with many lenders on the sidelines. Banks are focused on dealing with problematic loans and limiting new lending as non-performing loans have increased. The Mortgage Bankers Association expects overall commercial mortgage origination volumes to decline 38% this year to $504 billion. Total domestic commercial mortgage-backed security (CMBS) issuance was just under $10 billion in the third quarter. Year-to-date, total issuance was $26.5 billion, a 58% decline from the prior year. The volume of CMBS delinquency increased 42% year-to-date through September.6
INVESTOR IMPLICATIONS
Private real estate remains in the early stages of what will likely be a multi-year downturn as commercial property owners are confronting much higher borrowing costs. Managers with a flexible mandate allowing them to invest in multiple property types and geographies should be well-positioned to take advantage of shifting market dynamics in the coming years. Real estate managers will need to balance opportunities to buy distressed assets at attractive prices while managing problematic assets and debt maturities in their active funds.
1 NCREIF; data of September 30, 2023
2 NAREIT, data as of June 30, 2023
3 Preqin; September 30, 2023
4 Dulaney, Chelsea, It’s Merger Monday For Real Estate Investment Trusts, The Wall Street Journal; October 30, 2023
5 Private Equity Real Estate; November 2, 2023
6 Trepp CBMS Research; July 2023
Natural Resources
-
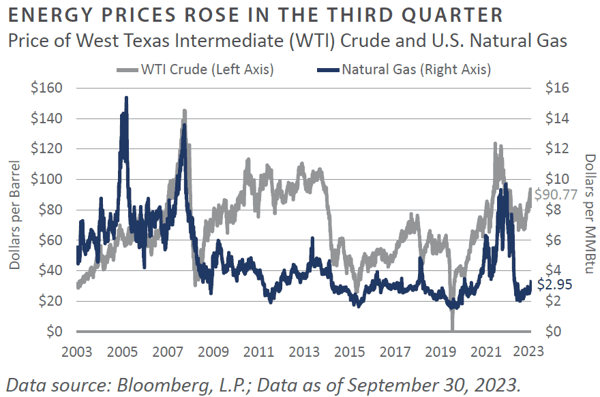
Oil prices rose 28.5% during the third quarter, closing at $90.80/barrel, compared to $70.64/barrel at the end of the second quarter. The extension of 1.3 million barrels per day in supply cuts by OPEC+ leaders Saudi Arabia and Russia, along with rising global demand, led to concerns about supply deficits, pushing prices to their highest level in over a year.1
-
Natural gas prices rose 4.7% in the third quarter on the back of a 26% gain in the second quarter.2 Expectations are for weaker natural gas prices until liquid natural gas (LNG) export capacity begins to come online in 2024. Despite the quarterly gain, natural gas prices remained down approximately 35% year-to-date through the third quarter. U.S. natural drillers have curtailed drilling programs, with the rig count down 27% year-over-year.3
-
Multiple upstream private energy firms were actively raising capital as of the end of the third quarter, with most expecting to continue marketing into the first quarter of 2024. Several large realizations by private equity energy funds year-to-date have increased distributions to limited partners. Also noteworthy is that a small number of groups have emerged specifically targeting secondary interests in upstream funds, a niche area not widely pursued by larger private equity secondary group funds.
-
Upstream M&A activity strengthened through the third quarter and into the fourth quarter. The largest deal year-to-date was ExxonMobil’s $65 billion acquisition of Pioneer Natural Resources, announced in October, which was the firm’s largest deal in over 20 years. Shortly thereafter, Chevron announced it would acquire Hess in a $60 billion deal. Most analysts expect continued merger and acquisition activity as larger companies seek to expand their presence in the Permian. If current trends continue, 2023 upstream M&A activity could hit the highest level in a decade.4
-
During the third quarter, the U.S. rig count declined 19% year-over-year as upstream energy companies remained cautious about capital spending. The lowered rig count reflects the reluctance of energy companies to increase capital expenditures due to pressure from investors to return capital in the form of dividends and share buybacks.5
INVESTOR IMPLICATIONS
Public energy markets are signaling shifting dynamics in energy that are likely to begin manifesting in the private markets. As noted, merger and acquisition activity in public upstream energy is expected to continue into year-end and 2024. The result will likely be the sale of non-core assets, creating acquisition opportunities for private buyers. Within renewable energy, recent headlines have centered on downward earnings revisions for solar companies and scuttled projects in offshore wind. Inevitably, this will spill over into the private markets, where capital has flooded into energy transition funds over the past several years, and projects may see similar challenges. FEG sees an ongoing “reality check for renewables” on the horizon. Nevertheless, the evolving energy landscape continues to present a robust opportunity set for investors.
1-3 Energy Information Administration, www.eia.gov; September 30, 2023
4 EnCap Third Quarter Report; September 30, 2023
5 Baker Hughes; September 30, 2023
INDICES
Bloomberg US Corporate High Yield Index represents the universe of fixed rate, non-investment grade debt. Eurobonds and debt issues from countries designated as emerging markets are excluded, but Canadian and global bonds (SEC registered) of issuers in non-EMG countries are included. The index includes the corporate sectors: Industrials, Utilities, and Finance, encompassing both U.S. and non-U.S. Corporations. See www.bloomberg.com for more information.
The Russell Indices are constructed by Russell Investment. There are a wide range of indices created by Russell covering companies with different market capitalizations, fundamental characteristics, and style tilts. See www.russellinvestments.com for more information.
The FTSE NAREIT Composite Index (NAREIT) includes only those companies that meet minimum size, liquidity and free float criteria as set forth by FTSE and is meant as a broad representation of publicly traded REIT securities in the U.S. Relevant real estate activities are defined as the ownership, disposure, and development of income-producing real estate. See www.ftse.com/Indices for more information.
The S&P 500 Index is capitalization-weighted index of 500 stocks. The S&P 500 Index is designed to measure performance of the broad domestic economy through changes in the aggregate market value of 500 stocks representing all major industries.
The NCREIF Property Index is a quarterly time series composite total rate of return measure of investment performance of a very large pool of individual commercial real estate properties acquired in the private market for investment purposes only.
HFRI ED: Distressed/Restructuring Index — Distressed/Restructuring strategies which employ an investment process focused on corporate fixed income instruments, primarily on corporate credit instruments of companies trading at significant discounts to their value at issuance or obliged (par value) at maturity as a result of either formal bankruptcy proceeding or financial market perception of near term proceedings. Managers are typically actively involved with the management of these companies, frequently involved on creditors' committees in negotiating the exchange of securities for alternative obligations, either swaps of debt, equity or hybrid securities. Managers employ fundamental credit processes focused on valuation and asset coverage of securities of distressed firms; in most cases portfolio exposures are concentrated in instruments which are publicly traded, in some cases actively and in others under reduced liquidity but in general for which a reasonable public market exists. In contrast to Special Situations, Distressed Strategies employ primarily debt (greater than 60%) but also may maintain related equity exposure.
Information on any indices mentioned can be obtained either through your advisor or by written request to information@feg.com.
DISCLOSURES
This report was prepared by Fund Evaluation Group, LLC (FEG), a federally registered investment adviser under the Investment Advisers Act of 1940, as amended, providing non-discretionary and discretionary investment advice to its clients on an individual basis. Registration as an investment adviser does not imply a certain level of skill or training. The oral and written communications of an adviser provide you with information about which you determine to hire or retain an adviser. Fund Evaluation Group, LLC, Form ADV Part 2A & 2B can be obtained by written request directly to: Fund Evaluation Group, LLC, 201 East Fifth Street, Suite 1600, Cincinnati, OH 45202, Attention: Compliance Department.
The information herein was obtained from various sources. FEG does not guarantee the accuracy or completeness of such information provided by third parties. The information in this report is given as of the date indicated and believed to be reliable. FEG assumes no obligation to update this information, or to advise on further developments relating to it. FEG, its affiliates, directors, officers, employees, employee benefit programs and client accounts may have a long position in any securities of issuers discussed in this report.
Index performance results do not represent any managed portfolio returns. An investor cannot invest directly in a presented index, as an investment vehicle replicating an index would be required. An index does not charge management fees or brokerage expenses, and no such fees or expenses were deducted from the performance shown.
Bloomberg Data Disclosure: Source- Bloomberg Index Services Limited. BLOOMBERG® is a trademark and service mark of Bloomberg Finance L.P. and its affiliates (collectively “Bloomberg”). Bloomberg or Bloomberg’s licensors own all proprietary rights in the Bloomberg Indices. Bloomberg does not approve or endorse this material or guarantee the accuracy or completeness of any information herein, nor does Bloomberg make any warranty, express or implied, as to the results to be obtained therefrom, and, to the maximum extent allowed by law, Bloomberg shall not have any liability or responsibility for injury or damages arising in connection therewith.
Neither the information nor any opinion expressed in this report constitutes an offer, or an invitation to make an offer, to buy or sell any securities.
Any return expectations provided are not intended as, and must not be regarded as, a representation, warranty or predication that the investment will achieve any particular rate of return over any particular time period or that investors will not incur losses.
Past performance is not indicative of future results.
Investments in private funds are speculative, involve a high degree of risk, and are designed for sophisticated investors.
An investor could lose all or a substantial amount of his or her investment. Private capital funds’ fees and expenses may offset private capital funds’ profits. Private capital funds are not required to provide periodic pricing or valuation information to investors except as defined in the fund documents. Private capital funds may involve complex tax structures and delays in distributing important tax information. Private capital funds are not subject to the same regulatory requirements as mutual funds. Private capital funds are not liquid and require investors to commit to funding capital calls over a period of several years; any default on a capital call may result in substantial penalties and/or legal action. Private capital fund managers have total authority over the private capital funds. The use of a single advisor applying similar strategies could mean lack of diversification and, consequently, higher risk.
All data is as of September 30, 2023 unless otherwise noted.