Venture Capital Today: An Echo of the Dot-com Era?
Throughout the late 1990s, record-low interest rates and large-scale adoption of internet technology fueled massive growth across the venture capital space. This dot-com era was described as a period of “irrational exuberance,” popularized by former Federal Reserve Chairman Alan Greenspan in 1996. Investor enthusiasm for technological innovations inflated asset valuations higher than the fundamentals of those assets justified. This widespread undue optimism led bullish investors to plow capital into young companies that, in some cases, did not even have business plans. Some companies were so speculative that their valuation multiple was based on the number of “clicks” or “eyeballs” their website attracted. On March 10, 2000, the tech-heavy NASDAQ composite index hit an all-time high of 5,048.6, the result of a culmination of years of speculation, initial public offerings (IPOs), and venture capital flooding into technology companies.
By 2000, money from venture capital firms and public market investors began to dry up. When free-flowing capital was no longer available, those companies which lacked self-sustaining profits quickly ran through their cash and crashed and burned. Internet companies spiraled into free fall. Billions of dollars in market capitalizations and the over-optimized growth were wiped out. The dot-com bubble burst, erasing more than four years of gains in the NASDAQ, which lost 78% of its value. Witnessing the sharp tech-driven downturn in the market during the first two years of the new millennium, venture capital investors realized how irrational their exuberance had been.
Fast-forward 20 years, and the market was experiencing an eerily similar rise and fall. A decade-long low interest rate environment, another frenzy of technological innovation, and record-high venture capital fundraising dominated the financial landscape. In late 2021, however, the tables turned. Central banks tightened their monetary policies to combat a sharp jump in inflation, valuations shrank, and venture capital investment activity paused as the impact of higher interest rates started to move through the capital markets. While the two periods bore many of the same hallmarks, there were some key distinctions worth considering.
Widespread digital adoption in the decade preceding the pandemic—which was then accelerated by the COVID-19 crisis—provided a breeding ground for entrepreneurs to develop new and exciting tech applications. New technologies, such as software-as-a-service (SaaS), cloud computing, workflow automation, and online shopping platforms, attracted public and private market dollars. Because of this, tech stocks outperformed pandemic pressures through both 2020 and 2021.
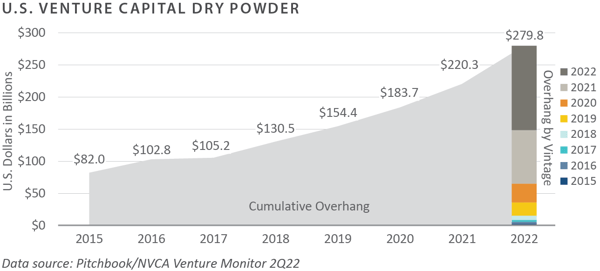
On November 19, 2021, the NASDAQ peaked at 16,057.4. With interest rates close to zero and little yield to be found elsewhere, investors poured money into private markets. Venture capital fundraising dollars in 2021 and 2022 reached record highs. As the amount of dry powder—i.e., committed but uncalled capital—increased, investors had to compete for deals, and the negotiation power of founders grew. At the same time, valuations continued to creep higher and higher.
Surging inflation, geopolitical tensions, supply chain issues, and rising interest rates rocked the public markets. As central banks started ramping up interest rates to combat inflation, growth rates and profit margins took a turn. Large tech companies experienced slowdowns in growth and profitability, which spurred a flurry of layoffs.
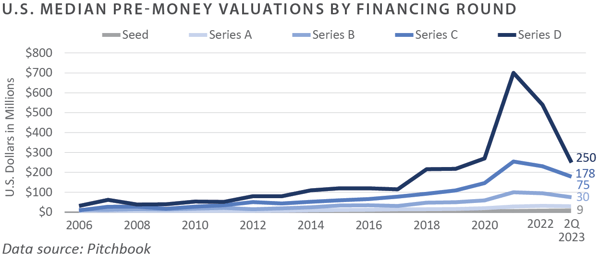
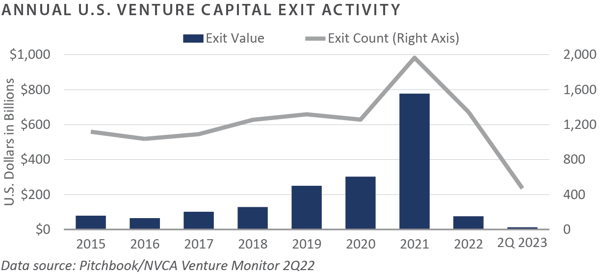
The private markets shared the unease of the public markets, and venture capital valuations pulled back. Between the final quarter of 2021 and the same period in 2022, the average late-stage (series D) valuations of private startups tumbled nearly 63%.1 A slowdown in funding and valuation cuts ground venture capital activity to a halt. In 2022, venture capital exit activity plummeted, as sellers were anchored to previously elevated prices and buyers focused on the changing economic conditions.
There are clear parallels between the performance of tech stocks and venture capital over the last few years and the technology bubble of the late 1990s. However, the rise and fall of the current economic landscape is not quite a repeat of the early 2000s.
The dot-com bubble was a speculative bubble created by a rapid rise and interest in internet companies with shaky business models, while recent underperformance resulted from a prolonged favorable interest rate environment turned upside down with aggressive monetary tightening.
In the five years prior to March 2000, the NASDAQ appreciated 489%. In the 18 months that followed, it fell 75%. In the five years prior to November 2021, however, the NASDAQ appreciated 205% and has since fallen approximately 35%. Clearly, the scale of the prior episode outweighs that of the current period.
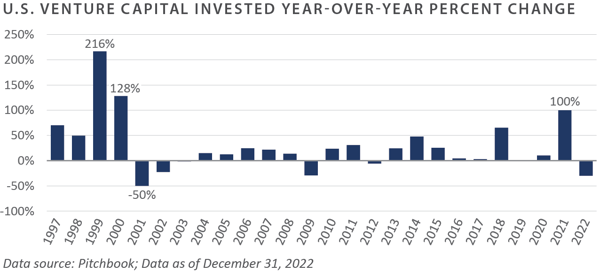
Compared to today, the venture capital space 20 years ago was a cottage industry, and technology companies were exploring business models that revolved around the internet. The year-over-year change in invested capital further illustrates the stark contrast in the magnitude of declines then and now.
The dot-com bubble also had more pronounced lingering effects. As previously noted, the NASDAQ hit its high in March 2000, but it did not return to that level until 2014. Comparably, the market in 2023 is already experiencing a rebound, with an increase of 38% through July 31, 2023. Things are also looking up in the private markets, with valuations returning to normal ranges in line with those prior to the pandemic.
The most significant contributing factor to the dot-com bubble was investments in companies with no viable business models. Pursuing growth at all costs, the companies quickly burned through cash. Then, when the faucet of venture capital funding no longer poured into them, they went bust. Large investments and rushing to IPO could not compensate for a lack of sound business models.
Learning from their fallen predecessors, founders now emphasize fundamental unit economics. Cautious of downside protection, venture companies today closely monitor the amount of cash on their balance sheets. Moreover, many venture capitalists today seek to reduce loss ratios by setting aside capital for follow-on needs.
In the current environment, inflation has tempered. Interest rates have spiked to a 15-year high, which may or may not be the peak. The market could continue to rally or head into a recession, but with more focus on strong financials, it is reasonable to assume that more companies will survive than those who weathered the crisis two decades past.
Looking ahead, companies will continue to find ways to remain innovative regardless of macroeconomic and global uncertainties. Even when growth was wiped away in the bursting of the dot-com bubble, companies endured. Those left standing—e.g., Amazon, eBay, and Priceline—became some of the most well-known tech companies in the world. In both up and down markets, entrepreneurs will continue to develop disruptive technologies.
Startups with capital-efficient business models still have opportunities to thrive. Artificial intelligence (AI) is making strides in leveraging computers and machines to mimic the problem-solving and decision-making capabilities of the human mind. Advances in automation and AI have garnered excitement from investors.
Widespread, justified optimism from investors may continue to permeate the venture capital ecosystem to support these new ideas, burgeoning to prove their product-market fit. Venture capital is a 10- to 12-year partnership in a high-risk strategy with the potential for high returns. There will necessarily be cycles along the way, but innovation will not stop.
Therefore, FEG believes investors should size allocations appropriately and take a selective approach when investing in venture capital. Learning from investors of the past, today’s investors can take steps to rationalize their exuberance to support the growth of transformative venture-backed companies.
1 Pitchbook
PRIVATE EQUITY
Venture Capital
- Venture capital fundraising and investment activity remain well below the peak levels of recent years. Exit activity slowed significantly during the quarter due to falling valuations and a more risk-averse sentiment. Anecdotally, venture capitalists indicate they are preparing companies for a very different economic environment in the coming years, with more emphasis on profitability than growth at all costs.
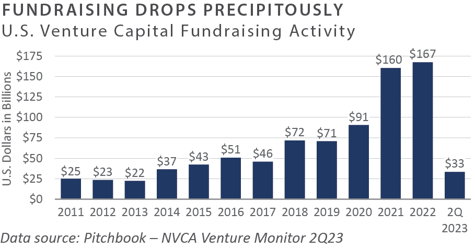
- U.S. venture funds raised $33 billion in the first half, which reflects a more normalized environment than in the last several years. The average annual fundraising amount from 2010-2019 was $40 billion, with fundraising spiking over the last several years as investors sought potential returns from the private markets.
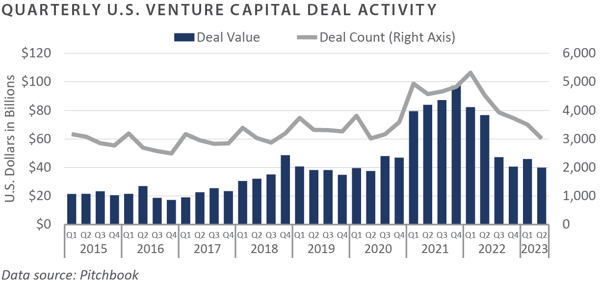
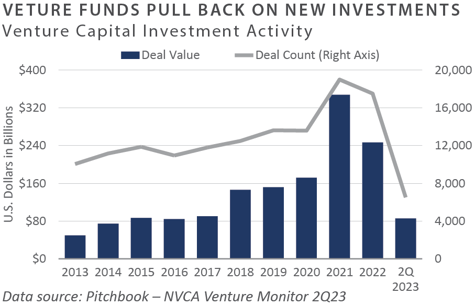
- Investment activity has also returned to pre-COVID levels. Venture funds invested $86 billion in the first half of 2023, continuing the trend which began in the second half of 2022. On an annualized basis, 2023 may bear more similarity to 2019 and 2020 than the past two years.
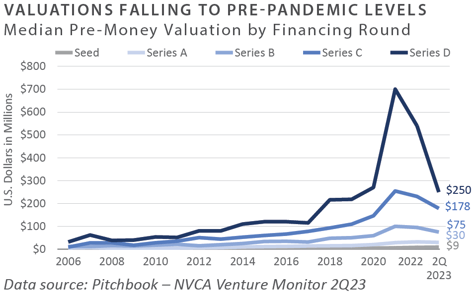
- Pre-money valuations continue to fall as they return to pre-COVID levels. Late-stage (Series D) valuations experienced the most dramatic rise and subsequent fall as investor appetite for risk has ebbed in the current environment.
- The pullback in the exit market during the quarter was swift and robust. As the IPO window closed, exit activity was the lowest in over a decade.
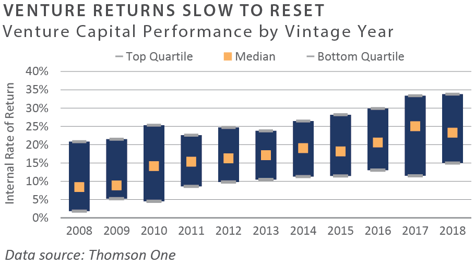
- Venture performance through 2022 has come off recent highs. Returns will be affected if the exit markets remain closed and hold periods extend.
INVESTOR IMPLICATIONS
We believe investors should be prepared for volatility due to high valuations and capital flows.
Leveraged Buyouts
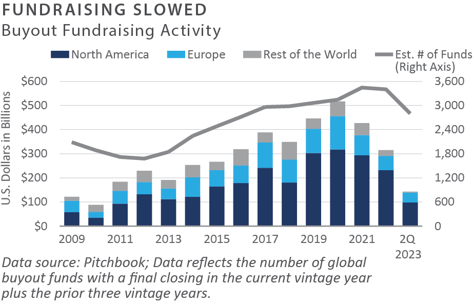
- Globally, private equity (PE) raised more than $143 billion through the second quarter of 2023.1 Roughly 69% of the funds were in North America, and 29% were in Europe.2 Through the second quarter of 2023, U.S. PE fundraising was down roughly 13% from the same period in the prior year.3
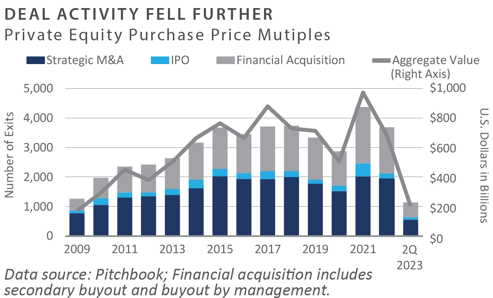
- U.S. private equity deal activity slipped further during the second quarter of 2023. Year-to-date deal value and volume fell by 30% and 31%, respectively, from the same time in 2022.4 Trailing 12-month (TTM) value and volume decreased by 34% and 26%, respectively.5 Add-on transactions have represented roughly 78% of U.S. PE deal activity in 2023.6
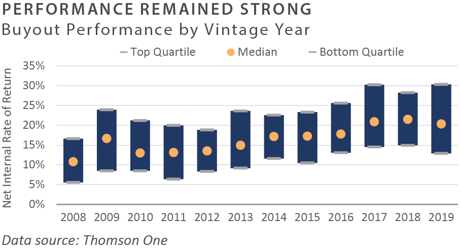
- North American PE purchase price multiples have contracted marginally. As of June 30, 2023, the TTM median private equity buyout purchase price multiple was 12.6x earnings before interest, taxes, depreciation, and amortization (EBITDA), and the TTM median Debt/EBITDA ratio was 4.2x EBITDA.7
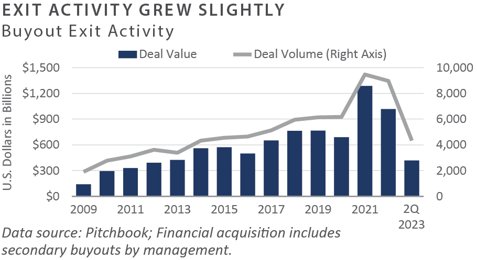
- U.S. PE exit activity ticked up slightly during the second quarter. Quarterly exit value grew 67% quarter-over-quarter, and quarterly exit activity was in line with the same period in the prior year.8 However, TTM exit value and volume were off 53% and 40%, respectively.9
- Private equity performance was strong through the fourth quarter of 2022. The spread between the top and bottom quartiles remained above 1,000 basis points.10
INVESTOR IMPLICATIONS
Higher interest rates and concerns about a macroeconomic slowdown have dampened private equity activity. Strong public market performance may alleviate concerns over the denominator effect in the near term. FEG expects an increase in market volatility for the remainder of 2023 is likely and recommends clients continue to be cautious with new commitments.
1, 2, 3, 4, 5, 6, 7, 8, 9 Pitchbook; Data of June 30, 2023
10 Refinitiv; Data as of December 31, 2022 (most recent available)
Private Debt
-
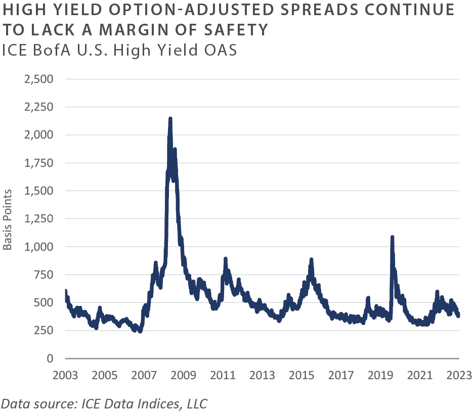
The second quarter of 2023 saw continued strength in the public credit markets despite a modest increase in defaults. High yield bonds gained 1.4%, with bank loans climbing 3%. High yield option-adjusted spreads remained tight at around 400 basis points.
-
Lackluster deal flow amid softness in the economy led to continued weakness in new issuance during the second quarter, with refinancings accounting for 63% of total deals.1
-
In the second quarter, private debt funds raised $71.2 billion in 34 closes, marking a strong return to the longer-term trend after weaker fundraising in the past two quarters.2
-
Mezzanine debt fundraising remained strong, bringing in $18 billion globally in the second quarter. The majority of private debt fundraising continues to come from direct lending.3
INVESTOR IMPLICATIONS
Sustained macroeconomic pressures in the U.S. and Europe, coupled with weakening credit characteristics, continue to provide a meaningful opportunity for private debt as an asset class. This holds true for both new lending opportunities to companies in need of capital and for distressed strategies.
1 Pitchbook – LCD Quarterly Review 2Q 2023
2, 3 Preqin Private Debt Report 2Q 2023
Private Real Estate
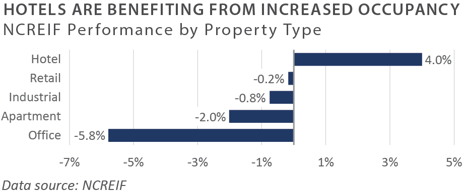
- The National Council of Real Estate Investment Fiduciaries (NCREIF) Property Index (NPI) declined 2.0% during the second quarter. On a trailing 1-year basis, the index has fallen 6.6%. Hotel properties outperformed as they continued to benefit from higher occupancy rates driven by increased travel. Market value-weighted cap rates based on appraisals for unsold properties in the index measured 4.2%. However, the average cap rate for properties sold during the quarter was significantly higher at 5.2%.1
- As measured by the FTSE NAREIT Index, public real estate securities posted a slight gain of 1.2% during the second quarter, following a gain in the first quarter.2 The disparity between public and private real estate market performance narrowed as private real estate funds began to report lower valuations. Compared to private real estate, real estate investment trust (REIT) valuations are more compelling on several metrics, including higher implied cap rates and lower debt levels.
- Private real estate transactions declined 64% year-over-year to $77.5 billion in the second quarter. Multifamily and retail sales volume showed the most substantial declines, falling 72% and 66%, respectively. Year-over-year pricing for multifamily declined 12%. The sector is facing headwinds from new deliveries and slower rent growth. While transaction volume in the hospitality sector was down 58% year-over-year, pricing showed a gain of 6%, the only property type with positive returns.3 More significant transactions during the quarter included Blackstone’s sale of 14 million square feet of industrial assets to Prologis for $3.1 billion and SL Green’s sale of a 49.9% stake in 245 Park Avenue in New York to Mori Trust for $2.0 billion.4
- In total, 82 private equity real estate funds raised approximately $57 billion during the second quarter. The number of funds in the market remained at a record high, with 2,183 funds seeking to raise $578 billion as of June 2023. Notably, in April, Blackstone completed fundraising on its tenth flagship private real estate fund, with total commitments of $30.4 billion, making it the largest private real estate fund ever raised.5
- Availability of credit for commercial real estate tightened significantly in the first half of the year, driven by concerns about distress in the market due to higher interest rates. Total domestic Commercial Mortgage-Backed Security (CMBS) issuance rose to just over $10 billion in the second quarter, an increase from the $6 billion issued during the first quarter. For the first half of the year, however, total issuance was down 67% compared to 2022.6 Looming commercial real estate debt maturities remain a key concern among investors, as an estimated $1.4 trillion in outstanding real estate debt—28% of the overall amount of $5 trillion—will mature in 2023 and 2024.7
INVESTOR IMPLICATIONS
Private real estate is in the early stages of what will likely be a multi-year downturn. While the office sector has garnered most of the headlines year-to-date, the sector comprises a relatively small portion of banks’ commercial real estate exposure, at 16.7% of total loans and only 3% of the overall REIT market.8 Multifamily and industrial comprise the bulk of real estate exposure for investors and banks, with these sectors seeing the majority of capital inflow in recent years. Hotels are holding up well, and retail has stabilized after a decade of distress. Given this backdrop, a critical factor in today’s market is the vast disparity between property types and geographies, making a flexible mandate crucial for managers allocating capital. Valuations will likely continue to reset lower, but transaction volume may begin to recover from lows reached mid-year. The current market is best characterized as a “long, slow grind lower.”
1 NCREIF; data of June 30, 2023
2 NAREIT, data as of June 30, 2023
3 Colliers, MSCI, July 27, 2023
4 Prologis, SL Green, June 26, 2023
5 Preqin, June 30, 2023
6 Trepp CMBS Research, Data as of July 2023
7, 8 Principal Asset Management, July 2023
NATURAL RESOURCES
-
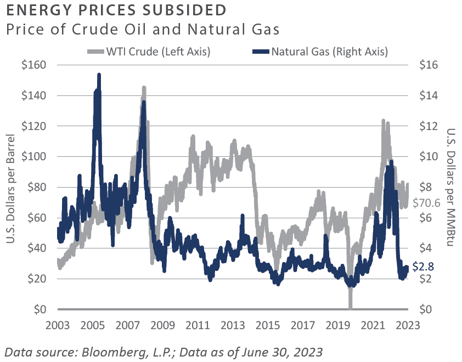
Oil prices fell 6.6% during the second quarter, closing at $70.64/barrel. Uncertain global economic conditions weighed on prices throughout the year's first half—particularly concerns about demand from China.1 OPEC+ announced two production cuts during the second quarter.
-
The latest International Energy Agency (IEA) report from July forecasts global oil demand to climb by 2.2 million barrels per day in 2023 to reach 102.1 mb/d, a new record.2 After quarter-end, oil prices rose 14% in July to above $80/barrel as investors focused on tightening global supply and record demand forecasts.
-
Natural gas prices rose 26% in the second quarter to close at $2.80/MMbtu compared to $2.22/MMBtu at the end of the first quarter. After warmer winter weather weighed on prices during the first quarter, reduced drilling activity and strong power generation demand positively impacted prices in the second quarter.3 Despite the quarterly gain, natural gas remained down approximately 32% year-to-date through mid-year. With the buildout of new export terminals, the U.S. is poised to expand its position as the world’s largest liquefied natural gas (LNG) exporter.
-
Over 20 upstream private energy firms were actively raising capital as of mid-year, with most expecting to continue marketing through year-end. Continued fossil fuel divestment initiatives and a focus on renewables or “energy transition” strategies by many institutions added to the headwinds facing upstream energy managers. Nevertheless, certain public pension funds, healthcare organizations, and a handful of endowments have continued to commit capital to the sector.
-
After falling to the lowest level in over 15 years during 2022, upstream mergers and acquisitions showed signs of recovery. In early April, EnCap announced the sale of multiple assets in the Permian Basin to Ovintiv for $4.2 billion. In June, Civitas Resources announced it would acquire oil and gas assets in the Permian Basin backed by private equity firm NGP Energy Capital Management for $4.7 billion.
-
The U.S. rig count declined during the second quarter as upstream energy companies remained cautious about capital spending. According to Baker Hughes, the total U.S. rig count declined 10.7%. The U.S. natural gas rig count finished the quarter down 22% and the U.S. oil rig count also fell, measuring a 7.9% decline. As a frame of reference, the U.S. oil rig count peaked at 1,600 nearly nine years ago and now measures only 545 rigs.
INVESTOR IMPLICATIONS
Despite solid returns over the past three years, upstream energy remains one of the only sectors within private capital that has not seen significant inflows. Ironically, improvement in performance has led to some investors being overweight relative to their targets, otherwise known as the “denominator effect.” Other investors remain on the sidelines due to fossil fuel divestment initiatives and a focus on energy transition strategies, which have attractive significant capital. On the flip side, pushback against environmental, social and corporate governance strategies has gained traction over the past year, and there is a growing recognition that fossil fuels will remain a vital part of the energy mix for years to come. Thus, we believe an “all of the above” approach to energy that includes both traditional and renewable sources will likely be needed in the coming years. The move toward electrification—widespread adoption of electric vehicles, etc.— globally will continue to drive power demand, and the evolving energy landscape presents a robust opportunity set for investors in the coming years.
1, 3 Energy Information Administration, www.eia.gov, June 30, 2023
2 International Energy Agency Oil Market Report, July 2023
INDICES
Bloomberg US Corporate High Yield Index represents the universe of fixed rate, non-investment grade debt. Eurobonds and debt issues from countries designated as emerging markets are excluded, but Canadian and global bonds (SEC registered) of issuers in non-EMG countries are included. The index includes the corporate sectors: Industrials, Utilities, and Finance, encompassing both U.S. and non-U.S. Corporations. See www.bloomberg.com for more information.
The Russell Indices are constructed by Russell Investment. There are a wide range of indices created by Russell covering companies with different market capitalizations, fundamental characteristics, and style tilts. See www.russellinvestments.com for more information.
The FTSE NAREIT Composite Index (NAREIT) includes only those companies that meet minimum size, liquidity and free float criteria as set forth by FTSE and is meant as a broad representation of publicly traded REIT securities in the U.S. Relevant real estate activities are defined as the ownership, disposure, and development of income-producing real estate. See www.ftse.com/Indices for more information.
The S&P 500 Index is capitalization-weighted index of 500 stocks. The S&P 500 Index is designed to measure performance of the broad domestic economy through changes in the aggregate market value of 500 stocks representing all major industries.
The NCREIF Property Index is a quarterly time series composite total rate of return measure of investment performance of a very large pool of individual commercial real estate properties acquired in the private market for investment purposes only.
HFRI ED: Distressed/Restructuring Index — Distressed/Restructuring strategies which employ an investment process focused on corporate fixed income instruments, primarily on corporate credit instruments of companies trading at significant discounts to their value at issuance or obliged (par value) at maturity as a result of either formal bankruptcy proceeding or financial market perception of near term proceedings. Managers are typically actively involved with the management of these companies, frequently involved on creditors' committees in negotiating the exchange of securities for alternative obligations, either swaps of debt, equity or hybrid securities. Managers employ fundamental credit processes focused on valuation and asset coverage of securities of distressed firms; in most cases portfolio exposures are concentrated in instruments which are publicly traded, in some cases actively and in others under reduced liquidity but in general for which a reasonable public market exists. In contrast to Special Situations, Distressed Strategies employ primarily debt (greater than 60%) but also may maintain related equity exposure.
Information on any indices mentioned can be obtained either through your advisor or by written request to information@feg.com.
DISCLOSURES
This report was prepared by Fund Evaluation Group, LLC (FEG), a federally registered investment adviser under the Investment Advisers Act of 1940, as amended, providing non-discretionary and discretionary investment advice to its clients on an individual basis. Registration as an investment adviser does not imply a certain level of skill or training. The oral and written communications of an adviser provide you with information about which you determine to hire or retain an adviser. Fund Evaluation Group, LLC, Form ADV Part 2A & 2B can be obtained by written request directly to: Fund Evaluation Group, LLC, 201 East Fifth Street, Suite 1600, Cincinnati, OH 45202, Attention: Compliance Department.
The information herein was obtained from various sources. FEG does not guarantee the accuracy or completeness of such information provided by third parties. The information in this report is given as of the date indicated and believed to be reliable. FEG assumes no obligation to update this information, or to advise on further developments relating to it. FEG, its affiliates, directors, officers, employees, employee benefit programs and client accounts may have a long position in any securities of issuers discussed in this report.
Index performance results do not represent any managed portfolio returns. An investor cannot invest directly in a presented index, as an investment vehicle replicating an index would be required. An index does not charge management fees or brokerage expenses, and no such fees or expenses were deducted from the performance shown.
Bloomberg Data Disclosure: Source- Bloomberg Index Services Limited. BLOOMBERG® is a trademark and service mark of Bloomberg Finance L.P. and its affiliates (collectively “Bloomberg”). Bloomberg or Bloomberg’s licensors own all proprietary rights in the Bloomberg Indices. Bloomberg does not approve or endorse this material or guarantee the accuracy or completeness of any information herein, nor does Bloomberg make any warranty, express or implied, as to the results to be obtained therefrom, and, to the maximum extent allowed by law, Bloomberg shall not have any liability or responsibility for injury or damages arising in connection therewith.
Neither the information nor any opinion expressed in this report constitutes an offer, or an invitation to make an offer, to buy or sell any securities.
Any return expectations provided are not intended as, and must not be regarded as, a representation, warranty or predication that the investment will achieve any particular rate of return over any particular time period or that investors will not incur losses.
Past performance is not indicative of future results.
Investments in private funds are speculative, involve a high degree of risk, and are designed for sophisticated investors.
An investor could lose all or a substantial amount of his or her investment. Private capital funds’ fees and expenses may offset private capital funds’ profits. Private capital funds are not required to provide periodic pricing or valuation information to investors except as defined in the fund documents. Private capital funds may involve complex tax structures and delays in distributing important tax information. Private capital funds are not subject to the same regulatory requirements as mutual funds. Private capital funds are not liquid and require investors to commit to funding capital calls over a period of several years; any default on a capital call may result in substantial penalties and/or legal action. Private capital fund managers have total authority over the private capital funds. The use of a single advisor applying similar strategies could mean lack of diversification and, consequently, higher risk.
All data is as of June 30, 2023 unless otherwise noted.