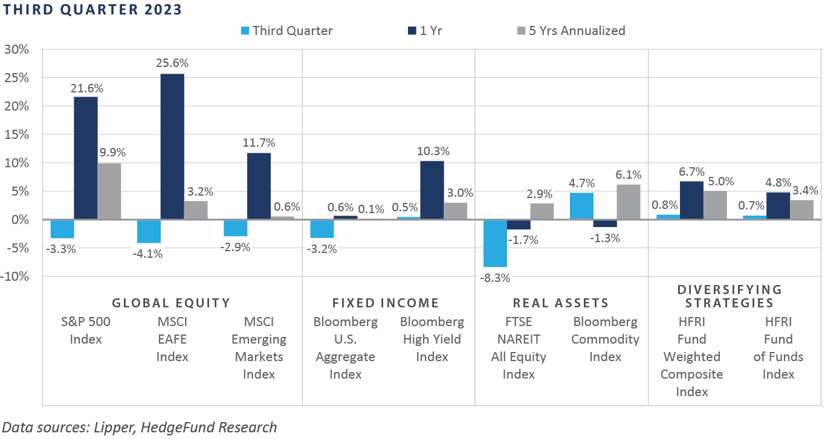
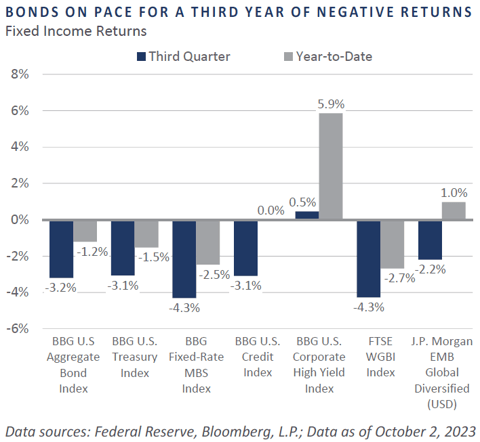
Volatility across the financial markets remained elevated for the second consecutive month to end the quarter, as a hawkish pause by the Federal Reserve (Fed) helped support a further rise across Treasury interest rates and served as a primary headwind to performance across many key areas of the investment markets. Global equity performance was overwhelmingly negative during the third quarter, particularly among the interest rate-sensitive growth indices, as well as smaller capitalization areas of the market. Despite the pullback across equities since July and continued upward pressure on the U.S. dollar, emerging market equities relatively outperformed domestic. Similar to equities, bond returns were mostly negative, with notable weakness emanating out of the rate-sensitive sectors. Absent a sharp trend reversal across interest rates in the final quarter of 2023, the Bloomberg U.S. Aggregate Bond Index remains at risk of posting an unprecedented third consecutive annual decline, with a year-to-date total return of -1.2% through September. Real asset returns appeared mixed, with the interest rate and economically sensitive real estate investment trust (REIT) and global listed infrastructure categories witnessing steep losses. However, strong gains were witnessed among commodity and energy-related indices.
Economic Update
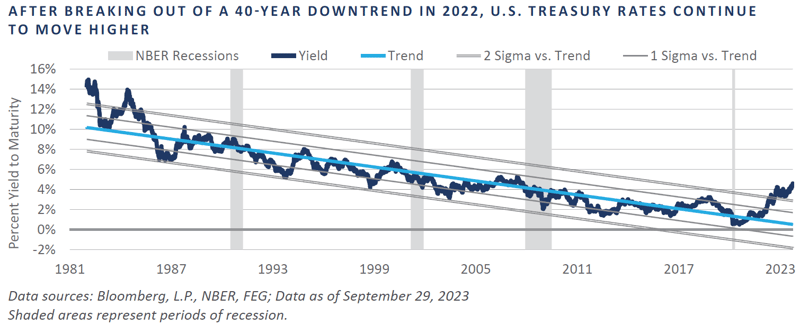
U.S. Treasury Rates Surge to Highest Level since 2007 as Fed Maintains Hawkish Posture
Global investors endured significant pain throughout the calendar year 2022 as the Fed’s campaign to restore price stability resulted in a significant tightening in both monetary and broader financial conditions, which in turn drove volatility sharply higher across many key global asset classes and categories. Investors breathed a sigh of relief through the first seven months of 2023 as interest rate volatility moderated, the economy continued to expand at a healthy pace, and a potential end to the Fed’s tightening cycle seemed to be on the horizon, all of which helped buttress the “soft landing” narrative.
Hopes for a soft landing were further supported by revisions to the Fed’s Summary of Economic Projects (SEP) at the Federal Open Market Committee’s (FOMC) late-September policy meeting, which saw upward revisions to forecasts over the coming years related to inflation-adjusted growth and the labor market. The upward revisions to the economic forecasts, however, were joined with downward revisions related to the likelihood of meaningful cuts to the policy rate in 2024, which supported the tighter-for-longer sentiment that has percolated in recent months. Prospects for a slower-than-anticipated reversal in Fed tightening have helped push Treasury prices sharply lower—and yields higher—since July, a move which has propelled the 10-Year Treasury Note yield to its highest level since 2007.
The relentless rise in Treasury rates since May has come at an incredibly inopportune time, as a deluge of Treasury issuance has hit the market since the debt ceiling impasse was resolved in early June. From June 1 to October 3, total public debt outstanding swelled to well over $33 trillion, with an astonishing $2 trillion increase in only four months’ time. The combination of a ballooning federal debt burden and spiking interest rates compounds an already unstable fiscal situation, which includes a Treasury budget deficit that stood at nearly 8% as a share of nominal Gross Domestic Product (GDP) as of July, a sobering read on the fiscal situation that could deteriorate further, should the economy buckle under the weight of Fed-induced monetary restraint.
Moreover, the Fed’s 5.4% interest rate paid on more than $3 trillion of commercial banking system reserve assets has resulted in a net operating loss exceeding $100 billion. This loss would appear even more dramatic if the Fed were required to mark its balance sheet assets to market, as a significant portion of the assets were purchased when interest rates were much lower—and bond prices higher—in 2020 and early 2021. As of June 30, 2023, the Fed’s combined quarterly financial report noted a $1 trillion cumulative unrealized loss on its security holdings.
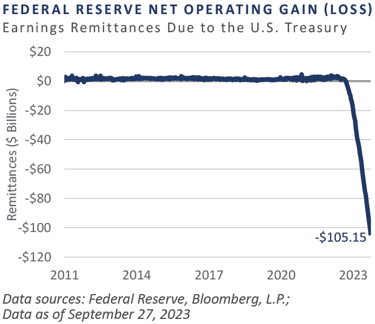
Ordinarily, the Fed’s income from its balance sheet assets more than offsets its operating expenses, resulting in a net surplus that is remitted to the U.S. Treasury, in turn reducing the Treasury budget deficit. When the Fed is operating at a net loss, however, the opposite effect takes hold, exacerbating an already-wide Treasury budget deficit.
To conclude, after falling behind the eight ball in the management of the price stability half of its dual mandate and allowing inflationary momentum to accelerate well above its 2% targeted level, the Fed’s quest to restore price both stability and credibility has resulted in a sharp rise in the policy rate and Treasury rates. In turn, negatively impacting the rate-sensitive pockets of the financial markets and the broader economy. While sentiment for an economic soft landing permeated throughout the investment community in the first half of the year, this narrative has been increasingly called into question since July, as a robust economic situation, continued labor market tightness, spiking oil prices, and hawkish Fed forward guidance have reintroduced concerns for a hard landing. The potentiality of which could result in a continuation of the financial market volatility investors have endured since July until a reset of the business cycle is observed.
Market Summary
Global Equity
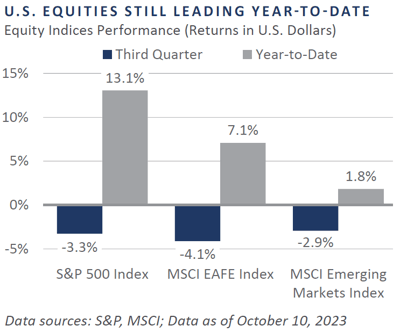
After a strong risk-on rally in the summer, equity markets sentiment shifted over the quarter, pressured by a significant rise in bond yields and commitments to higher-for-longer monetary policy from central banks globally. The decline in equity returns was broad-based, led by rate-sensitive sectors such as real estate and information technology (IT).
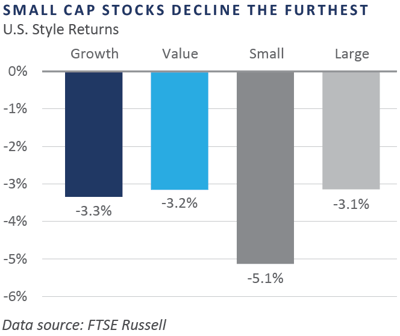
Amid the rising rate environment, value stocks outperformed growth stocks, as the growth stocks’ valuations are often more sensitive to long-term discount rates. Additionally, large cap outperformed small cap equities, which tend to face higher interest rate expenses.
Energy stocks remained resilient over the quarter as oil traded above $90 per barrel. Meanwhile, stock prices of many members of the “Magnificent Seven” fell, which weighed on the Russell 1000 and S&P 500 indices due to the significant concentration levels in the largest market capitalization stocks.
European stocks declined in the quarter. Consumer discretionary shares were the weakest due in part to concerns about elevated interest rates pressuring consumers. IT also declined as higher interest rates influenced the discount rate applied to longer-duration positions not only in the U.S. but internationally as well.
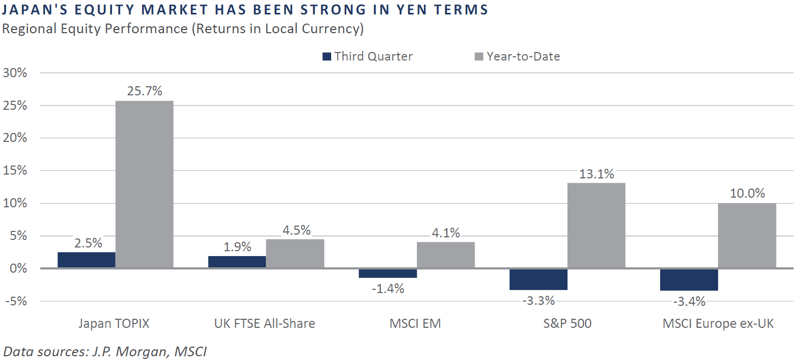
Unlike other developed markets, UK equities rose in local currencies. The UK’s significant exposure to the energy and materials sector benefited performance as those sectors led the market. Domestically focused small cap and mid cap equities rebounded amid a rise in UK consumer confidence. Even domestic banks and real estate equities posted modest returns.
Japanese equities saw continued strong performance in local currency. Solid earnings results were supported by the weakening of the yen, and strong domestic demand contributed to solid equity returns. Akin to the U.S., rising interest rates negatively impacted growth equities in Japan, particularly in semiconductor-related industries. Meanwhile, value stocks, such as regional banks, energy, and auto industries, were additive to the market’s performance.
Emerging markets equities declined over the quarter. The concerns of the Chinese property market resurfaced as two of the largest property companies faced difficult financial conditions. Taiwan and Korea underperformed the broader index as IT and semiconductors were challenged. Conversely, markets like the United Arab Emirates (UAE) and other energy exporters benefited from the increase in oil prices.
Fixed Income
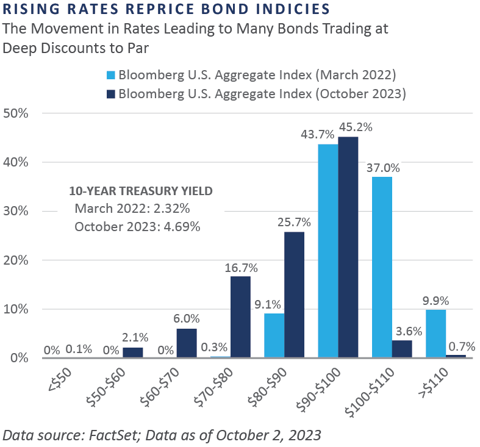
The summer’s interest rate sell-off intensified in the third quarter as a confluence of fiscal policy, monetary policy, and economic developments fueled a rise in interest rates. The long end of the yield curve bore the brunt of the sell-off, leading to a material bear steepening of the curve. The 2- and 10-year Treasury yields rose to reach 5.12% and 4.59%, respectively. With the rise in the 10-year yield outpacing the 2-year, the 10-year/2-year Treasury spread steepened 0.62% to -0.44%, with the majority of the steepening—roughly 0.50%—taking place in September.
In the 1980s, Economist Ed Yardeni coined the phrase “bond vigilante” in response to the sell-off in interest rates thought to be caused by investors' distaste for the government's fiscal policies. Moody’s again highlighted governance concerns in September, encapsulating growing emphasis on U.S. fiscal policy trends. The long end of the yield curve is historically correlated to the outlook on economic growth, inflation expectations, and fiscal health. Contemporary bond vigilantes cite mounting fiscal deficits, increased Treasury issuance, and the rising sovereign interest burden as motivators for the recent sell-off in interest rates.
The broad decrease in risk appetite during the quarter hit the credit markets in September. The yield to worst (YTW) on the high yield index rose roughly 0.5% during September to reach 8.9% on the back of rising credit spreads and base rates. While credit spreads remain tight on a historical basis, reflecting minimal compensation for credit risk, the YTW on below investment grade credit has improved considerably.
Real Assets
REAL ESTATE
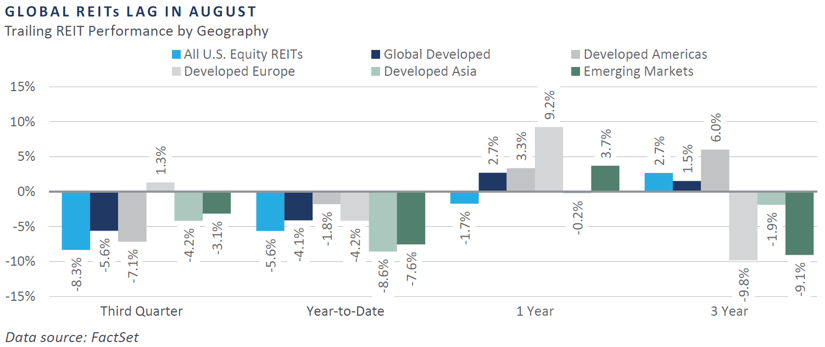
Global Real Estate Investment Trust (REIT) indices declined steeply in August amid a sell-off across risk assets. The market is now pricing in higher interest rates for longer due to the Fed’s hawkish stance on inflation, resulting in higher borrowing costs for REITs.
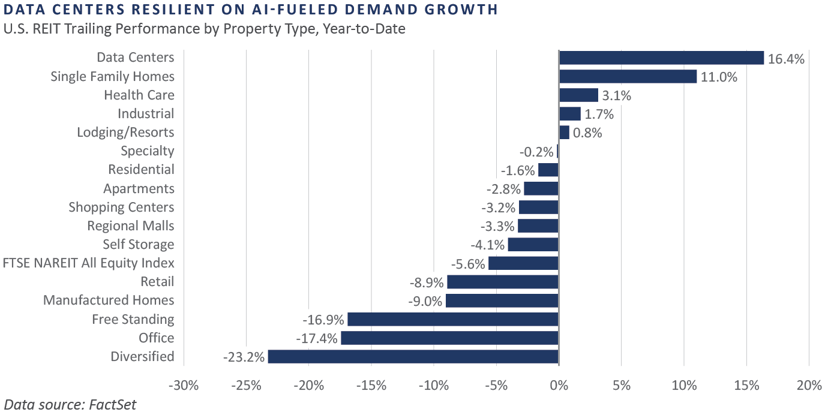
All U.S. and global REIT sub-sector returns were negative during the third quarter. Year-to-date, the data center sub-sector index rose over 16% due to decade-low vacancy rates driven by cloud computing and upbeat expectations for artificial intelligence (AI). Single-family REIT returns remained positive for 2023 as consumers chose rental properties over home purchases due to rising mortgage rates and elevated home values.
NATURAL RESOURCES
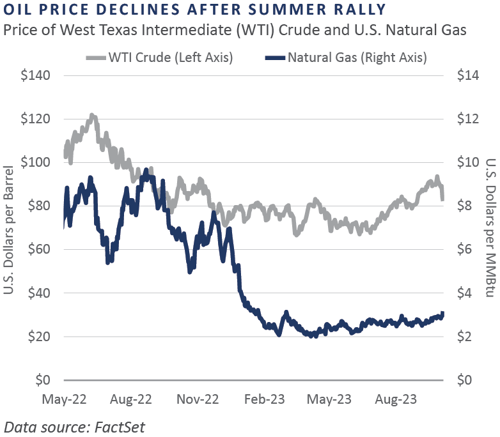
Oil prices, as measured by West Texas Intermediate (WTI), continued to rise, surpassing $93 per barrel and boosting commodity returns. WTI’s elevated price started to deteriorate into October, falling roughly $10 per barrel in 10 days, partly due to seasonal demand, despite continued production cuts from OPEC+ countries.
Gasoline prices declined to a greater magnitude than oil during the same time period, as measured by the RBOB Gasoline Continuous Contract. The accumulation of U.S. gasoline stockpiles at the conclusion of the peak summer season, in contrast to typical seasonal patterns, led to the downturn in gasoline prices.
INFRASTRUCTURE
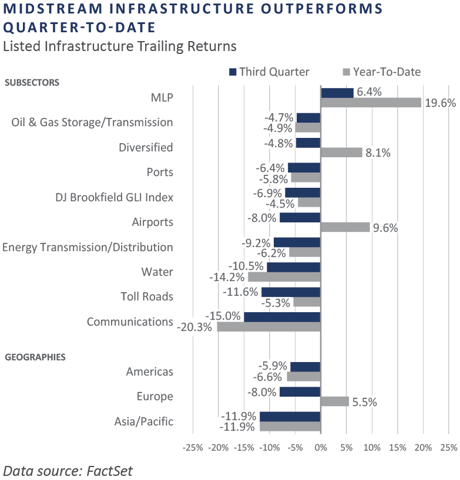
Global infrastructure, excluding midstream energy and marine ports, underperformed in September. Master Limited Partnership (MLP) energy infrastructure was the only sub-sector with positive returns. Midstream energy infrastructure has benefitted this summer due to the rally in oil prices as OPEC+ continued to cut back on supply.
Diversifying Strategies
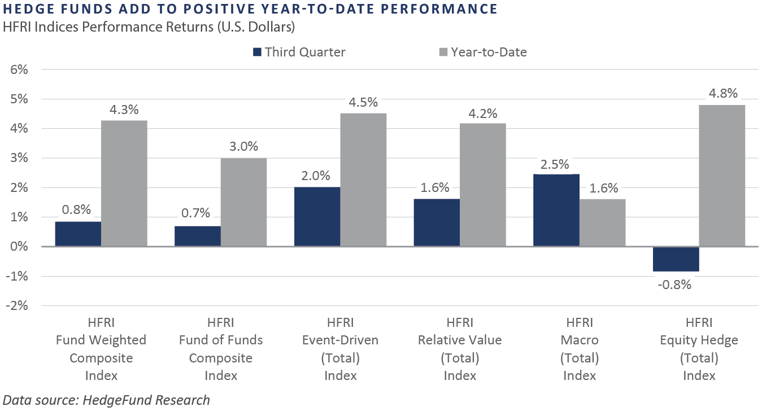
Hedge fund returns were slightly positive over the quarter, adding to solid year-to-date performance. The HFRI Equity-Hedge Index was the largest detractor to composite index performance. The HFRI Event-Driven Index, the HFRI Relative Value Index, and the HFRI Macro Index all posted positive returns. Hedged equity started the quarter with strong performance but quickly reverted in the back half.
Hedged Equity benefited from a market rally, which coincided with an increase in long-net equity positions. However, the increase was primarily an outcome of covering short positions rather than adding to long positions. Hedge funds began re-building their short book as equities began to sell off.
Following a disappointing August, macro-funds ended the quarter on a high note. Macro’s success in the third quarter was primarily driven by crude oil tailwinds. The HFRI Macro Commodity Index was up 4.8% compared to the HFRI Currency Index, up 1.2%. Systematic macro outperformed discretionary in September as trend-followers were able to ramp up positions and take advantage of considerable momentum swings.
INDICES
The Alerian MLP Index is a composite of the 50 most prominent energy Master Limited Partnerships that provides investors with an unbiased, comprehensive benchmark for this emerging asset class.
Bloomberg Fixed Income Indices is an index family comprised of the Bloomberg US Aggregate Index, Government/Corporate Bond Index, Mortgage-Backed Securities Index, and Asset-Backed Securities Index, Municipal Index, High-Yield Index, Commodity Index and others designed to represent the broad fixed income markets and sectors. On August 24, 2016, Bloomberg acquired these long-standing assets from Barclays Bank PLC. and on August 24, 2021, they were rebranded as the Bloomberg Fixed Income Indices. See https://www.bloomberg.com/markets/rates-bonds/bloomberg-fixed-income-indices for more information.
The CBOE Volatility Index (VIX) is an up-to-the-minute market estimate of expected volatility that is calculated by using real-time S&P 500 Index option bid/ask quotes. The Index uses nearby and second nearby options with at least eight days left to expiration and then weights them to yield a constant, 30-day measure of the expected volatility of the S&P 500 Index.
FTSE Real Estate Indices (NAREIT Index and EPRA/NAREIT Index) includes only those companies that meet minimum size, liquidity and free float criteria as set forth by FTSE and is meant as a broad representation of publicly traded real estate securities. Relevant real estate activities are defined as the ownership, disposure, and development of income-producing real estate. See https://www.ftserussell.com/index/category/real-estate for more information.
HFRI Monthly Indices (HFRI) are equally weighted performance indexes, compiled by Hedge Fund Research Inc. (HFX), and are used by numerous hedge fund managers as a benchmark for their own hedge funds. The HFRI are broken down into 37 different categories by strategy, including the HFRI Fund Weighted Composite, which accounts for over 2,000 funds listed on the internal HFR Database. The HFRI Fund of Funds Composite Index is an equal weighted, net of fee, index composed of approximately 800 fund- of- funds which report to HFR. See www.hedgefundresearch.com for more information on index construction.
J.P. Morgan’s Global Index Research group produces proprietary index products that track emerging markets, government debt, and corporate debt asset classes. Some of these indices include the JPMorgan Emerging Market Bond Plus Index, JPMorgan Emerging Market Local Plus Index, JPMorgan Global Bond Non-U.S. Index and JPMorgan Global Bond Non-U.S. Index. See www.jpmorgan.com for more information.
Merrill Lynch high yield indices measure the performance of securities that pay interest in cash and have a credit rating of below investment grade. Merrill Lynch uses a composite of Fitch Ratings, Moody’s and Standard and Poor’s credit ratings in selecting bonds for these indices. These ratings measure the risk that the bond issuer will fail to pay interest or to repay principal in full. See www.ml.com for more information.
Morgan Stanley Capital International – MSCI is a series of indices constructed by Morgan Stanley to help institutional investors benchmark their returns. There are a wide range of indices created by Morgan Stanley covering a multitude of developed and emerging economies and economic sectors. See www.morganstanley.com for more information.
The FTSE Nareit All Equity REITs Index is a free-float adjusted, market capitalization-weighted index of U.S. equity REITs.
Russell Investments rank U.S. common stocks from largest to smallest market capitalization at each annual reconstitution period (May 31). The primary Russell Indices are defined as follows: 1) the top 3,000 stocks become the Russell 3000 Index, 2) the largest 1,000 stocks become the Russell 1000 Index, 3) the smallest 800 stocks in the Russell 1000 Index become the Russell Midcap index, 4) the next 2,000 stocks become the Russell 2000 Index, 5) the smallest 1,000 in the Russell 2000 Index plus the next smallest 1,000 comprise the Russell Microcap Index, and 6) U.S. Equity REITs comprise the FTSE Nareit All Equity REIT Index. See www.russell.com for more information.
S&P 500 Index consists of 500 stocks chosen for market size, liquidity and industry group representation, among other factors by the S&P Index Committee, which is a team of analysts and economists at Standard and Poor’s. The S&P 500 is a market-value weighted index, which means each stock’s weight in the index is proportionate to its market value and is designed to be a leading indicator of U.S. equities, and meant to reflect the risk/return characteristics of the large cap universe. See www.standardandpoors.com for more information.
Information on any indices mentioned can be obtained either through your advisor or by written request to information@feg.com.
DISCLOSURES
This report was prepared by FEG (also known as Fund Evaluation Group, LLC), a federally registered investment adviser under the Investment Advisers Act of 1940, as amended, providing non-discretionary and discretionary investment advice to its clients on an individual basis. Registration as an investment adviser does not imply a certain level of skill or training. The oral and written communications of an adviser provide you with information about which you determine to hire or retain an adviser. Fund Evaluation Group, LLC, Form ADV Part 2A & 2B can be obtained by written request directly to: Fund Evaluation Group, LLC, 201 East Fifth Street, Suite 1600, Cincinnati, OH 45202, Attention: Compliance Department.
The information herein was obtained from various sources. FEG does not guarantee the accuracy or completeness of such information provided by third parties. The information in this report is given as of the date indicated and believed to be reliable. FEG assumes no obligation to update this information, or to advise on further developments relating to it. FEG, its affiliates, directors, officers, employees, employee benefit programs and client accounts may have a long position in any securities of issuers discussed in this report.
Index performance results do not represent any managed portfolio returns. An investor cannot invest directly in a presented index, as an investment vehicle replicating an index would be required. An index does not charge management fees or brokerage expenses, and no such fees or expenses were deducted from the performance shown.
Bloomberg Index Services Limited. BLOOMBERG® is a trademark and service mark of Bloomberg Finance L.P. and its affiliates (collectively “Bloomberg”). Bloomberg or Bloomberg’s licensors own all proprietary rights in the Bloomberg Indices. Bloomberg does not approve or endorse this material or guarantee the accuracy or completeness of any information herein, nor does Bloomberg make any warranty, express or implied, as to the results to be obtained therefrom, and, to the maximum extent allowed by law, Bloomberg shall not have any liability or responsibility for injury or damages arising in connection therewith.
Neither the information nor any opinion expressed in this report constitutes an offer, or an invitation to make an offer, to buy or sell any securities.
Any return expectations provided are not intended as, and must not be regarded as, a representation, warranty or predication that the investment will achieve any particular rate of return over any particular time period or that investors will not incur losses.
Past performance is not indicative of future results.
Investments in private funds are speculative, involve a high degree of risk, and are designed for sophisticated investors.
All data is as of September 30, 2023 unless otherwise noted.