Despite a notably steep “wall of worry” that included ongoing banking system strains, persistent inflationary pressures, the most aggressive Federal Reserve (Fed) tightening campaign in four decades, elevated valuations across most major risky asset sectors, and unresolved geopolitical headwinds—e.g., Russia-Ukraine war, slumping Chinese economy, euro area at/near recession—performance across the financial markets in the second quarter appeared overwhelmingly positive. Domestic asset classes and sectors generally witnessed more robust performance during the quarter than their international brethren, reflecting the U.S. economy’s relative resilience amid incrementally tighter monetary conditions and souring global economic momentum. Incoming U.S. economic data over the quarter continued to surprise to the upside, however, which suggests the Fed’s efforts at tamping inflation and engineering a modest amount of demand destruction are only partially complete.
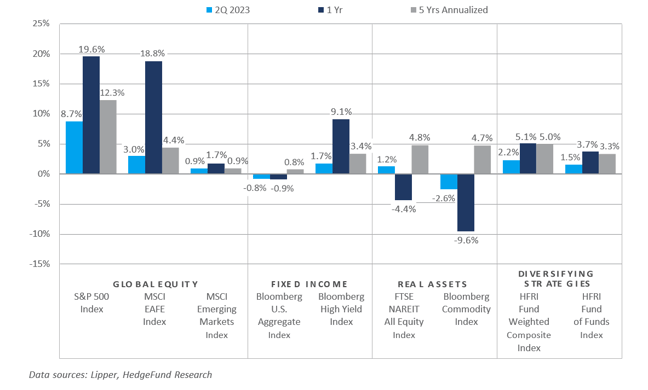
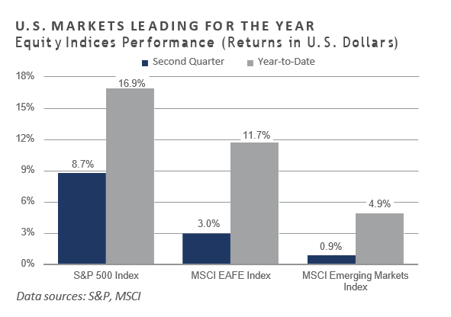
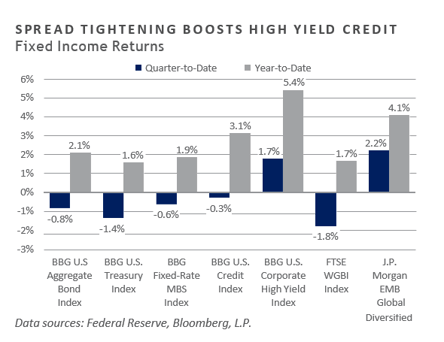
Significant performance gains were experienced within the mega-cap technology sector in the second quarter despite the space’s embedded interest rate sensitivity. Small and microcap equities also posted positive performance but lagged their larger cap counterparts meaningfully. International developed and emerging market equities underperformed domestic equity indices for the second quarter, with fundamental challenges coming into focus— particularly in China and across the euro area. Bond returns were mixed, with higher quality and rate-sensitive sectors lagging the shorter duration and credit-oriented sectors as rates saw a material increase and credit spreads tightened. Real asset performance was similarly mixed, with a seemingly deflating global economic engine serving as a headwind to commodity prices and real estate and global listed infrastructure sectors posting essentially flat performance.
Economic Update
At their mid-June policy meeting, the Fed maintained the 5.25% targeted upper bound on the federal funds rate, a decision that market participants had largely priced in throughout the weeks that preceded the announcement. Through updates to their Summary of Economic Projections (SEP)—including a refreshed “dot plot” overview of where committee members expect the appropriate rate of the policy rate should stand in the coming quarters— the Fed opened the door for future rate hikes. Notably, Chairman Jerome Powell described the July 25-26 meeting as “live” numerous times during the post-announcement press conference.
After more than a year of tightening monetary conditions, which included ongoing quantitative tightening and a 500-basis-point increase to the policy rate to date, the Fed appears close to declaring “mission accomplished.” Supporting this potential shift in the trajectory of monetary accommodation is a significant deceleration in the rate-of-change of inflation; while still elevated versus the Fed’s 2% desired level, both core and, more so, headline inflation rates have trended lower in recent months.
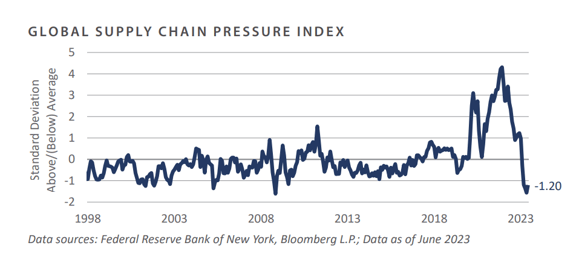
Annual headline consumer price inflation, for example, reached a cyclical peak of 9.1% in June 2022 but deflated to a more modest 4.0% pace through May 2023. Core inflation has followed a similar downward path, albeit at a more measured decelerating pace. Central to the disinflationary pressures that have surfaced in recent months are global supply chain bottlenecks which have largely been worked off. In fact, the New York Federal Reserve’s gauge of global supply chain pressures reflects the greatest spare capacity among global supply chains since the end of the Global Financial Crisis, a trend that may help dampen further inflationary gains.
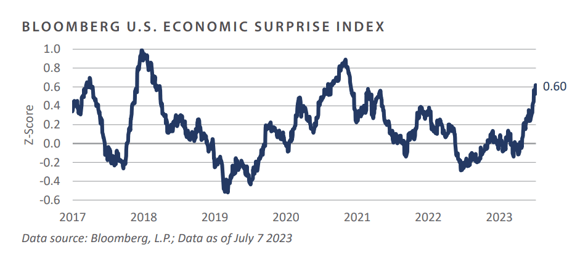
The flip side of the decelerating path of inflation is the U.S. economy’s pronounced resiliency. Despite the most aggressive Fed tightening campaign in over 40 years and percolating economic weakness abroad, incoming U.S. economic data has predominantly surprised to the upside since March. Indeed, the Bloomberg U.S. Economic Surprise Index spent the second quarter trending higher, lending some credence to the “soft landing” narrative— one which had seemed a near impossibility during the brief banking system crisis this past spring.
It would be premature to declare smooth sailing for the U.S. economy as growth rates across leading economic indicators continue to suggest a downturn is likely in the coming quarters. Moreover, the labor market, while strong in absolute terms, has exhibited few signs of further improvement/tightening; the slope of the Treasury yield curve remains deeply inverted; the manufacturing sector—a historically reliable harbinger of swings in the business cycle—has appeared stuck in contraction for nearly the past eight months; and sticky inflation, while on a clear downward trajectory, remains stubbornly elevated and at risk of reaccelerating should the Fed fail at fully restoring price stability given the historically tight labor situation.
To conclude, the second quarter of 2023 presented global investors with outsized performance gains across many widely followed asset classes and categories, particularly in the U.S., where investors embraced the renewed potential for an economic soft landing amid relatively strong incoming economic data and cooling inflation, a scenario seemingly off the table just a few months ago. Relatedly, the risk-on sentiment that permeated the investment community during the quarter served to underpin a meaningful increase in many commonly referenced valuation measures, which, when paired with stubborn fundamental headwinds, continues to demand a cautious approach when flexing risk budgets over the near-term.
Market Summary
Global Equity
- Global equity markets finished the quarter with positive returns, led by U.S. equity markets. The June U.S. jobs report showed 497,000 jobs added, a significant surprise to the Positive economic data coupled with positive momentum supported a risk- on environment.
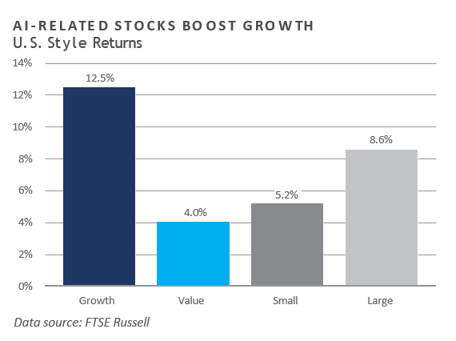
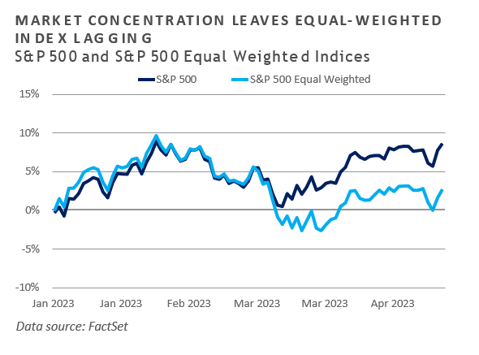
- U.S. equity markets ended the quarter higher, with most of the performance seen in June. Growth outperformed value by over eight percentage points over the quarter, led by the information technology, consumer discretionary, and communication services sectors. The theme of artificial intelligence (AI) was prevalent, benefiting chipmakers, as they are essential to the industry. Energy and utilities were the worst performers in the face of slowing global demand.
- European equities produced positive returns. The financial Sector was the top performer, driven by improved expectations of near-term bank earnings. Similar to the U.S., AI themes benefited semiconductor stocks.
- UK equity returns were slightly positive in U.S. dollar terms (USD) but down slightly in local currency. The UK market’s significant exposure to energy and materials weighed on the country’s performance due primarily to slowing demand and downward price pressures.
- Japanese equities finished the quarter with a gain of over 15% in local terms but under 7% in U.S. dollar terms due to the yen's weakness. The Bank of Japan's dovish stance has led to increasing divergence in interest rate expectations versus other central banks, driving the yen's continued depreciation relative to the USD.
- Emerging market equities posted with a slight gain. The AI market theme benefited countries with significant technology presence, like Taiwan and Korea. The Latin American region was a bright spot within emerging markets, gaining 14%, led by Brazil amid expectations for rate cuts and continued growth. China’s slow economic recovery hampered its equity market, which declined almost 10% and offset gains elsewhere.
Fixed Income
- By the start of the second quarter, market participants had priced in multiple rate cuts through the end of 2023. At the June Federal Open Market Committee (FOMC) meeting, voting members projected the median federal funds rate to surpass the previously expected level to an implied level of 5.6%. Supported by the Fed’s hawkish guidance and strong economic data, expectations of interest rate cuts were swiftly removed from futures markets while Treasury yields raced higher. The 2-year Treasury yields rose 81 bps to 4.87%, and the 10-year Treasury yields rose 33 bps to 3.81% during the second quarter. The asymmetry in the magnitude of increases in the shorter and longer parts of the yield curve resulted in the 10-2 year Treasury yield spread reaching its deepest inversion in more than 40 years.
- Credit sectors continued to benefit from resilient spreads, which saw further tightening over the second quarter. Since the end of the first quarter, investment grade (IG) spreads tightened 14 bps to 1.3%, and high yield (HY) spreads tightened 44 bps to 4.1%. Overall yields for the credit sectors have reached favorable levels for investors. However, most of the movement has been influenced by the Fed’s monetary policy, which has driven an increase of more than 5% in the Fed funds rate since the beginning of 2022. Spreads, on the other hand, have tightened with the broader risk rally. All-in yield levels still look attractive across corporate credit despite credit spreads sitting closer to the low end of their historical range.
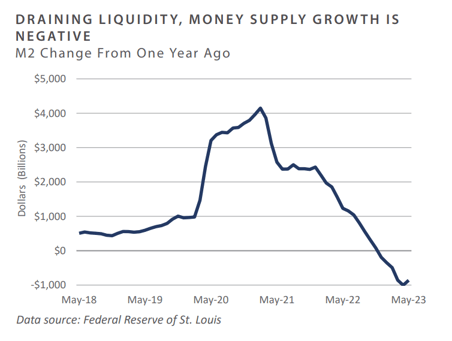
- Following the resolution of the debt ceiling crisis in the second quarter, the Treasury turned its focus toward replenishing the Treasury General Account (TGA), which has been depleted over the past year. This has far-reaching consequences for capital markets, including the draining of liquidity from the market, as illustrated by the decline in the M2 money supply. At the same time, the Fed continues its monthly quantitative tightening in the form of reducing its balance sheet. The refilling of the TGA has primarily come from a reduction in the Fed’s Reverse Repo (RRP) facility as money market managers swap exposure at the RRP for newly issued Treasury bills. Thus far, the TGA rebuild has not materially impacted reserves in the banking system.
Real Assets
REAL ESTATE
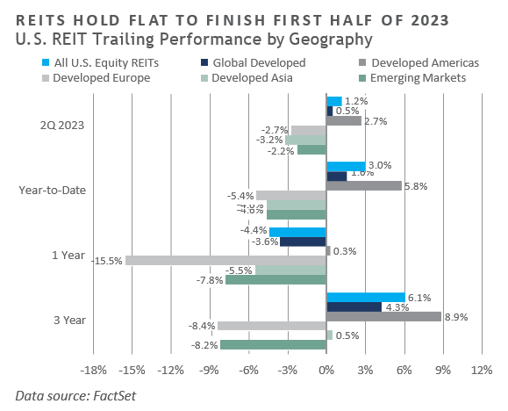
- Global real estate returns were mixed across geographies in June, with U.S. REITs outperforming international REITs. While dispersion among REIT sectors remains, REIT indexes are generally holding flat as real estate markets continue to seek guidance on future interest rate paths from central banks.
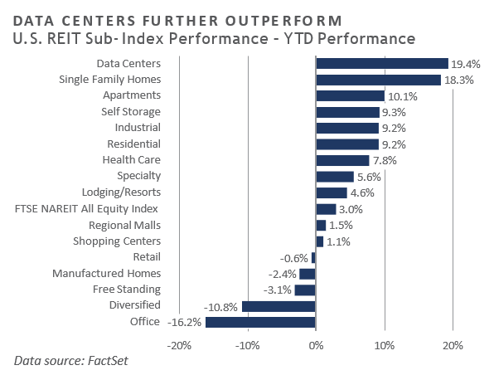
- Data center REITs outperformed through the first half of 2023 and were a top performer in June. Data centers entered 2023 having underperformed in 2022, and have benefitted from the push across industries to incorporate artificial intelligence (AI) capabilities. Residential REITs such as single-family homes and apartments also outperformed their broader index year-to-date—a sharp improvement after posting the lowest returns among REIT sectors the year prior.
NATURAL RESOURCES
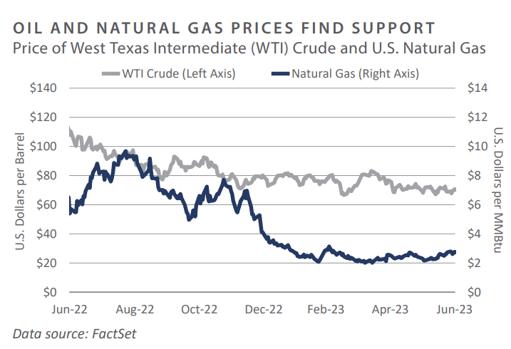
- Energy prices stabilized through the second quarter after dropping sharply at the end of 2022 and into the first quarter of 2023. Oil oscillated around $70/barrel as the market digested the significant production cuts announced by OPEC+ countries in early June, offset partly by weaker demand from China. Natural gas improved significantly in June and finished the second quarter in positive territory, with hotter-than- expected summer temperatures across the northern hemisphere contributing to increased demand.
- Both oil and natural gas prices appear to have found their respective price support levels after a year of record-high volatility. At the same time as OPEC+ producers have been laying down drilling rigs, most notably natural gas drilling rigs. Rig counts had been steadily increasing since the lows of the pandemic. However, recent price drawdowns have forced producers to pull back and wait for signs of price support.
INFRASTRUCTURE
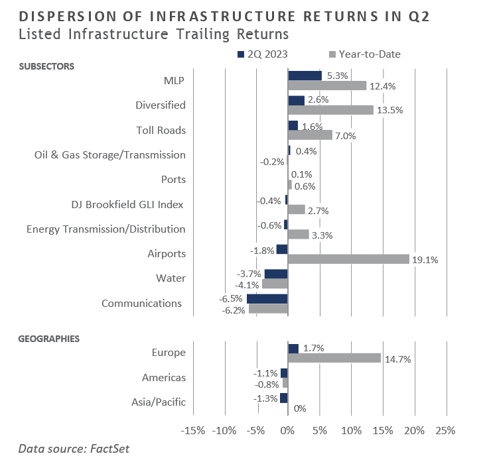
- Global listed infrastructure sub-sectors posted disparate performance. Master Limited Partnerships (MLPs) were the strongest performer, benefiting from rising natural gas prices. Communication infrastructure rallied in June but remained the worst performer, falling over 6% for the quarter, as investors digested the potentially delayed 5G rollout among carriers.
Diversifying Strategies
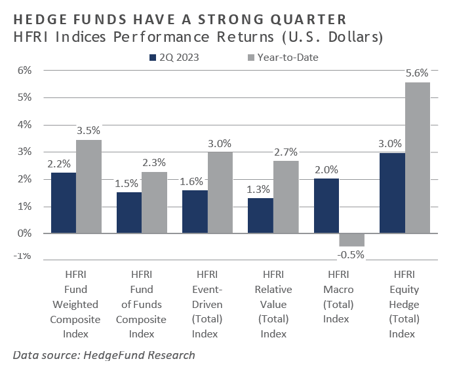
- Hedge fund returns were positive over the quarter, with the HFRI Fund Weighted Composite Index up 2.2%. Each strategy was in positive territory; the highest performer was the HFRI Equity Hedge (Total) Index, followed by the HFRI Macro Index and the HFRI Event-Driven Index.
- Macro strategies slightly rebounded following the regional bank-related rates move in March. Discretionary and systematic strategies were challenged in navigating global markets as the directionality of energy prices, metals, and rates in 2022 has yet to be replicated in 2023. OPEC+ supply cuts were met with uncertain global demand, making it difficult to trade around. Macro strategies were prompt to create positions around outlying sectors trending either positively or negatively, such as agricultural goods, which have been prone to supply chain disruptions.
- Trend following strategies broadly reeled in short U.S. rate positions in favor of more neutral holdings as leading indicators pointed toward June’s rate hike freeze. April was the largest month of global equities selling since March 2022, while May was the largest month of net buying of U.S. equities since 2010. Throughout the quarter, trend followers capitalized on this reversal, adding to equities as positive earnings data in large cap technology-related stocks outweighed continued fears surrounding regional bank liquidity pressure.
INDICES
The Alerian MLP Index is a composite of the 50 most prominent energy Master Limited Partnerships that provides investors with an unbiased, comprehensive benchmark for this emerging asset class.
Bloomberg Fixed Income Indices is an index family comprised of the Bloomberg US Aggregate Index, Government/Corporate Bond Index, Mortgage-Backed Securities Index, and Asset-Backed Securities Index, Municipal Index, High-Yield Index, Commodity Index and others designed to represent the broad fixed income markets and sectors. On August 24, 2016, Bloomberg acquired these long-standing assets from Barclays Bank PLC. and on August 24, 2021, they were rebranded as the Bloomberg Fixed Income Indices. See https://www.bloomberg.com/markets/rates-bonds/bloomberg-fixed-income-indices for more information.
The CBOE Volatility Index (VIX) is an up-to-the-minute market estimate of expected volatility that is calculated by using real-time S&P 500 Index option bid/ask quotes. The Index uses nearby and second nearby options with at least eight days left to expiration and then weights them to yield a constant, 30-day measure of the expected volatility of the S&P 500 Index.
FTSE Real Estate Indices (NAREIT Index and EPRA/NAREIT Index) includes only those companies that meet minimum size, liquidity and free float criteria as set forth by FTSE and is meant as a broad representation of publicly traded real estate securities. Relevant real estate activities are defined as the ownership, disposure, and development of income-producing real estate. See https://www.ftserussell.com/index/category/real-estate for more information.
HFRI Monthly Indices (HFRI) are equally weighted performance indexes, compiled by Hedge Fund Research Inc. (HFX), and are used by numerous hedge fund managers as a benchmark for their own hedge funds. The HFRI are broken down into 37 different categories by strategy, including the HFRI Fund Weighted Composite, which accounts for over 2,000 funds listed on the internal HFR Database. The HFRI Fund of Funds Composite Index is an equal weighted, net of fee, index composed of approximately 800 fund- of- funds which report to HFR. See www.hedgefundresearch.com for more information on index construction.
J.P. Morgan’s Global Index Research group produces proprietary index products that track emerging markets, government debt, and corporate debt asset classes. Some of these indices include the JPMorgan Emerging Market Bond Plus Index, JPMorgan Emerging Market Local Plus Index, JPMorgan Global Bond Non-U.S. Index and JPMorgan Global Bond Non-U.S. Index. See www.jpmorgan.com for more information.
Merrill Lynch high yield indices measure the performance of securities that pay interest in cash and have a credit rating of below investment grade. Merrill Lynch uses a composite of Fitch Ratings, Moody’s and Standard and Poor’s credit ratings in selecting bonds for these indices. These ratings measure the risk that the bond issuer will fail to pay interest or to repay principal in full. See www.ml.com for more information.
Morgan Stanley Capital International – MSCI is a series of indices constructed by Morgan Stanley to help institutional investors benchmark their returns. There are a wide range of indices created by Morgan Stanley covering a multitude of developed and emerging economies and economic sectors. See www.morganstanley.com for more information.
The FTSE Nareit All Equity REITs Index is a free-float adjusted, market capitalization-weighted index of U.S. equity REITs.
Russell Investments rank U.S. common stocks from largest to smallest market capitalization at each annual reconstitution period (May 31). The primary Russell Indices are defined as follows: 1) the top 3,000 stocks become the Russell 3000 Index, 2) the largest 1,000 stocks become the Russell 1000 Index, 3) the smallest 800 stocks in the Russell 1000 Index become the Russell Midcap index, 4) the next 2,000 stocks become the Russell 2000 Index, 5) the smallest 1,000 in the Russell 2000 Index plus the next smallest 1,000 comprise the Russell Microcap Index, and 6) U.S. Equity REITs comprise the FTSE Nareit All Equity REIT Index. See www.russell.com for more information.
S&P 500 Index consists of 500 stocks chosen for market size, liquidity and industry group representation, among other factors by the S&P Index Committee, which is a team of analysts and economists at Standard and Poor’s. The S&P 500 is a market-value weighted index, which means each stock’s weight in the index is proportionate to its market value and is designed to be a leading indicator of U.S. equities, and meant to reflect the risk/return characteristics of the large cap universe. See www.standardandpoors.com for more information.
Information on any indices mentioned can be obtained either through your advisor or by written request to information@feg.com.
DISCLOSURES
This report was prepared by FEG (also known as Fund Evaluation Group, LLC), a federally registered investment adviser under the Investment Advisers Act of 1940, as amended, providing non-discretionary and discretionary investment advice to its clients on an individual basis. Registration as an investment adviser does not imply a certain level of skill or training. The oral and written communications of an adviser provide you with information about which you determine to hire or retain an adviser. Fund Evaluation Group, LLC, Form ADV Part 2A & 2B can be obtained by written request directly to: Fund Evaluation Group, LLC, 201 East Fifth Street, Suite 1600, Cincinnati, OH 45202, Attention: Compliance Department.
The information herein was obtained from various sources. FEG does not guarantee the accuracy or completeness of such information provided by third parties. The information in this report is given as of the date indicated and believed to be reliable. FEG assumes no obligation to update this information, or to advise on further developments relating to it. FEG, its affiliates, directors, officers, employees, employee benefit programs and client accounts may have a long position in any securities of issuers discussed in this report.
Index performance results do not represent any managed portfolio returns. An investor cannot invest directly in a presented index, as an investment vehicle replicating an index would be required. An index does not charge management fees or brokerage expenses, and no such fees or expenses were deducted from the performance shown.
Bloomberg Index Services Limited. BLOOMBERG® is a trademark and service mark of Bloomberg Finance L.P. and its affiliates (collectively “Bloomberg”). Bloomberg or Bloomberg’s licensors own all proprietary rights in the Bloomberg Indices. Bloomberg does not approve or endorse this material or guarantee the accuracy or completeness of any information herein, nor does Bloomberg make any warranty, express or implied, as to the results to be obtained therefrom, and, to the maximum extent allowed by law, Bloomberg shall not have any liability or responsibility for injury or damages arising in connection therewith.
Neither the information nor any opinion expressed in this report constitutes an offer, or an invitation to make an offer, to buy or sell any securities.
Any return expectations provided are not intended as, and must not be regarded as, a representation, warranty or predication that the investment will achieve any particular rate of return over any particular time period or that investors will not incur losses.
Past performance is not indicative of future results.
Investments in private funds are speculative, involve a high degree of risk, and are designed for sophisticated investors.
All data is as of June 30, 2023 unless otherwise noted.