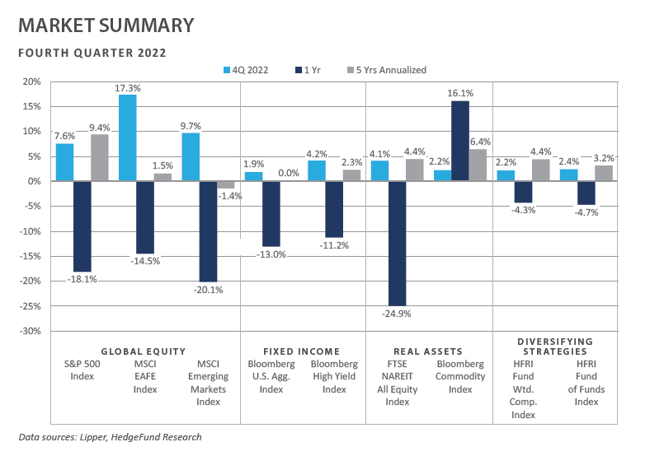
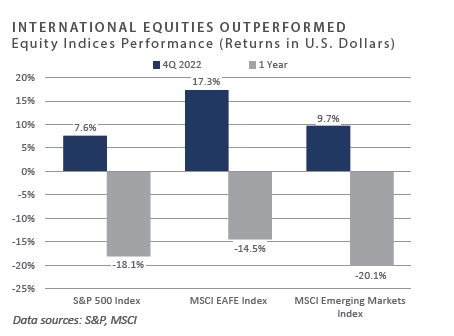
Despite a strong rebound in the first two-thirds of the final quarter of 2022, during which most major asset classes and categories enjoyed positive performance, December saw a return to the same weakness that global asset allocators had endured throughout much of the first three quarters of 2022. Cooling inflationary data, moderating interest rates, a declining U.S. dollar (USD), and the potential for an incremental reduction in the pace of Federal Reserve (Fed) tightening all underpinned the rally across the financial markets during the quarter. However, concerns that the elevated inflationary backdrop may prove a persistent headwind weighed on performance in December, supported by evidence that the “stickiness” of the current inflationary regime may remain a concern. Global equity performance was predominantly negative in December. International developed stocks – as measured by the MSCI EAFE Index – materially outperformed U.S. equities for both the quarter and the year. This theme dominated the global equity performance tone of the fourth quarter. Emerging market equities also enjoyed a solid rally in the fourth quarter, outperforming domestic equities. Bond returns were positive in the fourth quarter, as increased interest rates were predominantly at the short end of the yield curve, and credit-sensitive sectors benefited from the risk rally. Performance across real assets was similarly positive for the quarter, although headwinds such as deteriorating global economic fundamentals and rising interest rates weighed on the asset category at the end of the year.
Economic Update
Financial Markets Regain Footing in the Fourth Quarter but Conclude 2022 on a Low Note
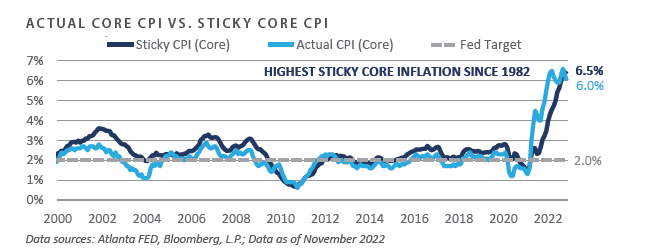
Signs emerged in the fourth quarter that the Fed’s tightening measures deployed throughout 2022 are beginning to alleviate multi-decade high inflation, which supported the growing narrative that a “pause” in the Fed’s tightening campaign may be on the horizon. Indeed, both headline and core measures of inflation moderated in both October and November, as headline consumer prices cooled to a 7.1% annual pace through November—versus a cyclical high of 9.1% in June—and core consumer price inflation declined to a 6.0% annual pace, slightly down from the cyclical high of 6.6% in September.
Key factors supporting the rebound across most major asset classes and categories in October and November were a potential peaking of inflation, which spooled to a 40-year high in 2022, and the related sentiment surrounding an incremental reduction in the pace of Fed tightening, with moderating interest rates and a cooling-off of the USD providing the necessary market conditions for a performance rebound.
While there is some evidence that the current inflationary episode may have run its course, it remains unclear whether the Fed’s job is complete. Despite progress in recent months toward restoring price stability, some measures that seek to approximate the “stickiness” of inflation continue to trend higher. Through November, for example, the Federal Reserve Bank of Atlanta’s Sticky core CPI data series advanced to a fresh cycle high of 6.5%, despite modest declines in the reported CPI rate since September. Notably, the 6.5% November print was the most elevated reading of this gauge since 1982.
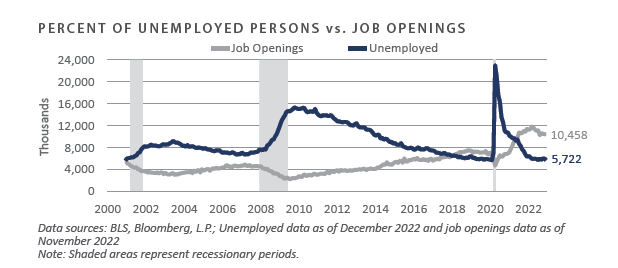
A persistent complicating factor is the surprising resilience of the U.S. labor market, which ended 2022 with an unemployment rate of 3.5%, the lowest rate in more than 50 years. Moreover, the number of job openings, which stood just shy of 10.5 million through November, continues to surpass the availability of labor capital, with less than six million unemployed individuals remaining sidelined through year-end. Consequently, nominal wages have been increasing at an elevated pace but still below the rate of inflation, which adds to inflationary pressures as employers attempt to add to and maintain their labor force. Until this labor market imbalance approaches a state of equilibrium, the Fed may find it challenging to engineer a soft landing, resulting in further financial market volatility and economic hardship for a broad swath of the general populace.
To summarize, performance across the financial markets in December was decidedly negative, particularly among the rate-sensitive sectors of the marketplace, which suffered through one of the worst calendar years on record, as inflation angst and monetary tightening measures by the Fed negatively impacted performance. This recent trend may ultimately reverse, however, when the full effects of a broad economic slowdown become too difficult for global investors to ignore.
Market Summary
Global Equity
- U.S. equities finished a volatile year with positive returns in the fourth quarter, yet still provided the worst calendar year performance since 2008. U.S. equities rallied to start the quarter but sold off in December in response to the Fed’s steadfast positioning to curb inflation.
- A repricing of assets amid rising interest rates and inflation levels not witnessed in four decades drove the year’s declines. Corporate earnings have been steady and have yet to reflect deterioration as economic indicators have weakened, although forward guidance has lowered earnings estimates for 2023.
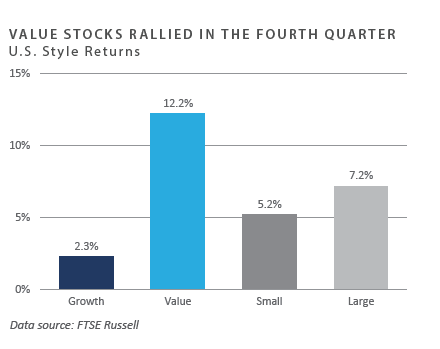
- Value equity returns outperformed growth equity returns across all market capitalizations for the quarter and substantially for the entire year. Cyclical sectors like energy, industrials, materials, and financials led the market's fourth-quarter rally. Communication services and consumer discretionary lagged in the quarter.
- European equities prevailed in the quarter, outperforming most other regions. Equity returns benefited from warmer-than-usual winter weather partially cushioning consumers from steep energy prices and inflation. European equities and the region’s currency, the euro, benefitted from a USD sell-off in the quarter. Cyclical sectors like energy and consumer discretionary drove the European equity market in the final quarter of the year. Equities performance turned sharply during the quarter, however, when the ECB stated it was “not done” increasing interest rates. UK equities was the best-performing region in 2022, driven by the significant weight value of industries like oil and gas and pharmaceuticals. UK markets also saw a strong rebound from the political instability that ensued in September.
- Japanese equities rallied in the fourth quarter but turned negative in December. Japanese companies reported another quarter of strong earnings in November. Large companies, like automakers, continued to benefit from the yen’s weakness. The elevated conviction levels of companies’ management can be seen by the record level of share buybacks announced this year. Equities and the yen responded positively to the Bank of Japan’s earlier-than-expected decision to widen the 10-year bond yield band.
- Emerging market equities posted positive returns in the quarter, propped up by a weakening USD. The region struggled throughout the year as China sold off and the Russia-Ukraine War wreaked havoc on the surrounding developing countries. Chinese equity returns rebounded in fourth quarter, however, as the government announced plans to relax its zero-COVID policy. Poland and Hungary also rebounded after being impacted by proximity to the war. Energy exporters in the Middle East underperformed on the back of energy prices declining across the globe.
Fixed Income
- The year ended with another volatile quarter for rates. Rate volatility persisted across the curve, resulting in a considerable range of 62 bps and 83 bps for the 2-year and 10-year Treasury yields, respectively. Ultimately, the 2-year Treasury yield ended the year at 4.4%, an increase of 19 bps from the end of the last quarter, while the 10-year Treasury yield rallied considerably off October highs and subsequently bounced in December to end the year at 3.9%. As of year-end, the yield curve remained inverted across nearly all term structures as market participants digested hawkish Fed commentary and weakening forward economic indicators.
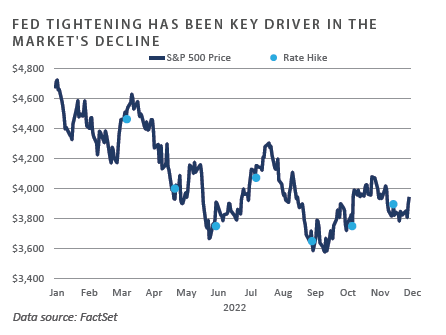
- The Fed kept its promise of prioritizing the battle against inflation, hiking the policy rate twice during the quarter to end the year at a targeted range of 4.25% to 4.5%. Despite the Summary of Economic Projections (SEP) indicating a terminal rate above 5%, cooling CPI prints during the quarter pushed market participants to lower their expectations for the path of interest rates for 2023. The USD simultaneously pulled back during the quarter with Treasury yields. Elsewhere in the SEP, Fed officials upwardly revised their outlook for the unemployment rate and core inflation as their mission to restore price stability continues.
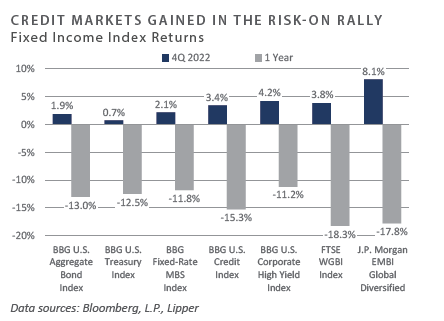
- Credit saw positive quarter-to-date returns in the fourth quarter after consecutive negative quarters of rising rates and widening spreads. The quarter’s risk rally benefited both investment grade (IG) and high yield (HY) credit sectors as investor appetite for credit resumed. IG and HY option-adjusted spreads (OAS) fell 29 bps and 62 bps, respectively, during the fourth quarter. The Bloomberg U.S. Credit Index (IG) and Corporate High Yield Index (HY) returned 3.4% and 4.2%, respectively, while the S&P/LSTA Leverage Loan Index (LL) returned 2.7% for the quarter. Rounding out a challenging year for credit, high-yield issuance fell 80% versus 2021 with just $91 billion in issuance, the lowest annual tally since 2008.
- Mortgage rates continued their push higher, ending the quarter at 6.4%, a jarring 3.2% higher than the beginning of the year. Mortgage convexity returned to negative territory after spending October in positive territory for the first time this century. Steeply discounted dollar prices and near-maximum extension expectations have given rise to some of the most attractive convexity profiles within the sector in years. The Bloomberg US MBS (30Y) index posted one of the strongest-performing months in the series history in November as spreads compressed and interest rate volatility modestly fell.
Real Assets
REAL ESTATE
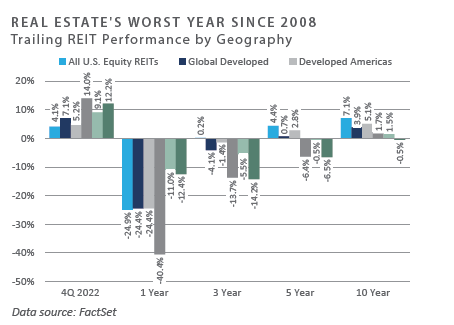
- U.S. real estate investment trusts (REITs) underperformed the broad equity market in the quarter, capping the worst year for REITs since 2008. Underperformance was driven primarily by the Fed raising interest rates, leading to higher borrowing costs and decreasing demand from investors. Developed Asia real estate outperformed on a relative basis for the year due to the relaxation of China’s zero-COVID policy and increased state-supported measures. Economists and analysts believe policymakers will roll out more support to stimulate real estate demand in China, resulting in a performance recovery. Furthermore, private and public real estate performance diverged during the year, signaling potential write-downs for private real estate investments in the fourth quarter.
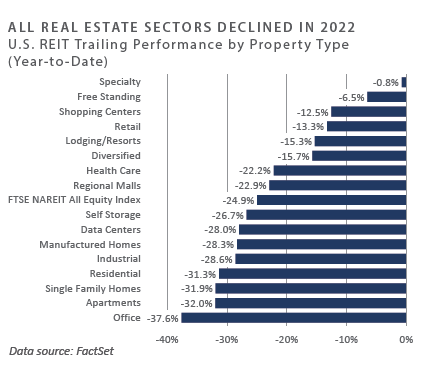
- Nearly all subsectors of U.S. real estate declined during December, and all subsectors were negative year-to-date. Office REITs underperformed all other property types, driven by a sharp decline in demand due to remote work trends following the pandemic. Conversely, specialty REITs, which include a variety of non-traditional properties such as casinos, movie theaters, and farmland, outperformed on a relative basis. Moreover, the dispersion between the performance of REIT property sectors was significant during 2022.
NATURAL RESOURCES
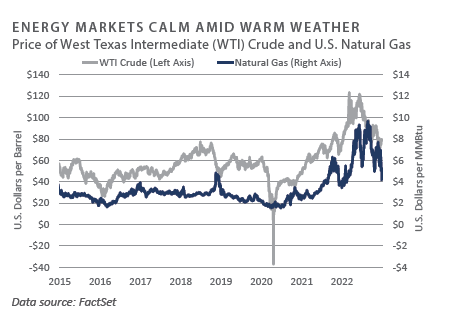
- WTI crude oil was relatively flat for the month of December. Conversely, natural gas (Henry Hub) fell more than 40% during the month due to warmer winter weather, particularly in Europe, which has recently relied on the U.S. to replace its dependence on Russian natural gas. U.S. liquified natural gas (LNG) exports to Europe increased dramatically, with the continent accounting for roughly 70% of all U.S. LNG exports during 2022. This is up from 26% in 2021 before the Russian invasion of Ukraine, according to the U.S. Energy Information Administration (EIA). Furthermore, a rapid recovery in production combined with decreased demand has created a potential oversupply, adding to the deterioration of performance during the month.
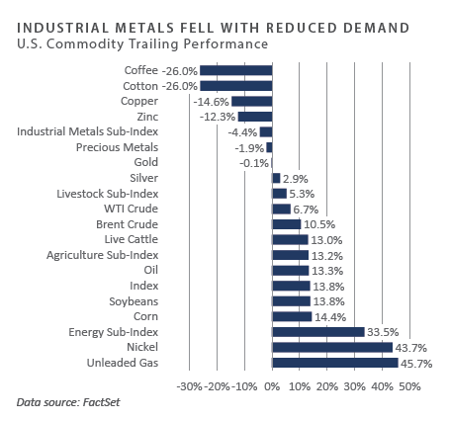
- Industrial metals ended the year in negative territory—with the exclusion of Nickel, a critical component of EV batteries. The underperformance of industrial metals was driven by slowing economic growth, particularly in China, as the country continued its strict zero-COVID policy, which reduced industrial demand. Agricultural commodities outperformed other sectors, with the Agriculture Sub-Index up 13.2% for the year. However, cotton and coffee significantly underperformed, declining 26% in 2022. Underperformance for cotton was due to weaker demand and consumer resistance to higher prices driven by inflation. Additionally, precious metals—particularly gold—underperformed despite being considered a hedge against inflation.
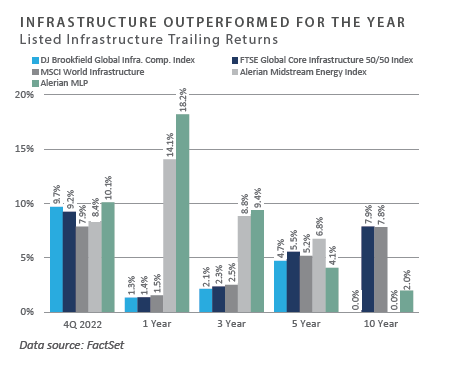
INFRASTRUCTURE
- The listed infrastructure and midstream energy sectors broadly underperformed during December. Midstream performance declined with due to falling energy prices following on reports indicating of warmer winter weather. According to Reuters, the fundamentals remain strong for midstream moving into 2023, with Europe’s reliance on U.S. LNG expected to continue.
- Midstream energy outperformed during in 2022, driven by high energy prices and strong company fundamentals. Midstream also tends to be a more stable energy subsector since because the revenue of most midstream companies’ revenue comes from long-term, fixed-fee contracts. As such, midstream was better positioned to weathered 2022’s environment of higher energy price volatility. Non-energy-related infrastructure remained flat for the year on an absolute basis. It outperformed the broader equity markets due to its defensive characteristics of the asset class with the inclusion of less economically-sensitive sectors like such as utilities and midstream.
Diversifying Strategies
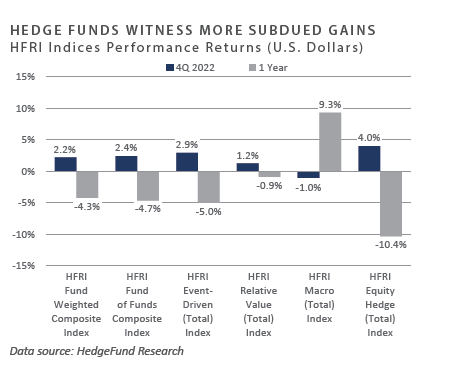
- Hedge funds slightly outperformed traditional equity and fixed-income markets, which continued to face headwinds and heightened volatility. The HFRI Fund Weighted Index was up 2.2% in the fourth quarter, which was the first positive quarter for the index since the first quarter of 2022. Global macro was the only strategy in negative territory over the quarter, following two consecutive quarters being the only strategy in positive territory.
- Hedged equity performed well in the last quarter of 2022 with an increase of, up 4%, rebounding from losses in previous quarters. Event-driven and relative value strategies also ended the fourth quarter on a solid note, with gains of 2.9% and 1.2%, respectively. Technology/healthcare and fundamental growth ended the last quarter of 2022 after being the worst-performing strategies year-to-date.
- Within hedged equity, fundamental value and energy/basic materials were the best-performing strategies. Quantitative directional had a positive fourth quarter, up 2.3% overall, even though it was down despite a 4.2% decline in December. Equity market neutral and fundamental growth strategies finished 2022 with strong performance.
- The common themes across hedged equity of de-levering portfolios and remaining bearishly positioned persisted throughout the fourth quarter. The themes that changed Changing themes included an increase in investment in China, decreases in long and increases in short positions in energy, and a sell-off in aerospace and defense. Many strategies also became net buyers of health care and staples.
INDICES
The Alerian MLP Index is a composite of the 50 most prominent energy Master Limited Partnerships that provides investors with an unbiased, comprehensive benchmark for this emerging asset class.
Bloomberg Fixed Income Indices is an index family comprised of the Bloomberg US Aggregate Index, Government/Corporate Bond Index, Mortgage-Backed Securities Index, and Asset-Backed Securities Index, Municipal Index, High-Yield Index, Commodity Index and others designed to represent the broad fixed income markets and sectors. On August 24, 2016, Bloomberg acquired these long-standing assets from Barclays Bank PLC. and on August 24, 2021, they were rebranded as the Bloomberg Fixed Income Indices. See https://www.bloomberg.com/markets/rates-bonds/bloomberg-fixed-income-indices for more information..
The CBOE Volatility Index (VIX) is an up-to-the-minute market estimate of expected volatility that is calculated by using real-time S&P 500 Index option bid/ask quotes. The Index uses nearby and second nearby options with at least eight days left to expiration and then weights them to yield a constant, 30-day measure of the expected volatility of the S&P 500 Index.
FTSE Real Estate Indices (NAREIT Index and EPRA/NAREIT Index) includes only those companies that meet minimum size, liquidity and free float criteria as set forth by FTSE and is meant as a broad representation of publicly traded real estate securities. Relevant real estate activities are defined as the ownership, disposure, and development of income-producing real estate. See https://www.ftserussell.com/index/category/real-estate for more information.
HFRI Monthly Indices (HFRI) are equally weighted performance indexes, compiled by Hedge Fund Research Inc. (HFX), and are used by numerous hedge fund managers as a benchmark for their own hedge funds. The HFRI are broken down into 37 different categories by strategy, including the HFRI Fund Weighted Composite, which accounts for over 2,000 funds listed on the internal HFR Database. The HFRI Fund of Funds Composite Index is an equal weighted, net of fee, index composed of approximately 800 fund- of- funds which report to HFR. See www.hedgefundresearch.com for more information on index construction.
J.P. Morgan’s Global Index Research group produces proprietary index products that track emerging markets, government debt, and corporate debt asset classes. Some of these indices include the JPMorgan Emerging Market Bond Plus Index, JPMorgan Emerging Market Local Plus Index, JPMorgan Global Bond Non-U.S. Index and JPMorgan Global Bond Non-U.S. Index. See www.jpmorgan.com for more information.
Merrill Lynch high yield indices measure the performance of securities that pay interest in cash and have a credit rating of below investment grade. Merrill Lynch uses a composite of Fitch Ratings, Moody’s and Standard and Poor’s credit ratings in selecting bonds for these indices. These ratings measure the risk that the bond issuer will fail to pay interest or to repay principal in full. See www.ml.com for more information.
Morgan Stanley Capital International – MSCI is a series of indices constructed by Morgan Stanley to help institutional investors benchmark their returns. There are a wide range of indices created by Morgan Stanley covering a multitude of developed and emerging economies and economic sectors. See www.morganstanley.com for more information.
The FTSE Nareit All Equity REITs Index is a free-float adjusted, market capitalization-weighted index of U.S. equity REITs.
Russell Investments rank U.S. common stocks from largest to smallest market capitalization at each annual reconstitution period (May 31). The primary Russell Indices are defined as follows: 1) the top 3,000 stocks become the Russell 3000 Index, 2) the largest 1,000 stocks become the Russell 1000 Index, 3) the smallest 800 stocks in the Russell 1000 Index become the Russell Midcap index, 4) the next 2,000 stocks become the Russell 2000 Index, 5) the smallest 1,000 in the Russell 2000 Index plus the next smallest 1,000 comprise the Russell Microcap Index, and 6) U.S. Equity REITs comprise the FTSE Nareit All Equity REIT Index. See www.russell.com for more information.
S&P 500 Index consists of 500 stocks chosen for market size, liquidity and industry group representation, among other factors by the S&P Index Committee, which is a team of analysts and economists at Standard and Poor’s. The S&P 500 is a market-value weighted index, which means each stock’s weight in the index is proportionate to its market value and is designed to be a leading indicator of U.S. equities, and meant to reflect the risk/return characteristics of the large cap universe. See www.standardandpoors.com for more information.
Information on any indices mentioned can be obtained either through your advisor or by written request to information@feg.com.
DISCLOSURES
This report was prepared by FEG (also known as Fund Evaluation Group, LLC), a federally registered investment adviser under the Investment Advisers Act of 1940, as amended, providing non-discretionary and discretionary investment advice to its clients on an individual basis. Registration as an investment adviser does not imply a certain level of skill or training. The oral and written communications of an adviser provide you with information about which you determine to hire or retain an adviser. Fund Evaluation Group, LLC, Form ADV Part 2A & 2B can be obtained by written request directly to: Fund Evaluation Group, LLC, 201 East Fifth Street, Suite 1600, Cincinnati, OH 45202, Attention: Compliance Department.
The information herein was obtained from various sources. FEG does not guarantee the accuracy or completeness of such information provided by third parties. The information in this report is given as of the date indicated and believed to be reliable. FEG assumes no obligation to update this information, or to advise on further developments relating to it. FEG, its affiliates, directors, officers, employees, employee benefit programs and client accounts may have a long position in any securities of issuers discussed in this report.
Index performance results do not represent any managed portfolio returns. An investor cannot invest directly in a presented index, as an investment vehicle replicating an index would be required. An index does not charge management fees or brokerage expenses, and no such fees or expenses were deducted from the performance shown.
Bloomberg Index Services Limited. BLOOMBERG® is a trademark and service mark of Bloomberg Finance L.P. and its affiliates (collectively “Bloomberg”). Bloomberg or Bloomberg’s licensors own all proprietary rights in the Bloomberg Indices. Bloomberg does not approve or endorse this material or guarantee the accuracy or completeness of any information herein, nor does Bloomberg make any warranty, express or implied, as to the results to be obtained therefrom, and, to the maximum extent allowed by law, Bloomberg shall not have any liability or responsibility for injury or damages arising in connection therewith.
Neither the information nor any opinion expressed in this report constitutes an offer, or an invitation to make an offer, to buy or sell any securities.
Any return expectations provided are not intended as, and must not be regarded as, a representation, warranty or predication that the investment will achieve any particular rate of return over any particular time period or that investors will not incur losses.
Past performance is not indicative of future results.
Investments in private funds are speculative, involve a high degree of risk, and are designed for sophisticated investors.
All data is as of December 31, 2022 unless otherwise noted.