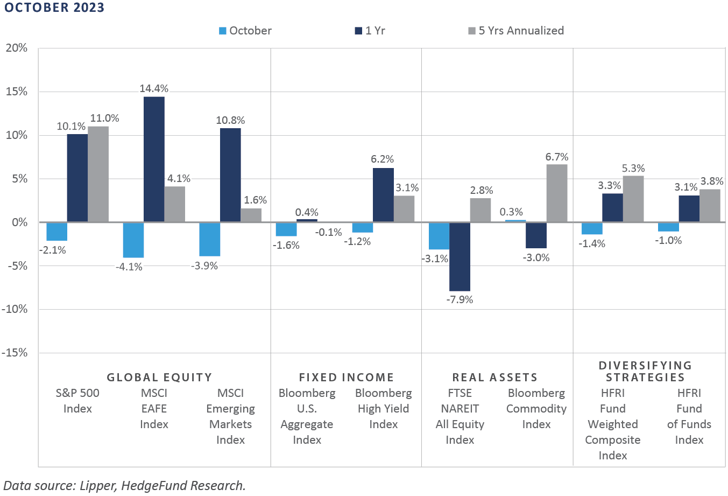
Similar to August and September, performance across the financial markets was challenged in October, with declines plaguing most of the primary asset classes and categories. Despite preliminary third quarter data indicating the U.S. economy is expanding at a remarkable inflation-adjusted quarterly pace. Hamas’ attack on Israel on October 7 contributed to the volatility experienced during the month. Additionally, the revival of economic activity during the third quarter, paired with above-target inflationary pressures, supported sentiment for a tighter-for-longer Federal Reserve (Fed) posture, a key factor behind the surge in interest rates in October.
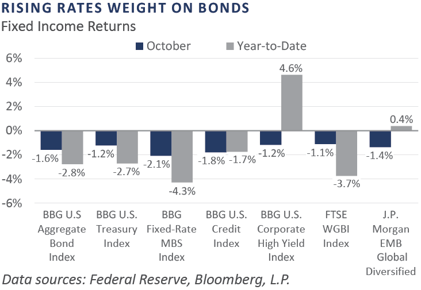
During the month, global equities were pressured lower by a confluence of forces: a notable spike in interest rates, a third consecutive monthly tightening in financial condition proxies, and heightened tensions in the Middle East. Bond returns were overwhelmingly negative in October, with rising rates and widening credit spreads serving as primary contributors to weak performance across both high-quality and credit-oriented sectors. The real assets space did little to cushion the blow of poor performance from the stock and bond markets in October, as real estate investment trusts (REITs), commodity futures, and global listed infrastructure each posted performance declines on the month.
Economic Update
Surface Cracks Form Across Seemingly Resilient U.S. Labor Market Landscape
The deep and widespread—albeit short-lived—downturn across the U.S. economy that accompanied the global pandemic inflicted much pain across supply chains and the broader labor market. The coordinated stimulative response set forth by fiscal and monetary policymakers helped plug the temporary demand void presented by the pandemic, in turn paving the way for a multi-year healing process across the labor market, the revival of which led to one of the tightest labor market backdrops in recent memory.
Despite the sharp monetary policy reversal over the past two and a half years—including a 500 basis point increase to the federal funds rate, a more than $1 trillion reduction in the Fed’s security holdings, and a material tightening across broader financial condition gauges—the U.S. labor market exhibited meaningful strength over the approximate 3-year period between summer 2020 and summer 2023. Elevated labor demand—a pro-inflationary phenomenon, all else equal—provided the Fed with the necessary evidence to throttle back its monetary support of the broader economy. Data received in recent months, however, paints a starkly different picture of this key pillar of the U.S. economy.
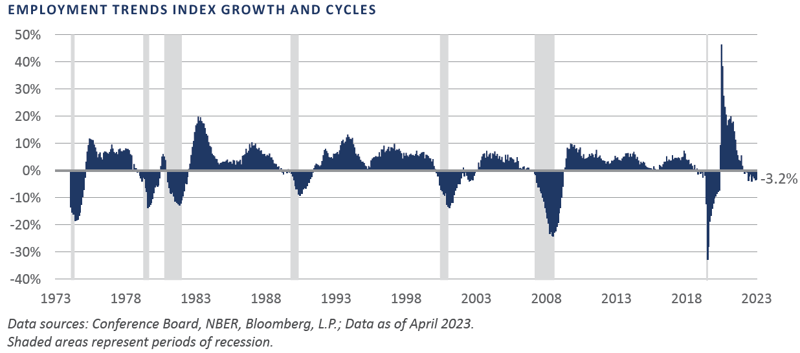
Compounding the widely reported issue of muted inflation-adjusted wage gains since the pandemic is the recent slowdown across payrolls growth, a related growth decline in the count of employed persons, and a recent increase in the headline unemployment rate to 3.9%, the highest level since January 2022. The Conference Board’s Employment Trends Index (ETI), a composite of eight labor market variables that summarizes trends across the employment conditions, helps contextualize the state of the labor market. Through October, this composite has posted an annual growth rate decline in 11 of the past 12 months, the persistent deceleration of which has historically coincided with recessionary conditions, with no false signals in the past half-century.
Perhaps “this time is different” rings true for the current business cycle, given the myriad of complicating factors present today, front and center of which includes growth slowdowns across key economies such as China and the euro zone, as well as the ongoing Russian-Ukraine war and the more recent Israeli-Hamas war. A more prudent assessment, however, continues to necessitate an abundance of caution by global investors over the near-to intermediate-term horizons.
In summary, global investors endured a third consecutive painful month in October, with performance losses blanketing the financial markets. While the U.S. economy enjoyed a spurt of positive economic momentum during the third quarter, the historically tight and presumed resilient labor market has begun to display signs of deceleration.
Market Summary
Global Equity
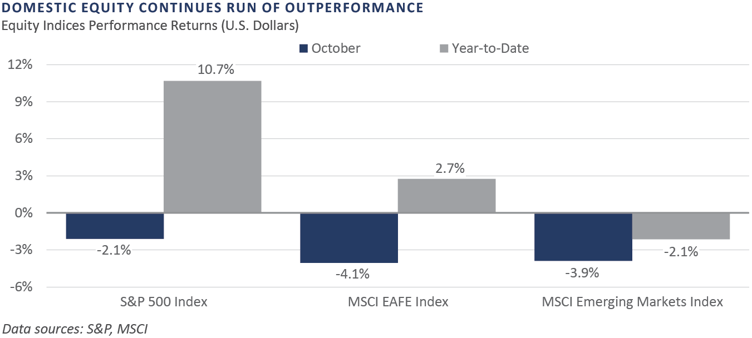
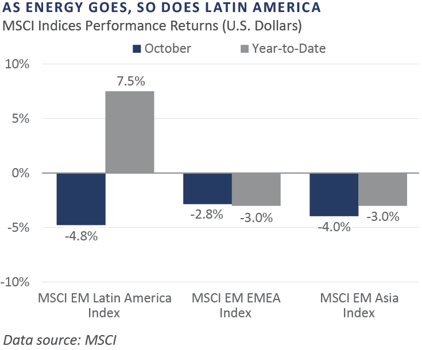
Global equity markets produced negative returns over the month of October. The fear of central banks maintaining interest rates higher for longer, coupled with geopolitical conflict in the Middle East, drove shares down. The Israel-Hamas conflict acted as a tailwind for the aerospace and defense industry as performance rebounded amid a shortage of munitions. RTX Corporation, Lockheed Martin, and General Dynamics finished up over 9% on the month, with the three stocks having produced negative returns for the year prior to the conflict.
Although it was the top-performing region, the U.S. market declined for the month. On October 26, the NASDAQ entered correction territory, defined as a 10% decline from its earlier high, which was made in July. Earnings reports and guidance from mega-cap companies within the index drove the decline. Meta, for example, sold off on reported slowdowns in advertising revenue despite strong top and bottom-line numbers.
European equities declined with the rest of the global equity market while recessionary fears rose in the euro zone. The preliminary PMI figure for October came in worse than expected at 46.5, down from September’s 47.2. This marked the fifth consecutive month the data has signaled economic contraction—i.e., below 50.0—and is the weakest figure in almost three years. Easing inflation allowed the European Central Bank to pause its run of 10 consecutive rate hikes, which has weighed on growth within the region.
Within the UK, financials finished as the worst-performing sector. Poor performance was driven by uncertainty on how the higher interest rates would impact the lending and mortgage businesses of large banks.
Japanese stocks fell, with all sectors producing negative returns. Similar to the third quarter, regional banks and auto-related companies held up the best. Bank stocks were also resilient due to attractive valuations and a steady increase in long-term yields. Corporate earnings were mixed as the technology sector showed signs of weakness while the auto industries reported positive results.
Emerging markets equities underperformed developed markets. Chinese stocks declined as the real estate debt crisis and foreign relations have led to increased concerns. The U.S. restrictions on artificial intelligence chip exports to China could lead to further declines. Taiwan outperformed despite tech exports falling from September to October amid a belief that exports will turn positive in the fourth quarter.
Fixed Income
Long-term rates continued to rise during October while short-term rates remained fairly flat. The 10-year Treasury briefly touched 5% during the month on the heels of strong economic data–including hot third quarter GDP and non-farm payrolls and government debt concerns—indicating a possible supply-demand mismatch in the Treasury market. With this rise in long-term rates, the yield curve continued to de-invert. The 10-year/2-year Treasury spread steepened 0.25% to -0.19%, representing the lowest level of inversion since the curve initially inverted in July of 2022.
The Bank of Japan (BOJ) took another step toward dismantling its yield curve control (YCC), a monetary policy used over the last decade to lower the cost of borrowing, by announcing a plan to remove the hard cap of a 1.0% yield on the 10-year JGB. The bank still plans to use quantitative easing to prevent the 10-year yield from moving significantly past that level. Rising global yields and persistent inflation are making it increasingly difficult for the BOJ to maintain its YCC.
Investment grade (IG) spreads rose to 1.3%, while high-yield (HY) spreads rose to 4.5%, likely driven by a combination of concerns over the impact of higher-for-longer policy rates on earnings, some poor earnings results, and geopolitical issues. Corporate fundamentals are anticipated to deteriorate—albeit from strong starting points—as softer demand, higher financing, and sticky cost pressures are putting pressure on profit margins.
Real Assets
REAL ESTATE
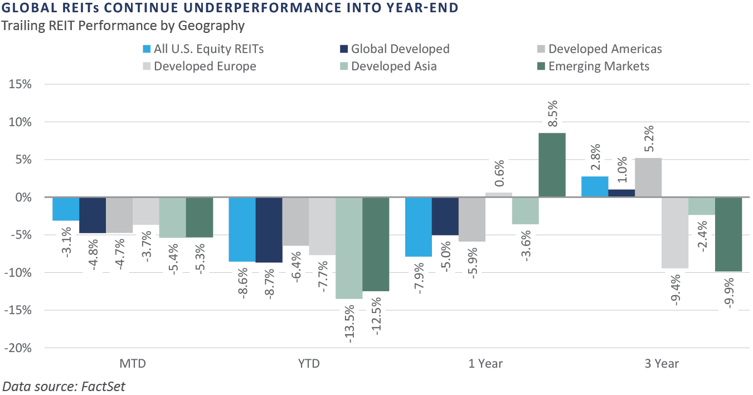
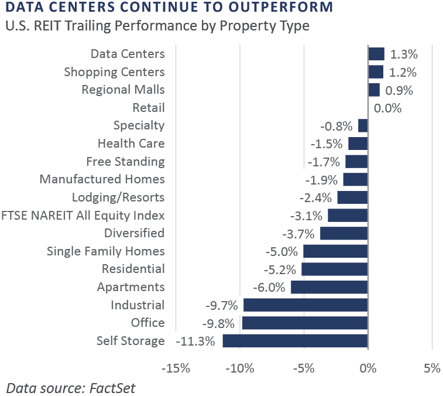
U.S. and global Real Estate Investment Trusts (REIT) declined several percentage points in October, as REITs have remained under pressure in 2023 with higher interest rates leading to declining property values and higher interest expenses.
At the end of October, two REIT merger and acquisition (M&A) deals were announced in the net lease and health care sectors. Within the net lease sector, Realty Income acquired Spirit Realty Capital in an all-stock deal valued at $9.3 billion. In the healthcare sector, Healthpeak Properties and Physicians Realty Trust agreed to combine in an all-stock merger valued at $21 billions.
NATURAL RESOURCES
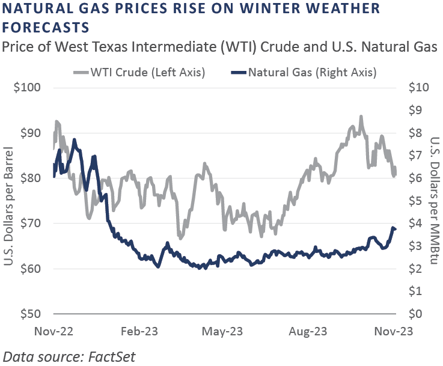
Oil prices, as measured by West Texas Intermediate (WTI), declined in October despite the Israel-Hamas conflict. The event has yet to lead to a geopolitical premium in oil prices as investors expect the conflict will be contained. During the month, the U.S. Energy Information Administration (IEA) announced U.S. oil production hit an all-time high in August, surpassing pre-COVID levels. Natural gas prices, as measured by the Henry Hub Continuous Contract, rose nearly 30% during the month on cold weather forecasts, but remained negative year-to-date.
Oil producers have taken advantage of higher commodity prices to shore up their balance sheets through the reduction of debt and are now shifting excess cash to M&A. Chevron announced it would acquire Hess Corporation for $53 billion, and Exxon Mobil plans to acquire Pioneer Natural Resources for $59.5 billion.
INFRASTRUCTURE
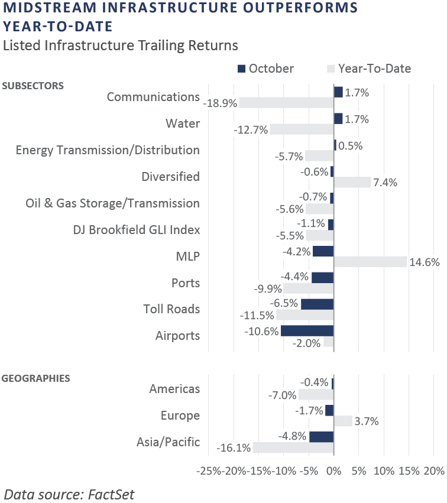
Global infrastructure broadly declined in October, as measured by the Dow Jones Brookfield Global Infrastructure Index. Midstream energy infrastructure declined during the month but has outperformed the broader equity markets year-to-date. Midstream energy infrastructure—particularly MLP companies—continues to benefit from higher commodity prices and strong balance sheets, making it well-positioned for the current higher interest rate environment.
Diversifying Strategies
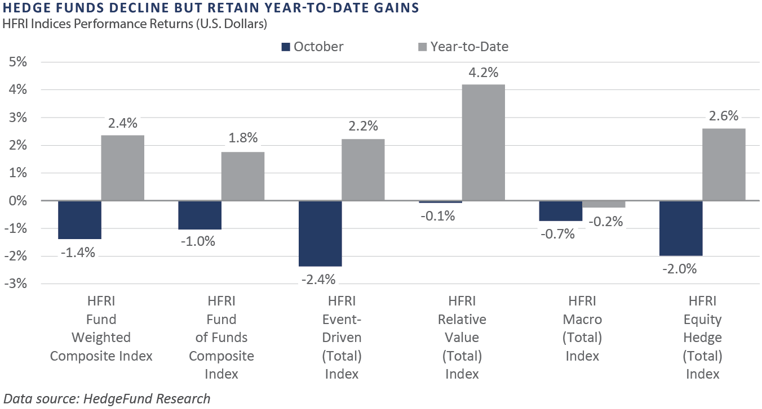
Hedge funds detracted in October across nearly all strategies. The broad hedge fund benchmark was down 1.4%, while the equity hedge and event-driven indices declined 2.0% and 2.4%, respectively. Markets faced an increase in volatility during the month, causing managers to struggle at the onset of the new quarter.
Event-driven managers focused on activism, which is typically accompanied by a higher equity beta, faced significant headwinds given market uncertainty. Within hedged equity strategies, sector specialists witnessed the largest losses, specifically in the energy, health care, and technology sectors.
Following a strong September, macro funds reversed course in October as long energy positions in particular moved against many macro-oriented managers. The move was most noticeable in the trend-following space and commodity-oriented strategies. The price decline in the oil complex was driven by higher inventories in the U.S. along with demand concerns. Short positions within precious metals were another negative contributor as gold and silver prices rallied in response to increased market risk aversion.
INDICES
The Alerian MLP Index is a composite of the 50 most prominent energy Master Limited Partnerships that provides investors with an unbiased, comprehensive benchmark for this emerging asset class.
Bloomberg Fixed Income Indices is an index family comprised of the Bloomberg US Aggregate Index, Government/Corporate Bond Index, Mortgage-Backed Securities Index, and Asset-Backed Securities Index, Municipal Index, High-Yield Index, Commodity Index and others designed to represent the broad fixed income markets and sectors. On August 24, 2016, Bloomberg acquired these long-standing assets from Barclays Bank PLC. and on August 24, 2021, they were rebranded as the Bloomberg Fixed Income Indices. See https://www.bloomberg.com/markets/rates-bonds/bloomberg-fixed-income-indices for more information.
The CBOE Volatility Index (VIX) is an up-to-the-minute market estimate of expected volatility that is calculated by using real-time S&P 500 Index option bid/ask quotes. The Index uses nearby and second nearby options with at least eight days left to expiration and then weights them to yield a constant, 30-day measure of the expected volatility of the S&P 500 Index.
FTSE Real Estate Indices (NAREIT Index and EPRA/NAREIT Index) includes only those companies that meet minimum size, liquidity and free float criteria as set forth by FTSE and is meant as a broad representation of publicly traded real estate securities. Relevant real estate activities are defined as the ownership, disposure, and development of income-producing real estate. See https://www.ftserussell.com/index/category/real-estate for more information.
HFRI Monthly Indices (HFRI) are equally weighted performance indexes, compiled by Hedge Fund Research Inc. (HFX), and are used by numerous hedge fund managers as a benchmark for their own hedge funds. The HFRI are broken down into 37 different categories by strategy, including the HFRI Fund Weighted Composite, which accounts for over 2,000 funds listed on the internal HFR Database. The HFRI Fund of Funds Composite Index is an equal weighted, net of fee, index composed of approximately 800 fund- of- funds which report to HFR. See www.hedgefundresearch.com for more information on index construction.
J.P. Morgan’s Global Index Research group produces proprietary index products that track emerging markets, government debt, and corporate debt asset classes. Some of these indices include the JPMorgan Emerging Market Bond Plus Index, JPMorgan Emerging Market Local Plus Index, JPMorgan Global Bond Non-U.S. Index and JPMorgan Global Bond Non-U.S. Index. See www.jpmorgan.com for more information.
Merrill Lynch high yield indices measure the performance of securities that pay interest in cash and have a credit rating of below investment grade. Merrill Lynch uses a composite of Fitch Ratings, Moody’s and Standard and Poor’s credit ratings in selecting bonds for these indices. These ratings measure the risk that the bond issuer will fail to pay interest or to repay principal in full. See www.ml.com for more information.
Morgan Stanley Capital International – MSCI is a series of indices constructed by Morgan Stanley to help institutional investors benchmark their returns. There are a wide range of indices created by Morgan Stanley covering a multitude of developed and emerging economies and economic sectors. See www.morganstanley.com for more information.
The FTSE Nareit All Equity REITs Index is a free-float adjusted, market capitalization-weighted index of U.S. equity REITs.
Russell Investments rank U.S. common stocks from largest to smallest market capitalization at each annual reconstitution period (May 31). The primary Russell Indices are defined as follows: 1) the top 3,000 stocks become the Russell 3000 Index, 2) the largest 1,000 stocks become the Russell 1000 Index, 3) the smallest 800 stocks in the Russell 1000 Index become the Russell Midcap index, 4) the next 2,000 stocks become the Russell 2000 Index, 5) the smallest 1,000 in the Russell 2000 Index plus the next smallest 1,000 comprise the Russell Microcap Index, and 6) U.S. Equity REITs comprise the FTSE Nareit All Equity REIT Index. See www.russell.com for more information.
S&P 500 Index consists of 500 stocks chosen for market size, liquidity and industry group representation, among other factors by the S&P Index Committee, which is a team of analysts and economists at Standard and Poor’s. The S&P 500 is a market-value weighted index, which means each stock’s weight in the index is proportionate to its market value and is designed to be a leading indicator of U.S. equities, and meant to reflect the risk/return characteristics of the large cap universe. See www.standardandpoors.com for more information.
Information on any indices mentioned can be obtained either through your advisor or by written request to information@feg.com.
DISCLOSURES
This report was prepared by FEG (also known as Fund Evaluation Group, LLC), a federally registered investment adviser under the Investment Advisers Act of 1940, as amended, providing non-discretionary and discretionary investment advice to its clients on an individual basis. Registration as an investment adviser does not imply a certain level of skill or training. The oral and written communications of an adviser provide you with information about which you determine to hire or retain an adviser. Fund Evaluation Group, LLC, Form ADV Part 2A & 2B can be obtained by written request directly to: Fund Evaluation Group, LLC, 201 East Fifth Street, Suite 1600, Cincinnati, OH 45202, Attention: Compliance Department.
The information herein was obtained from various sources. FEG does not guarantee the accuracy or completeness of such information provided by third parties. The information in this report is given as of the date indicated and believed to be reliable. FEG assumes no obligation to update this information, or to advise on further developments relating to it. FEG, its affiliates, directors, officers, employees, employee benefit programs and client accounts may have a long position in any securities of issuers discussed in this report.
Index performance results do not represent any managed portfolio returns. An investor cannot invest directly in a presented index, as an investment vehicle replicating an index would be required. An index does not charge management fees or brokerage expenses, and no such fees or expenses were deducted from the performance shown.
Bloomberg Index Services Limited. BLOOMBERG® is a trademark and service mark of Bloomberg Finance L.P. and its affiliates (collectively “Bloomberg”). Bloomberg or Bloomberg’s licensors own all proprietary rights in the Bloomberg Indices. Bloomberg does not approve or endorse this material or guarantee the accuracy or completeness of any information herein, nor does Bloomberg make any warranty, express or implied, as to the results to be obtained therefrom, and, to the maximum extent allowed by law, Bloomberg shall not have any liability or responsibility for injury or damages arising in connection therewith.
Neither the information nor any opinion expressed in this report constitutes an offer, or an invitation to make an offer, to buy or sell any securities.
Any return expectations provided are not intended as, and must not be regarded as, a representation, warranty or predication that the investment will achieve any particular rate of return over any particular time period or that investors will not incur losses.
Past performance is not indicative of future results.
Investments in private funds are speculative, involve a high degree of risk, and are designed for sophisticated investors.
All data is as of October 31, 2023 unless otherwise noted.