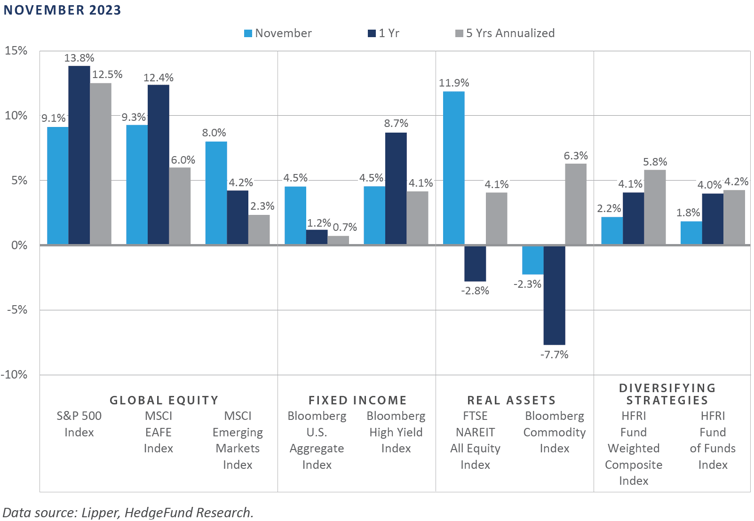
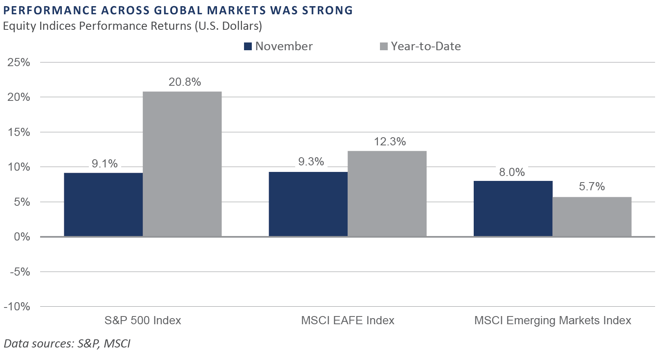
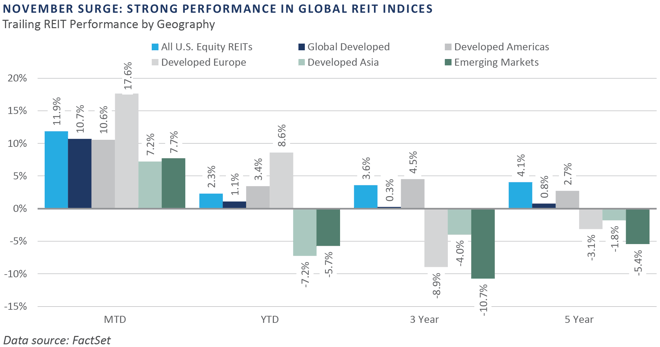
Following three consecutive months of performance struggles, financial markets rallied strongly in November as global investors welcomed evidence of cooling inflation and anticipated a near-term policy pivot by the Federal Reserve (Fed)—both of which helped drive a historical monthly easing across U.S. financial conditions. Global equity returns were robust and reflected an increase in breadth during the month, as international developed equities (MSCI EAFE Index) slightly outperformed domestic markets (S&P 500 Index), with emerging markets (MSCI Emerging Markets Index) close behind, earning total returns of 9.3%, 9.1%, and 8.0%, respectively. Consistent with the ongoing strong positive correlation between stock and bond returns, fixed income markets enjoyed solid performance in November, with core bonds (Bloomberg U.S. Aggregate Bond Index) returning 4.5%, the largest monthly gain since May 1985. A similar upward bias was witnessed across most major real assets sectors, with the rate-sensitive real estate investment trust (REIT) sector posting a double-digit gain and global listed infrastructure also exhibiting performance tailwinds. However, the global economic growth-sensitive commodity futures sector was one of the few major asset categories that declined in November.
Economic Update
Financial Markets Regain Footing as Financial Conditions Ease Meaningfully
The Fed’s initiation of the monetary policy tightening process following the global pandemic easing largesse, a move launched in December 2021, helped to tighten broader financial cond- itions considerably and represented a pivotal headwind to financial markets throughout 2022. This deliberate tightening in monetary conditions to reduce inflationary pressures meant a sharp increase in interest rates that also supported the U.S. dollar (USD), helped to invert the Treasury yield curve, and placed downward pressure on risk premiums across many key financial sectors.
When viewed in conjunction with early warning signs of a slowdown across the labor market, this data prompted financial market participants to quickly revise downward their expectations for how the policy rate might trend over the coming quarters.
Through October, the fed funds futures curve implied an expected year-end level for the policy rate of 4.67%. By November, however, futures traders had re-priced their expectations for the year-end policy level nearly 50 basis points lower to a 4.19% expected rate. Importantly, expectations for the first 25 basis-point cut to the policy rate were pulled forward as well, with October’s fed funds futures curve implying the first cut is expected in July 2024—versus the May 2024 implication of November’s pricing.
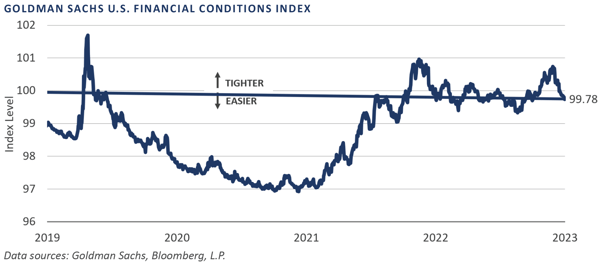
Increasing market-based sentiment for a near-term Fed policy pivot helped lead to a dramatic easing in financial conditions in November, a key pillar of support behind November’s exceptionally strong financial market performance. The Goldman Sachs U.S. Financial Conditions Index, a composite comprised of inputs such as riskless interest rates, the U.S. dollar exchange rate, equity valuations, and credit risk premiums, notched its strongest monthly easing reading in its more than 40-year history, with a 0.9 percentage point decline in November.
To conclude, increased visibility on a potential near-term policy reversal by the Fed—supported by moderating inflation, a recent cooling bias across the labor markets, and persistent cyclical growth pressures—helped ease financial conditions considerably and underpinned a broad-based rally across the financial market in November.
Market Summary
Global Equity
Global equity markets produced positive returns over the month of November. Falling inflation across developed markets benefited equity performance as investors saw reasons for easing hawkish monetary policies. Performance globally was led by information technology (IT), which was the top-performing sector across major regional equity indices, benefiting from expectations of lower interest rates.
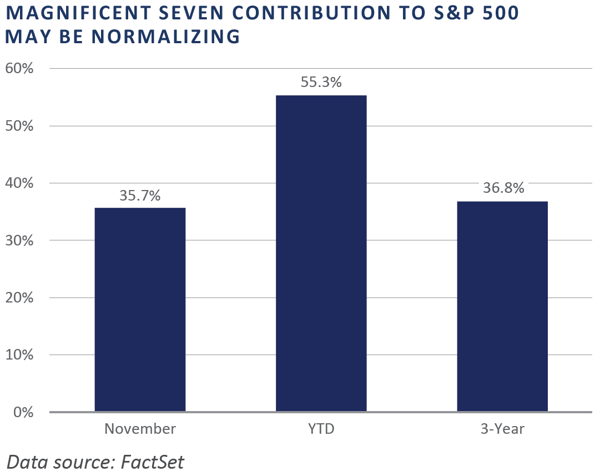
Globally, the U.S. equity market was one of the top-performing regions. The S&P 500 Index and NASDAQ Index saw their most substantial monthly gains since July 2022. Performance over November was partly driven by October’s consumer price index (CPI) print, falling to 3.2% year-over-year from 3.7% in September. The so-called Magnificent Seven technology-related mega-cap stocks have been a primary driver of S&P 500 Index performance in 2023, but their influence declined in November’s rally, indicating a better breadth of solid performance.
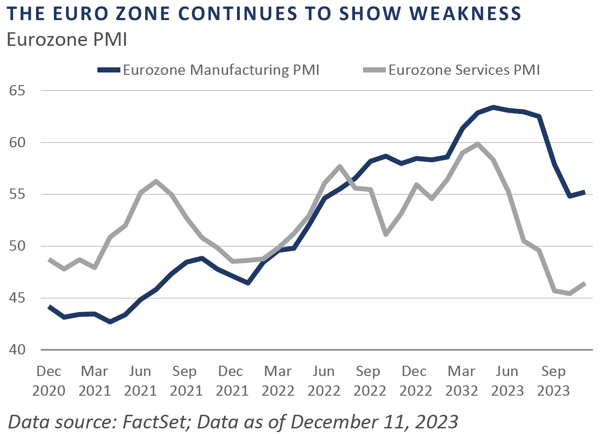
European equities gained over 10%, outpacing the S&P 500 Index. Similar to the U.S., lower-than-expected inflation provided a positive backdrop for European stocks. Although inflation is declining, other economic data points showed weakness in the European economy. November’s PMI figure came in below 50, which marks the sixth consecutive month the data has signaled economic contraction. The financials sector was one of the top-performing sectors in the region, benefitting from stronger interest margins and higher profits.
The United Kingdom finished the month with positive equity returns, although the market lagged the European region. In the UK, energy was the worst-performing sector due to declining energy and gas prices, which were the major contributors to declining inflationary pressures.
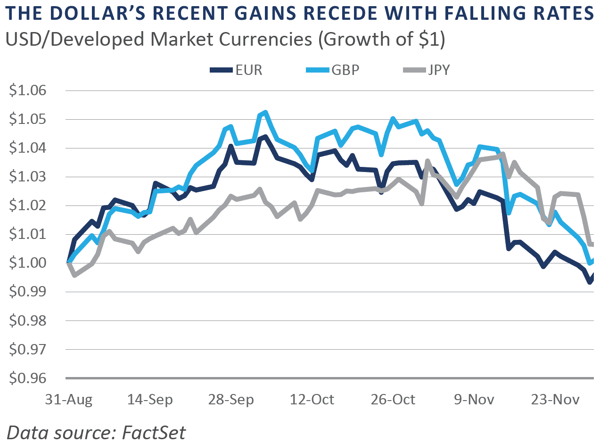
Japanese stocks posted gains only slightly below those of other major regions. U.S. investors have experienced dampened returns from a strengthening dollar in recent years. November marked a reversal as the Japanese yen appreciated against the USD, benefiting U.S. Investor returns. Smaller cap stocks in Japan lagged large cap as economically sensitive areas of the market underperformed due to a contraction of the nation's GDP.
Emerging market equity returns were positive for the month but underperformed developed markets. South Koreaand Taiwan produced strong returns due to a rally in technology-related stocks. China lagged other Asian emerging market countries as concerns around the ongoing real estate crisis hurt sentiment. Latin America was the top-performing region, led by Mexico and Brazil. Substantial currency gains supported the Mexico market’s performance, and the Brazilian economy showed positive signs of disinflation.
Fixed Income
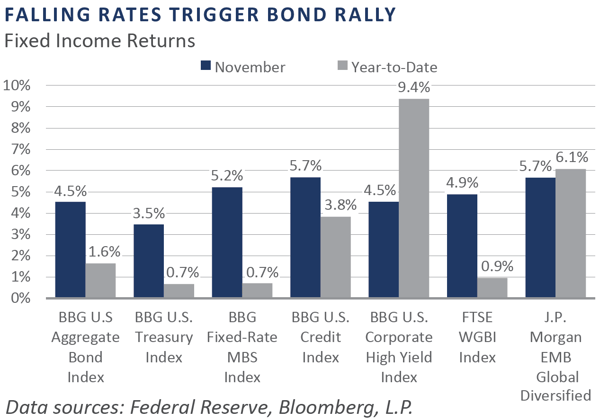
Global bond markets rallied in response to weaker economic data, which shifted expectations of future monetary policy and led to tighter spreads. The Fed's confidence in moderating inflation led the market to perceive a reduced likelihood of further rate hikes.
As signs of a cooling economy emerge and expectations for easier monetary policy are anticipated, investors previously positioned short on duration hastened their short covering amid the Treasury rally. Active asset managers aimed to safeguard capital entering 2023 by positioning portfolio duration shorter than the Bloomberg U.S. Aggregate Bond Index (BAGG). In anticipation of a Fed policy shift in 2024, active managers have begun shifting away from this stance, even moving to overweight positions. This enabled some active managers to outperform the BAGG in November.
Recent trends in credit markets highlight a preference for higher-quality assets, with lower-rated segments trailing their higher-quality counterparts. Commercial real estate fundamentals have been weakened by increased downgrades and defaults. Borrowing costs have increased dramatically, and credit tightening from regional banks has constrained access to capital for borrowers, intensifying downward pressure on property values.
Recessionary fears are still on the rise in the euro zone. However, November provided some positive data as the Eurozone Purchasing Managers’ Index came in at 44.2, which was better than consensus expectations yet still down from October’s 46.5. This was the weakest figure in nearly three years, as both services and manufacturing showed weakness. The data reinforced the impression of a sluggish economy flirting with recession.
Real Assets
REAL ESTATE
U.S. and Global Developed Real Estate Investment Trusts (REITs) rallied in November as nominal rates declined. REITs have remained under pressure in 2023 as higher interest rates have led to declining property values and higher interest expenses. A pause or cut in rates by central banks would be supportive for the real estate market and could lead to REITs rebounding strongly.
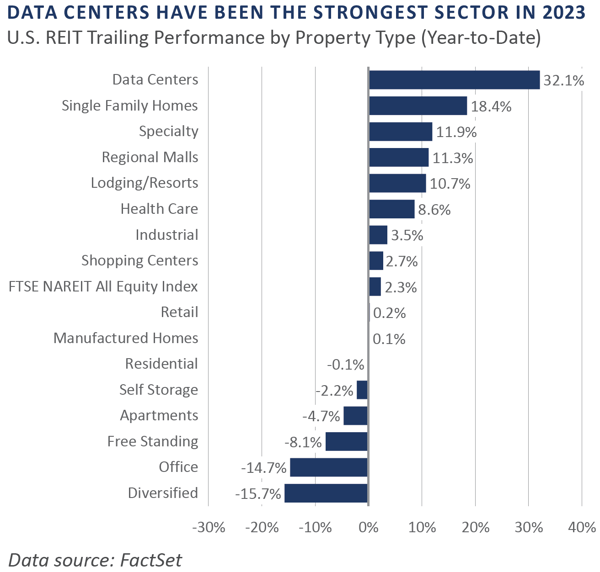
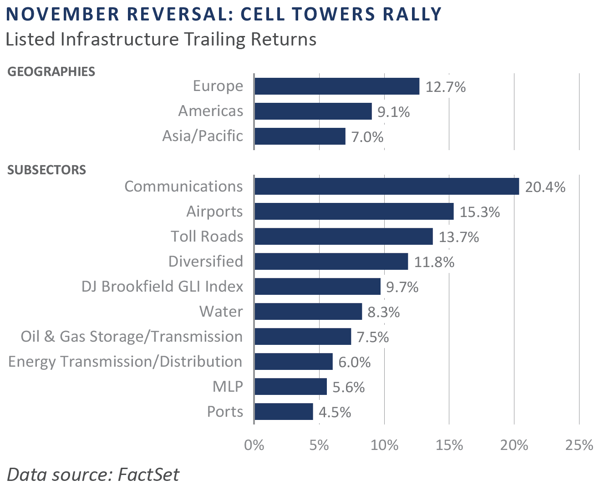
The U.S. infrastructure REIT sector, which is mainly comprised of cell tower REITs, was the top-performing sub-index in November. In 2023, cell towers faced underperformance due to higher interest rates, prompting an increased discounting of future cash flows. The long-term contracts associated with cell towers exacerbated this effect, as the heightened discounting, coupled with reassessment of valuations in the sector, lowered the financial outlook of these infrastructure assets for most of the year.
NATURAL RESOURCES
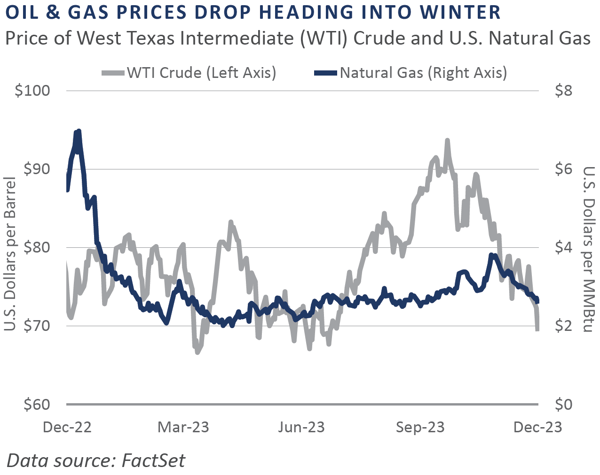
The U.S. oil and gas prices declined in November despite heightened geopolitical tension in the Middle East, OPEC+ production cuts announced for early 2024, and the winter season nearing. The West Texas Intermediate (WTI) continuous contract price tumbled below $70 per barrel in early December as concerns about slowing economic growth and low demand from China continued to dampen demand.
INFRASTRUCTURE
Global listed infrastructure rallied in November, as measured by the Dow Jones Brookfield Global Infrastructure. Midstream energy infrastructure MLPs have outperformed the listed infrastructure sector year-to-date in 2023, benefitting from relatively higher oil prices and strong balance sheets, positioning them well for the current higher interest rate environment. The communications infrastructure was the top-performing sector in the month, mainly driven by the rebound in cell towers.
Diversifying Strategies
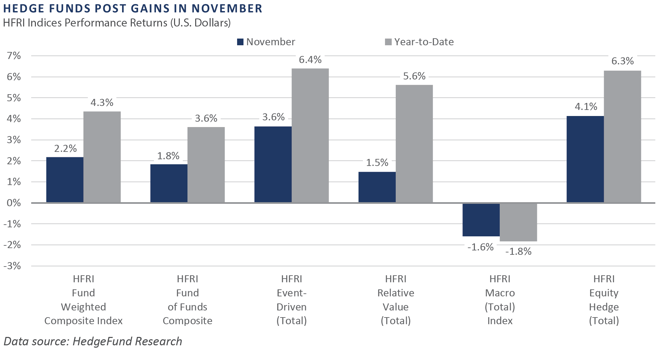
Most hedge fund strategies rallied with other asset classes during the month. The broad hedge fund benchmark was up 2.2%, with only the global macro index in negative territory. Overall, November was a strong month for hedge funds.
Long/short equity and event-driven managers posted strong returns with the tailwind of a bullish equity market. Within long/short equity, biotech-focused strategies generated outsized gains during the month.
Systematic trend-following strategies faced significant challenges during November. Reversals in the recent direction of equity and fixed income markets resulted in losses. The U.S. dollar also witnessed a correction which caught macro managers off guard. The losses impacted long positions in the U.S. dollar relative to the euro and Japanese yen.
INDICES
The Alerian MLP Index is a composite of the 50 most prominent energy Master Limited Partnerships that provides investors with an unbiased, comprehensive benchmark for this emerging asset class.
Bloomberg Fixed Income Indices is an index family comprised of the Bloomberg US Aggregate Index, Government/Corporate Bond Index, Mortgage-Backed Securities Index, and Asset-Backed Securities Index, Municipal Index, High-Yield Index, Commodity Index and others designed to represent the broad fixed income markets and sectors. On August 24, 2016, Bloomberg acquired these long-standing assets from Barclays Bank PLC. and on August 24, 2021, they were rebranded as the Bloomberg Fixed Income Indices. See https://www.bloomberg.com/markets/rates-bonds/bloomberg-fixed-income-indices for more information.
The CBOE Volatility Index (VIX) is an up-to-the-minute market estimate of expected volatility that is calculated by using real-time S&P 500 Index option bid/ask quotes. The Index uses nearby and second nearby options with at least eight days left to expiration and then weights them to yield a constant, 30-day measure of the expected volatility of the S&P 500 Index.
FTSE Real Estate Indices (NAREIT Index and EPRA/NAREIT Index) includes only those companies that meet minimum size, liquidity and free float criteria as set forth by FTSE and is meant as a broad representation of publicly traded real estate securities. Relevant real estate activities are defined as the ownership, disposure, and development of income-producing real estate. See https://www.ftserussell.com/index/category/real-estate for more information.
HFRI Monthly Indices (HFRI) are equally weighted performance indexes, compiled by Hedge Fund Research Inc. (HFX), and are used by numerous hedge fund managers as a benchmark for their own hedge funds. The HFRI are broken down into 37 different categories by strategy, including the HFRI Fund Weighted Composite, which accounts for over 2,000 funds listed on the internal HFR Database. The HFRI Fund of Funds Composite Index is an equal weighted, net of fee, index composed of approximately 800 fund- of- funds which report to HFR. See www.hedgefundresearch.com for more information on index construction.
J.P. Morgan’s Global Index Research group produces proprietary index products that track emerging markets, government debt, and corporate debt asset classes. Some of these indices include the JPMorgan Emerging Market Bond Plus Index, JPMorgan Emerging Market Local Plus Index, JPMorgan Global Bond Non-U.S. Index and JPMorgan Global Bond Non-U.S. Index. See www.jpmorgan.com for more information.
Merrill Lynch high yield indices measure the performance of securities that pay interest in cash and have a credit rating of below investment grade. Merrill Lynch uses a composite of Fitch Ratings, Moody’s and Standard and Poor’s credit ratings in selecting bonds for these indices. These ratings measure the risk that the bond issuer will fail to pay interest or to repay principal in full. See www.ml.com for more information.
Morgan Stanley Capital International – MSCI is a series of indices constructed by Morgan Stanley to help institutional investors benchmark their returns. There are a wide range of indices created by Morgan Stanley covering a multitude of developed and emerging economies and economic sectors. See www.morganstanley.com for more information.
The FTSE Nareit All Equity REITs Index is a free-float adjusted, market capitalization-weighted index of U.S. equity REITs.
Russell Investments rank U.S. common stocks from largest to smallest market capitalization at each annual reconstitution period (May 31). The primary Russell Indices are defined as follows: 1) the top 3,000 stocks become the Russell 3000 Index, 2) the largest 1,000 stocks become the Russell 1000 Index, 3) the smallest 800 stocks in the Russell 1000 Index become the Russell Midcap index, 4) the next 2,000 stocks become the Russell 2000 Index, 5) the smallest 1,000 in the Russell 2000 Index plus the next smallest 1,000 comprise the Russell Microcap Index, and 6) U.S. Equity REITs comprise the FTSE Nareit All Equity REIT Index. See www.russell.com for more information.
S&P 500 Index consists of 500 stocks chosen for market size, liquidity and industry group representation, among other factors by the S&P Index Committee, which is a team of analysts and economists at Standard and Poor’s. The S&P 500 is a market-value weighted index, which means each stock’s weight in the index is proportionate to its market value and is designed to be a leading indicator of U.S. equities, and meant to reflect the risk/return characteristics of the large cap universe. See www.standardandpoors.com for more information.
Information on any indices mentioned can be obtained either through your advisor or by written request to information@feg.com.
DISCLOSURES
This report was prepared by FEG (also known as Fund Evaluation Group, LLC), a federally registered investment adviser under the Investment Advisers Act of 1940, as amended, providing non-discretionary and discretionary investment advice to its clients on an individual basis. Registration as an investment adviser does not imply a certain level of skill or training. The oral and written communications of an adviser provide you with information about which you determine to hire or retain an adviser. Fund Evaluation Group, LLC, Form ADV Part 2A & 2B can be obtained by written request directly to: Fund Evaluation Group, LLC, 201 East Fifth Street, Suite 1600, Cincinnati, OH 45202, Attention: Compliance Department.
The information herein was obtained from various sources. FEG does not guarantee the accuracy or completeness of such information provided by third parties. The information in this report is given as of the date indicated and believed to be reliable. FEG assumes no obligation to update this information, or to advise on further developments relating to it. FEG, its affiliates, directors, officers, employees, employee benefit programs and client accounts may have a long position in any securities of issuers discussed in this report.
Index performance results do not represent any managed portfolio returns. An investor cannot invest directly in a presented index, as an investment vehicle replicating an index would be required. An index does not charge management fees or brokerage expenses, and no such fees or expenses were deducted from the performance shown.
Bloomberg Index Services Limited. BLOOMBERG® is a trademark and service mark of Bloomberg Finance L.P. and its affiliates (collectively “Bloomberg”). Bloomberg or Bloomberg’s licensors own all proprietary rights in the Bloomberg Indices. Bloomberg does not approve or endorse this material or guarantee the accuracy or completeness of any information herein, nor does Bloomberg make any warranty, express or implied, as to the results to be obtained therefrom, and, to the maximum extent allowed by law, Bloomberg shall not have any liability or responsibility for injury or damages arising in connection therewith.
Neither the information nor any opinion expressed in this report constitutes an offer, or an invitation to make an offer, to buy or sell any securities.
Any return expectations provided are not intended as, and must not be regarded as, a representation, warranty or predication that the investment will achieve any particular rate of return over any particular time period or that investors will not incur losses.
Past performance is not indicative of future results.
Investments in private funds are speculative, involve a high degree of risk, and are designed for sophisticated investors.
All data is as of November 30, 2023 unless otherwise noted.