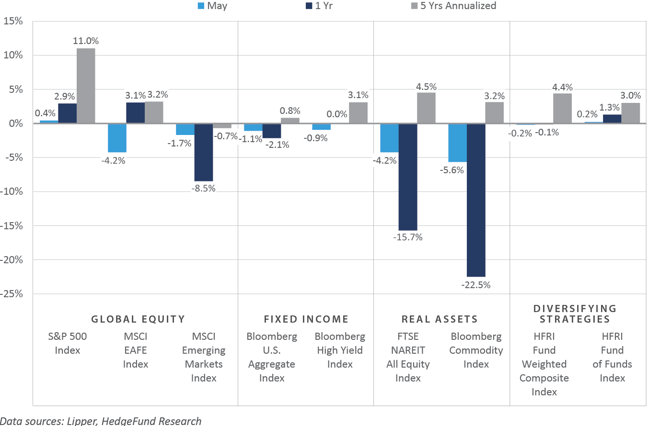
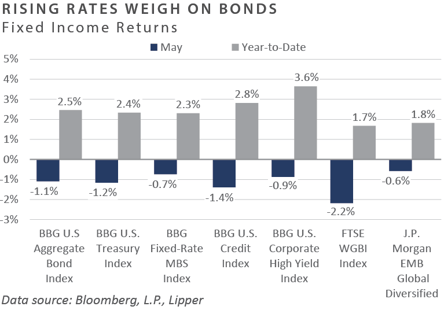
Performance across the financial markets was predominantly negative in May, with global investors and market participants on edge amid mounting debt ceiling uncertainty. Ultimately a deal was struck, culminating in the passage of the Fiscal Responsibility Act on June 3. Global equity returns were mixed during the month, as domestic markets—particularly large cap growth—strongly outperformed both international developed and emerging markets, and small cap’s string of relative underperformance versus large cap persisted. Microcap equities, however, outperformed large cap—the first monthly outperformance by microcap companies since January. Fixed income performance in May was overwhelmingly negative, as interest rates and credit risk premiums rose, pressuring rate-sensitive and credit-sensitive sectors lower. Similar to the bond market, returns across the major real asset sectors were negative in May, with the most significant losses witnessed in the rate-sensitive real estate investment trust (REIT) sector, as the FTSE NAREIT All Equity REIT Index suffered a 4.2% monthly decline.
Economic Update
U.S. Narrowly Averts Sovereign Default Through Passage of Fiscal Responsibility Act
From January through May, the U.S. Treasury exercised its extraordinary measures authority to fund the government’s obligations by drawing down the Treasury General Account to avert default. Entering 2023, the Treasury General Account stood at approximately $500 billion, but the account had been drawn down to $49 billion by the end of May, the lowest level since 2017. Global market participants breathed a sigh of relief on June 3, however, as President Biden signed the Fiscal Responsibility Act into law, legislation which caps federal spending for the next two years and suspends the debt ceiling through January 1, 2025.
Despite the legislation pushing the next debt ceiling debate past the 2024 U.S. presidential election, rating agency Fitch Ratings maintained a Negative Outlook for the U.S. sovereign credit profile, citing the following concerns in their June 2 publication.
“Fitch believes that repeated political standoffs around the debt limit and last-minute suspensions before the x-date (when the Treasury’s cash position and extraordinary measures are exhausted) lowers confidence in governance on fiscal and debt matters”
Fitch Ratings, June 2, 2023
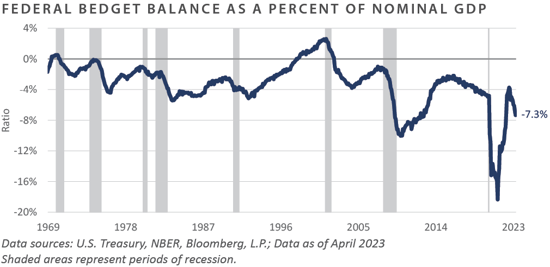
Indeed, even though the U.S. economy has been in the midst of a modest economic expansion, the federal budget deficit as a percentage of gross domestic product (GDP) stood at 7.3% through April. More sobering is the general trend of the government’s fiscal situation since the late 1990s, with the budget balance ratio seemingly resetting to lower lows and lower highs following each economic downturn.
With the latest debt ceiling impasse finally resolved, investors have refocused their sights on continued banking system strains, stubborn inflation and recessionary pressures, and the expected path of Federal Reserve (Fed) monetary policy, the latter of which has evolved in recent weeks to reflect a meaningfully higher year-end policy rate versus that discounted by the bond market in March and April. Moreover, despite May’s choppy market performance, the strong risk-on tailwinds that formed during the first five months of the year have aided in sending valuation levels materially higher, adding to the growing number of macro concerns investors will digest as the summer season approaches.
To summarize, performance across the financial markets was overwhelmingly negative in May, as investors anxiously awaited passage of bipartisan legislation aimed at guiding the near-term course of the government’s fiscal affairs, ultimately culminating in the early June passage of the Fiscal Responsibility Act, which suspends the public debt limit through January 1, 2025. With the can kicked nearly 19 months down the road, unresolved macro headwinds in the way of potential further Fed tightening, persistent inflation and recessionary pressures, and continued banking system strains have provided global asset allocators with much to digest.
Market Summary
Global Equity
- Global equity returns fell slightly in May as the U.S. debt ceiling issue negatively impacted equity markets. Large cap technology stocks performed well, while commodity-sensitive sectors lagged. Economic data was also split, as service sector data were strong for the month and manufacturing data were weak.
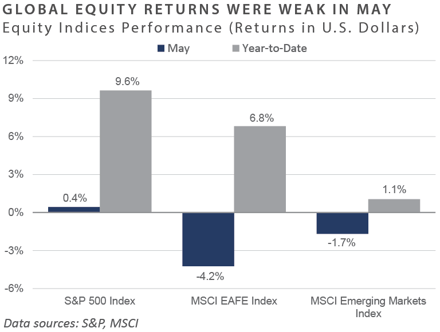
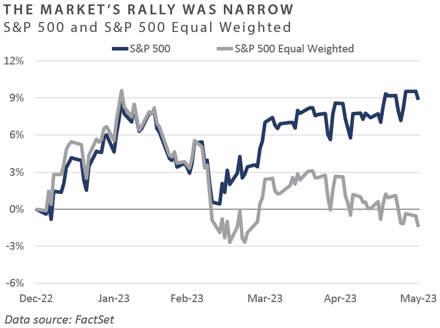
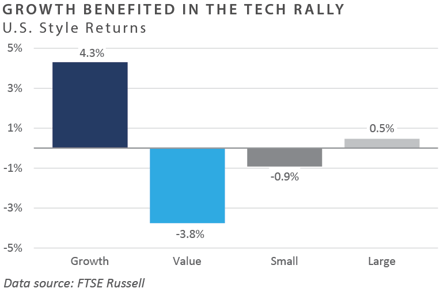
- U.S. equity market returns ascended primarily due to the top-heavy, market-weighted index construction of the S&P 500 Index. Growth outperformed value by almost 7%, led by large cap technology stocks. Nvidia (NVDA) aided growth equity returns after reporting earnings that beat estimates and raised guidance for the year. This led to a 60% increase in the share price over the month and a brief visit to the trillion-dollar market cap club. Value sectors—e.g., energy and materials—underperformed as global demand, particularly in China, looked weak.
- Euro zone shares fell in May after a solid start to 2023. Similar to the rest of the world, information technology was the standout sector, with most other sectors lagging. Revised GDP data for Germany showed negative growth for the second consecutive quarter. UK equities also posted a negative performance, as the country’s significant exposure to energy and material companies weighed on performance.
- Continuing their strong start to the year, Japanese equities were positive in May. Foreign investors continued to respond positively to the Tokyo Stock Exchange’s measures to increase shareholder returns as companies announced dividends and buybacks. In contrast with other countries, Japan reported an uptick in inflation as the Bank of Japan has not taken steps to minimize inflation impacts.
- Emerging market equities returns were negative for the month. Large weights in the index—e.g., China and Hong Kong—contributed to underperformance on the back of month-over-month contractions in reopening data such as retail sales and industrial production. In line with the rest of the world, markets with strong information technology sectors, such as Taiwan and Korea, were strong index performers.
Fixed Income
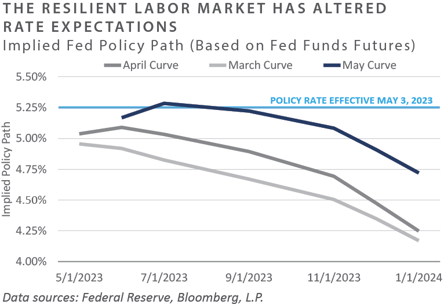
- May was characterized by heightened interest rate volatility spurred by resilient labor market reports. The 2-year Treasury yields traded in a range of 79 bps before ending the month at 4.4%. Similarly, the 10-year Treasury yields experienced a range of 46 bps before ending the month at 3.6%. While the 10-year/2-year Treasury yield spread had hovered between -40 bps and -60 bps since mid-March, the last week of May saw the yield curve dip further, with the spread ending the month near -0.8%.
- Nonfarm payrolls increased 339,000 in May, more than 75% above estimates. At the same time, the unemployment rate rose to 3.7%, higher than the estimate of 3.5%, making May’s jobless rate the highest since October 2022. May proved to be the 13th consecutive month of sell-side firms underestimating non-farm payrolls, highlighting the labor market’s resilience. Furthermore, April’s JOLTs report—released in May—noted a 350k increase in job openings month-over-month.
- These better-than-expected labor market reports spurred the latest jump in Treasury yields as market participants revised expectations for the policy rate path. However, Jerome Powell tempered expectations of a rate hike at the Fed’s next meeting in June, as he offered dovish commentary and sought flexibility for the upcoming decision. Market-based expectations estimate a 70% chance of a rate hike by the July meeting as of the end of May.
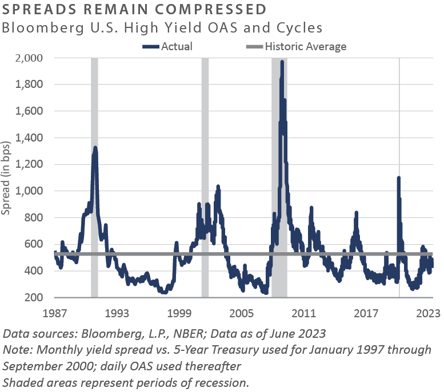
- Despite the uncertain macroeconomic backdrop, credit spreads remain below their historical averages. Investment grade (IG) option-adjusted spreads widened 1 bps to 1.42%, while high yield (HY) spreads widened 16 bps to 4.69%. New issue markets in below investment grade securities remain subdued, but mergers & acquisitions M&A activity began to show signs of life with several refinancings and M&A-linked transactions printing with strong investor demand.
- Legislation to suspend the debt ceiling through January 2025 caused short-dated Treasury bill yields to rally. The discussion now shifts to the Treasury raising new debt and reloading the Treasury General Account that has been depleted over recent months with no replenishments in the form of taxes or new debt. Sell-side estimates point to $1 trillion in new bills issued over the coming months, roughly five times the supply of an average three-month stretch before the 2020 pandemic. These actions will likely drain liquidity from the market in conjunction with the Fed’s balance sheet beginning to shrink again.
Real Assets
REAL ESTATE
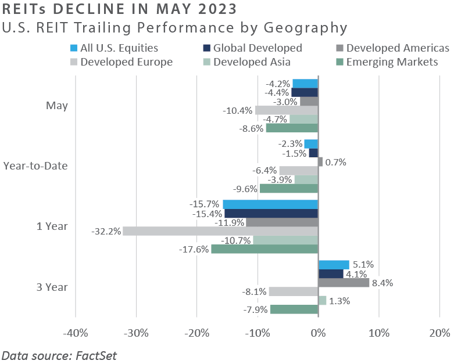
- Global real estate returns were negative across geographies in May. REITs continued to feel the pain of elevated interest rates and were materially impacted by concerns about the possibility of the U.S. government defaulting on its debt.
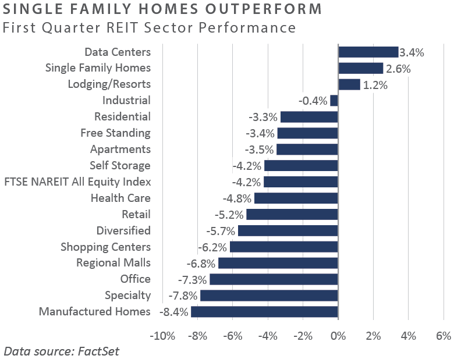
- Single-family home REITs have been an outperforming sector in 2023 and were a top performer in May. Single-family home builders pulled back supply from an already supply-constrained market, supporting more robust fundamentals than multifamily, where builders continue to add supply. Sunbelt cities are expected to see the greatest increase in multifamily unit supply, resulting in lower occupancy rates and flattening rents, according to Green Street.
NATURAL RESOURCES
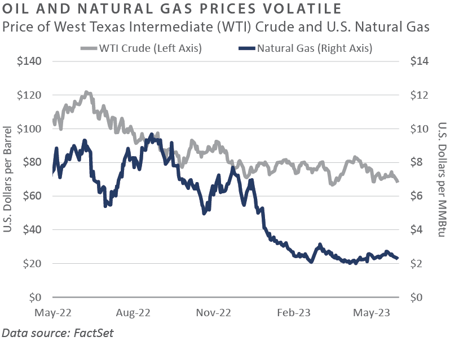
- Commodity prices were heavily pressured in May over concerns of a deteriorating economy if the U.S. government were to default on its debt. West Texas Intermediate (WTI) crude oil prices were back above $70 per barrel at the end of May after the U.S. House of Representatives passed legislation suspending the debt ceiling. Natural gas prices continued to fall materially during May, as U.S. natural gas stockpiles reached 557 billion cubic feet (bcf) higher than the year prior and well above the five-year average after warmer winter weather reduced demand.
- OPEC+ met on June 3rd and 4th to discuss production targets between member countries, with highlights including Saudi Arabia volunteering to cut an additional one million barrels per day and planning to extend 500k barrel per day cuts until 2024. Both Iraq and Russia also plan to extend production cuts until 2024. Furthermore, OPEC+ agreed to a production target of roughly 40.5 million barrels per day, a reduction from previous targets, to support oil prices.
INFRASTRUCTURE
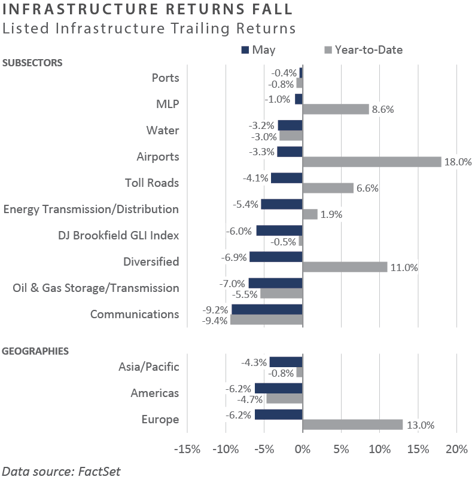
- All global listed infrastructure sectors posted negative performance in May, as looming recession concerns continue to weigh on the sector. The communications sector was the largest underperformer during the month. In mid-May, Dish Network’s Executive VP of Network Development reiterated the company’s plan to “pause” its 5G network buildout later in 2023. This pause in expansion capital expenditure was viewed as a negative signal for the cell tower sector, as it may reduce leasing activity for the major cell tower companies.
Diversifying Strategies
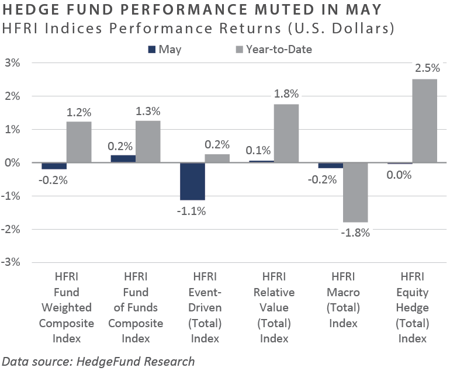
- Hedge fund returns were slightly negative in May, with the HFRI Fund Weighted Composite Index down -0.2%. The HFRI Event-Driven Index was the largest detractor, down 1.1%. The HFRI Fund of Funds and the HFRI Relative Value indices were the only strategies to produce slightly positive returns, up 20 bps and 10 bps, respectively.
- Hedged equity was flat over the month, slightly underperforming the S&P 500. The HFRI Equity Hedge Technology Index had a strong reversal from April’s poor performance, as the index returned 3.8% in May. HFRI Equity Hedge Healthcare Index continued to perform well, while HFRI Equity Hedge Energy/Basic Materials declined 1.2%.
- The challenging environment for macro strategies dragged on, as the strategy dropped 20 bps in May. Further interest rate hikes, persistent inflation, and substantial energy price fluctuations have proven to be a challenging economic environment for discretionary and systematic managers. Commodity prices have decreased in the aggregate since the highs of 2022. Macro strategies, therefore, have been prompt to trade around the positive outliers such as silver, tin, and sugar. Divergent monetary policies among major central banks have created arbitrage opportunities in rates, which has benefited relative value strategies, but often at the expense of macro players’ long-term theses.
INDICES
The Alerian MLP Index is a composite of the 50 most prominent energy Master Limited Partnerships that provides investors with an unbiased, comprehensive benchmark for this emerging asset class.
Bloomberg Fixed Income Indices is an index family comprised of the Bloomberg US Aggregate Index, Government/Corporate Bond Index, Mortgage-Backed Securities Index, and Asset-Backed Securities Index, Municipal Index, High-Yield Index, Commodity Index and others designed to represent the broad fixed income markets and sectors. On August 24, 2016, Bloomberg acquired these long-standing assets from Barclays Bank PLC. and on August 24, 2021, they were rebranded as the Bloomberg Fixed Income Indices. See https://www.bloomberg.com/markets/rates-bonds/bloomberg-fixed-income-indices for more information.
The CBOE Volatility Index (VIX) is an up-to-the-minute market estimate of expected volatility that is calculated by using real-time S&P 500 Index option bid/ask quotes. The Index uses nearby and second nearby options with at least eight days left to expiration and then weights them to yield a constant, 30-day measure of the expected volatility of the S&P 500 Index.
FTSE Real Estate Indices (NAREIT Index and EPRA/NAREIT Index) includes only those companies that meet minimum size, liquidity and free float criteria as set forth by FTSE and is meant as a broad representation of publicly traded real estate securities. Relevant real estate activities are defined as the ownership, disposure, and development of income-producing real estate. See https://www.ftserussell.com/index/category/real-estate for more information.
HFRI Monthly Indices (HFRI) are equally weighted performance indexes, compiled by Hedge Fund Research Inc. (HFX), and are used by numerous hedge fund managers as a benchmark for their own hedge funds. The HFRI are broken down into 37 different categories by strategy, including the HFRI Fund Weighted Composite, which accounts for over 2,000 funds listed on the internal HFR Database. The HFRI Fund of Funds Composite Index is an equal weighted, net of fee, index composed of approximately 800 fund- of- funds which report to HFR. See www.hedgefundresearch.com for more information on index construction.
J.P. Morgan’s Global Index Research group produces proprietary index products that track emerging markets, government debt, and corporate debt asset classes. Some of these indices include the JPMorgan Emerging Market Bond Plus Index, JPMorgan Emerging Market Local Plus Index, JPMorgan Global Bond Non-U.S. Index and JPMorgan Global Bond Non-U.S. Index. See www.jpmorgan.com for more information.
Merrill Lynch high yield indices measure the performance of securities that pay interest in cash and have a credit rating of below investment grade. Merrill Lynch uses a composite of Fitch Ratings, Moody’s and Standard and Poor’s credit ratings in selecting bonds for these indices. These ratings measure the risk that the bond issuer will fail to pay interest or to repay principal in full. See www.ml.com for more information.
Morgan Stanley Capital International – MSCI is a series of indices constructed by Morgan Stanley to help institutional investors benchmark their returns. There are a wide range of indices created by Morgan Stanley covering a multitude of developed and emerging economies and economic sectors. See www.morganstanley.com for more information.
The FTSE Nareit All Equity REITs Index is a free-float adjusted, market capitalization-weighted index of U.S. equity REITs.
Russell Investments rank U.S. common stocks from largest to smallest market capitalization at each annual reconstitution period (May 31). The primary Russell Indices are defined as follows: 1) the top 3,000 stocks become the Russell 3000 Index, 2) the largest 1,000 stocks become the Russell 1000 Index, 3) the smallest 800 stocks in the Russell 1000 Index become the Russell Midcap index, 4) the next 2,000 stocks become the Russell 2000 Index, 5) the smallest 1,000 in the Russell 2000 Index plus the next smallest 1,000 comprise the Russell Microcap Index, and 6) U.S. Equity REITs comprise the FTSE Nareit All Equity REIT Index. See www.russell.com for more information.
S&P 500 Index consists of 500 stocks chosen for market size, liquidity and industry group representation, among other factors by the S&P Index Committee, which is a team of analysts and economists at Standard and Poor’s. The S&P 500 is a market-value weighted index, which means each stock’s weight in the index is proportionate to its market value and is designed to be a leading indicator of U.S. equities, and meant to reflect the risk/return characteristics of the large cap universe. See www.standardandpoors.com for more information.
Information on any indices mentioned can be obtained either through your advisor or by written request to information@feg.com.
DISCLOSURES
This report was prepared by FEG (also known as Fund Evaluation Group, LLC), a federally registered investment adviser under the Investment Advisers Act of 1940, as amended, providing non-discretionary and discretionary investment advice to its clients on an individual basis. Registration as an investment adviser does not imply a certain level of skill or training. The oral and written communications of an adviser provide you with information about which you determine to hire or retain an adviser. Fund Evaluation Group, LLC, Form ADV Part 2A & 2B can be obtained by written request directly to: Fund Evaluation Group, LLC, 201 East Fifth Street, Suite 1600, Cincinnati, OH 45202, Attention: Compliance Department.
The information herein was obtained from various sources. FEG does not guarantee the accuracy or completeness of such information provided by third parties. The information in this report is given as of the date indicated and believed to be reliable. FEG assumes no obligation to update this information, or to advise on further developments relating to it. FEG, its affiliates, directors, officers, employees, employee benefit programs and client accounts may have a long position in any securities of issuers discussed in this report.
Index performance results do not represent any managed portfolio returns. An investor cannot invest directly in a presented index, as an investment vehicle replicating an index would be required. An index does not charge management fees or brokerage expenses, and no such fees or expenses were deducted from the performance shown.
Bloomberg Index Services Limited. BLOOMBERG® is a trademark and service mark of Bloomberg Finance L.P. and its affiliates (collectively “Bloomberg”). Bloomberg or Bloomberg’s licensors own all proprietary rights in the Bloomberg Indices. Bloomberg does not approve or endorse this material or guarantee the accuracy or completeness of any information herein, nor does Bloomberg make any warranty, express or implied, as to the results to be obtained therefrom, and, to the maximum extent allowed by law, Bloomberg shall not have any liability or responsibility for injury or damages arising in connection therewith.
Neither the information nor any opinion expressed in this report constitutes an offer, or an invitation to make an offer, to buy or sell any securities.
Any return expectations provided are not intended as, and must not be regarded as, a representation, warranty or predication that the investment will achieve any particular rate of return over any particular time period or that investors will not incur losses.
Past performance is not indicative of future results.
Investments in private funds are speculative, involve a high degree of risk, and are designed for sophisticated investors.
All data is as of May 31, 2023 unless otherwise noted.