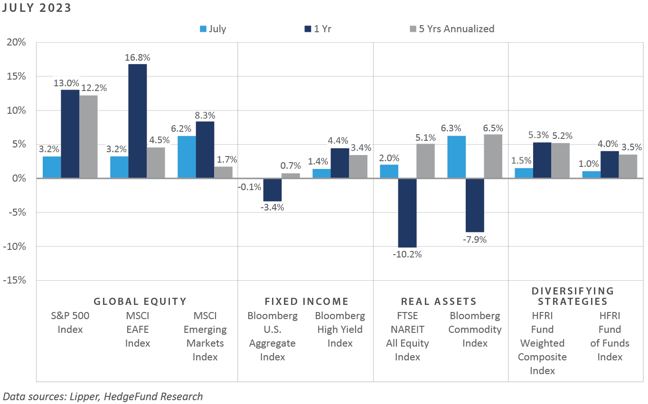
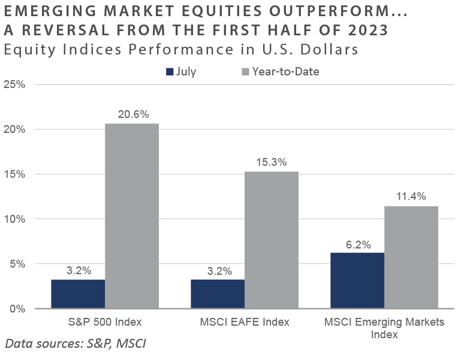
Strong risk-on tailwinds that developed throughout the first half of 2023 persisted into July, with global investors embracing resilient U.S. economic data, an easing of inflationary pressures, and a potential end in sight for the Fed’s historic tightening campaign. Performance across global equities was overwhelmingly positive on the month, particularly within the emerging markets, which nearly doubled the return generated by U.S. large cap. The riskon market sentiment was also evident across the bond market, with performance favoring credit-oriented sectors, sending credit spreads to well-below historical averages. Real asset returns were similarly positive in July, particularly among the commodity indices, as the Bloomberg Commodity Index posted a 6.3% gain, the strongest monthly performance since March 2022. A further rise across commodity prices, however, could support a reacceleration in headline inflationary pressures, in turn potentially leading the Federal Reserve (Fed) to remain on its tightening path.
Economic Update
Fitch Strips U.S. of 'AAA' Credit Rating, Citing Near- and Long-Term Fiscal Challenges
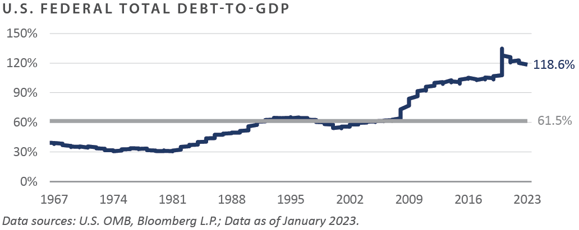
On August 1, Fitch Ratings stripped the U.S. of its ‘AAA’ long-term credit rating, with a one-notch downgrade to ‘AA+’ citing “expected fiscal deterioration over the next three years, a high and growing general government debt burden, and the erosion of governance relative to 'AA' and 'AAA' rated peers over the last two decades that has manifested in repeated debt limit standoffs and last-minute resolutions.” (Source: Fitch Ratings, 8/1/2023)
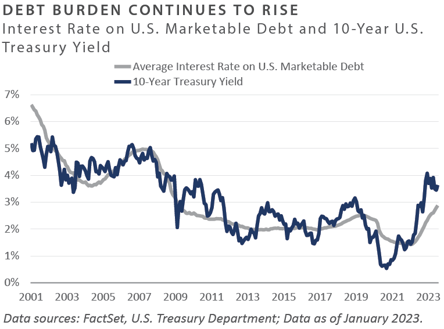
Through January, gross government debt as a share of nominal gross domestic product (GDP) stood just below 120%, a ratio modestly below the 135% peak established during the brief COVID-19 economic downturn and a level anticipated to increase further during the next economic downturn. Moreover, at 118.6%, federal debt-to-GDP is more than 20 percentage points higher than the last time the U.S. suffered a credit rating downgrade in August 2011 by Standard and Poor’s.
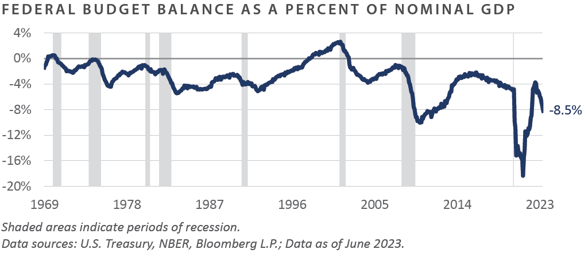
In addition to a growing government debt burden and erosion of fiscal governance, Fitch cited “expected fiscal deterioration over the next three years.” Similar to the current elevated ratio of government debt relative to GDP, the Treasury’s budget deficit as a percentage of GDP also paints a worrisome picture of the country’s fiscal health. Despite the economy still in the midst of an economic expansion, the Treasury’s budget deficit as a share of GDP has deteriorated in recent months and is nearing a double-digit reading.
Through June, the budget deficit, at 8.5% of GDP, is trending in a particularly unfavorable direction. Excluding the COVID-era extraordinary fiscal actions aimed at shoring up the U.S. economy and the brief, sharp decline in GDP growth, the current outsized budget deficit relative to GDP is closing in on the 10% reading that was breached in 2010 as the economy was clawing itself out of the 2008-2009 Global Financial Crisis. Moreover, due to a sharp rise in Treasury interest rates and a ballooning debt overhang, the Congressional Budget Office (CBO) anticipates that the U.S. could spend more than $1 trillion annually on interest expense over the coming ten years.
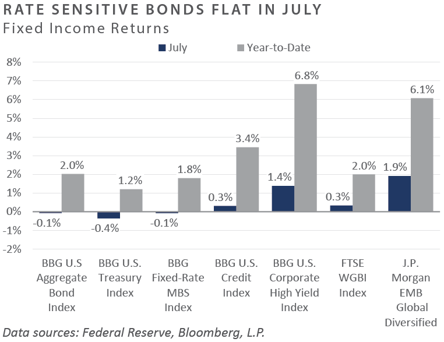
In summary, financial market performance was significantly positive in July, as risk-on sentiment supported performance across most major asset classes and categories, while a modest monthly rise in Treasury rates negatively impacted performance across the higher quality, rate-sensitive sectors of the bond market. Despite 12 years having passed since Standard and Poor’s (S&P's) downgraded the U.S. from ‘AAA’ to ‘AA+', Fitch Ratings finally followed in S&P’s footsteps by stripping the U.S. of its ‘AAA’ long-term sovereign credit rating, with an early-August one-notch downgrade to ‘AA+’ amid current and anticipated fiscal challenges.
Market Summary
Global Equity
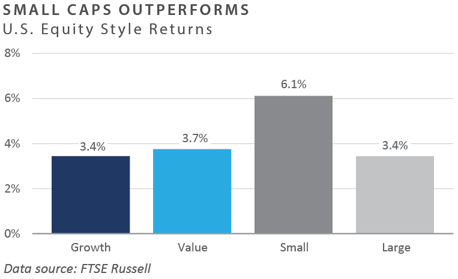
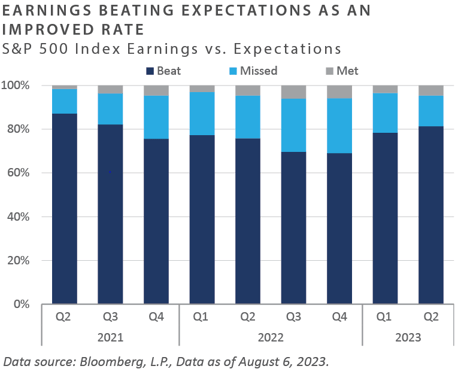
- Global equity markets produced positive returns over July, with emerging markets outperforming developed markets. In the U.S., small cap performance was strong and beat large caps stocks. Positive economic data supporting the soft-landing narrative has boosted the risk-on sentiment in recent months, and earnings beats have improved from levels witnessed in the latter half of 2022.
- U.S. equity markets showed breadth as every sector produced positive returns. The energy and communication services sectors finished as the top performers. Improving economic growth data and expectations of a tighter oil supply drove energy’s performance.
- Eurozone shares rose, as the real estate sector posted the most significant gains, up 13.0%, supported by falling inflation and economic growth data surprising to the upside. In the UK, equity performance was positive as the country experienced easing inflationary pressures, with June’s headline Consumer Price Index (CPI) producing the first positive inflation surprise in nearly a year.
- Japanese equities underperformed their developed peers. The Bank of Japan (BoJ) loosened its yield curve control framework, leading the yen to rally. During its July meeting, the BoJ raised its 10-year yield limit. This news positively impacted financials as a potential for higher rates would benefit Japanese banks. With positive economic data and a rallying yen, small and mid cap stocks were the strongest performers.
- Emerging markets were the bestperforming global region in July, with all sectors producing a positive return. Country performance had wide breadth as well. The real estate and consumer discretionary sectors were top performers, backed by Chinese authorities indicating support for the real estate sector and consumption through policy easing and possible stimulus. Latin America was the worst performing region, a reversal from the first half of 2023, as market sentiment tempered.
Fixed Income
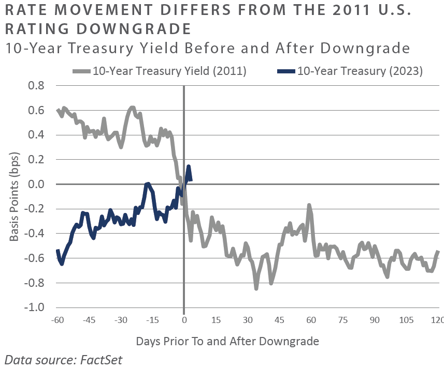
- Appetite for risk and continued strength spurred rates higher. Interest rates pushed year-to-date highs before rallying on a softer-than-expected CPI reading from June. The 10-year Treasury yield rose to 3.97% after trading within a roughly 0.25% range in July. The inversion between the 10- year and 2-year Treasury reached cycle lows in early July before modestly steepening in the final weeks of the month in a bear steepener. The majority of the yield curve remains in inverted territory. As previously mentioned, Fitch downgraded their rating of U.S. debt on August 1, citing worsening fiscal conditions. Yields have been on an upward trend, differing from the direction of yields during S&P’s 2011 U.S. credit rating downgrade.
- After pausing in their June meeting, the Fed voted to increase the policy rate by 0.25% to 5.25-5.50%. While the increase in policy rate was in line with market expectations, fixed income investors were surprised by the BoJ tweak to yield curve control. After the BoJ widened the tolerance bands for Japanese Government Bonds (JGBs) earlier this year, Governor Kazuo surprised markets by raising the band once more to an upper limit of 1.0%. This sparked a selloff in the intermediate and long end of the Japanese yield curve as JGP yields reached the highest levels in over nine years. Despite the tweak in policy, the BoJ again unexpectedly intervened in the bond market with unscheduled purchases to dampen volatility.
- Corporate earnings came in broadly in line with expectations as corporate fundamentals remain resilient, supporting credit markets. Positive earnings outlook and strong risk appetite drove spreads tighter across investment grade (IG) and high yield (HY), offsetting the negative impact of interest rates. Spreads remain historically tight, with IG and HY spreads falling to 1.19% and 3.79%, respectively.
Real Assets
REAL ESTATE
- Global real estate transaction volumes remain suppressed to the lowest quarterly level in five years, according to Preqin, while the National Council of Real Estate Investment Fiduciary (NCREIF) Private Property Index (PPI) index returned its third straight negative quarterly return.
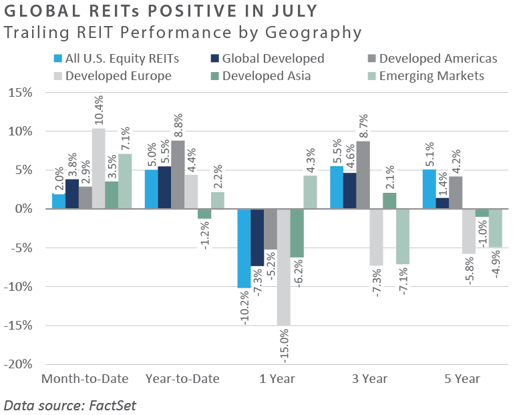
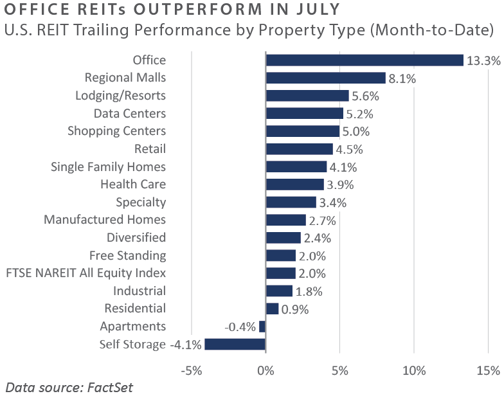
- All U.S. real estate investment trust (REIT) sectors, excluding apartments, cell towers, and self-storage, had positive returns in July. The office sector was the top performing sector, as market participants looked to capitalize on significant discounts to net asset value (NAV). The office sector remained challenged by the shift towards hybrid work schedules. Alternatively, the telecommunications infrastructure sector (cell tower companies) underperformed for the month and year-to-date due partly to concerns about slower spending on 5G.
NATURAL RESOURCES
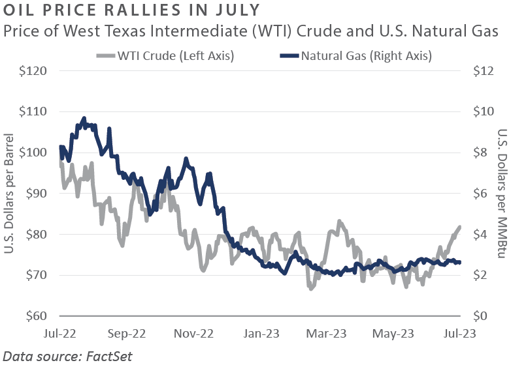
- West Texas Intermediate (WTI) crude oil rose more than 15% in July, and gasoline prices reached their highest level in eight months. Global oil demand hit an all-time high of 102.5 million barrels per day, surpassing the pre-COVID high. The U.S. oil rig count fell to its lowest level in 16 months, and Saudia Arabia extended its voluntary one million barrels per day crude oil production cut into September.
- Global food commodity prices rose modestly in July after Russia terminated the Black Sea Grain Initiative. The deal was brokered to alleviate a global food crisis due to Russia’s invasion of Ukraine, one of the world’s top exporters of grains.
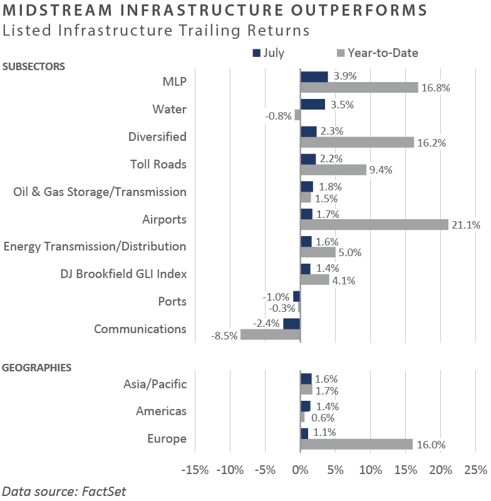
INFRASTRUCTURE
- Nearly all global infrastructure subsectors were positive during July, excluding marine ports and communications. Midstream energy master limited partnerships (MLPs) outperformed in July, and year-to-date, as the crude oil price rally gained momentum and company fundamentals continued to improve. The telecommunications sector remained challenged by rising interest rates and concerns about a slower 5G rollout.
Diversifying Strategies
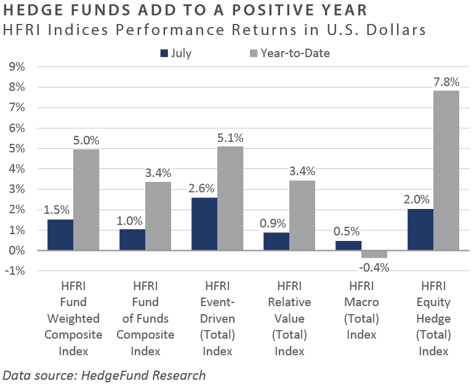
- Hedge fund returns were positive over the month, with the HFRI Fund Weighted Composite Index up 1.5%. Each major strategy ended July in positive territory, with the strongest performer being the HFRI Event-Driven Index, followed by the HFRI Equity Hedge (EH) Index and the HFRI Fund Weighted Composite Index.
- HFRI Macro Index combined two consecutive positive months for the first time in 2023. Long positions in gasoline, crude oil, and heating oil were notable contributors to macro strategies. The short Japanese yen against the U.S. dollar position struggled in July due to a choppy trade environment caused by Bank of Japan policy change speculation, improved U.S. inflation data, and higher wage growth. The weakening dollar, due partly to cooling inflation, may challenge traders to change their conviction about the short yen position.
- Within hedged equity, only the HFRI EH: Multi-Strategy Index had negative performance in July. The highest-performing indexes were the HFRI EH Technology Index, the HFRI EH: Quantitative Directional Index, and the HFRI EH: Fundamental Value Index. Throughout July, hedged equity funds accounted for most of the net selling of long equities, while hedge funds, as a whole, positioned themselves directionally longer in equity markets. The overall movement long was primarily achieved via funds covering short positions as opposed to adding longs.
INDICES
The Alerian MLP Index is a composite of the 50 most prominent energy Master Limited Partnerships that provides investors with an unbiased, comprehensive benchmark for this emerging asset class.
Bloomberg Fixed Income Indices is an index family comprised of the Bloomberg US Aggregate Index, Government/Corporate Bond Index, Mortgage-Backed Securities Index, and Asset-Backed Securities Index, Municipal Index, High-Yield Index, Commodity Index and others designed to represent the broad fixed income markets and sectors. On August 24, 2016, Bloomberg acquired these long-standing assets from Barclays Bank PLC. and on August 24, 2021, they were rebranded as the Bloomberg Fixed Income Indices. See https://www.bloomberg.com/markets/rates-bonds/bloomberg-fixed-income-indices for more information.
The CBOE Volatility Index (VIX) is an up-to-the-minute market estimate of expected volatility that is calculated by using real-time S&P 500 Index option bid/ask quotes. The Index uses nearby and second nearby options with at least eight days left to expiration and then weights them to yield a constant, 30-day measure of the expected volatility of the S&P 500 Index.
FTSE Real Estate Indices (NAREIT Index and EPRA/NAREIT Index) includes only those companies that meet minimum size, liquidity and free float criteria as set forth by FTSE and is meant as a broad representation of publicly traded real estate securities. Relevant real estate activities are defined as the ownership, disposure, and development of income-producing real estate. See https://www.ftserussell.com/index/category/real-estate for more information.
HFRI Monthly Indices (HFRI) are equally weighted performance indexes, compiled by Hedge Fund Research Inc. (HFX), and are used by numerous hedge fund managers as a benchmark for their own hedge funds. The HFRI are broken down into 37 different categories by strategy, including the HFRI Fund Weighted Composite, which accounts for over 2,000 funds listed on the internal HFR Database. The HFRI Fund of Funds Composite Index is an equal weighted, net of fee, index composed of approximately 800 fund- of- funds which report to HFR. See www.hedgefundresearch.com for more information on index construction.
J.P. Morgan’s Global Index Research group produces proprietary index products that track emerging markets, government debt, and corporate debt asset classes. Some of these indices include the JPMorgan Emerging Market Bond Plus Index, JPMorgan Emerging Market Local Plus Index, JPMorgan Global Bond Non-U.S. Index and JPMorgan Global Bond Non-U.S. Index. See www.jpmorgan.com for more information.
Merrill Lynch high yield indices measure the performance of securities that pay interest in cash and have a credit rating of below investment grade. Merrill Lynch uses a composite of Fitch Ratings, Moody’s and Standard and Poor’s credit ratings in selecting bonds for these indices. These ratings measure the risk that the bond issuer will fail to pay interest or to repay principal in full. See www.ml.com for more information.
Morgan Stanley Capital International – MSCI is a series of indices constructed by Morgan Stanley to help institutional investors benchmark their returns. There are a wide range of indices created by Morgan Stanley covering a multitude of developed and emerging economies and economic sectors. See www.morganstanley.com for more information.
The FTSE Nareit All Equity REITs Index is a free-float adjusted, market capitalization-weighted index of U.S. equity REITs.
Russell Investments rank U.S. common stocks from largest to smallest market capitalization at each annual reconstitution period (May 31). The primary Russell Indices are defined as follows: 1) the top 3,000 stocks become the Russell 3000 Index, 2) the largest 1,000 stocks become the Russell 1000 Index, 3) the smallest 800 stocks in the Russell 1000 Index become the Russell Midcap index, 4) the next 2,000 stocks become the Russell 2000 Index, 5) the smallest 1,000 in the Russell 2000 Index plus the next smallest 1,000 comprise the Russell Microcap Index, and 6) U.S. Equity REITs comprise the FTSE Nareit All Equity REIT Index. See www.russell.com for more information.
S&P 500 Index consists of 500 stocks chosen for market size, liquidity and industry group representation, among other factors by the S&P Index Committee, which is a team of analysts and economists at Standard and Poor’s. The S&P 500 is a market-value weighted index, which means each stock’s weight in the index is proportionate to its market value and is designed to be a leading indicator of U.S. equities, and meant to reflect the risk/return characteristics of the large cap universe. See www.standardandpoors.com for more information.
Information on any indices mentioned can be obtained either through your advisor or by written request to information@feg.com.
DISCLOSURES
This report was prepared by FEG (also known as Fund Evaluation Group, LLC), a federally registered investment adviser under the Investment Advisers Act of 1940, as amended, providing non-discretionary and discretionary investment advice to its clients on an individual basis. Registration as an investment adviser does not imply a certain level of skill or training. The oral and written communications of an adviser provide you with information about which you determine to hire or retain an adviser. Fund Evaluation Group, LLC, Form ADV Part 2A & 2B can be obtained by written request directly to: Fund Evaluation Group, LLC, 201 East Fifth Street, Suite 1600, Cincinnati, OH 45202, Attention: Compliance Department.
The information herein was obtained from various sources. FEG does not guarantee the accuracy or completeness of such information provided by third parties. The information in this report is given as of the date indicated and believed to be reliable. FEG assumes no obligation to update this information, or to advise on further developments relating to it. FEG, its affiliates, directors, officers, employees, employee benefit programs and client accounts may have a long position in any securities of issuers discussed in this report.
Index performance results do not represent any managed portfolio returns. An investor cannot invest directly in a presented index, as an investment vehicle replicating an index would be required. An index does not charge management fees or brokerage expenses, and no such fees or expenses were deducted from the performance shown.
Bloomberg Index Services Limited. BLOOMBERG® is a trademark and service mark of Bloomberg Finance L.P. and its affiliates (collectively “Bloomberg”). Bloomberg or Bloomberg’s licensors own all proprietary rights in the Bloomberg Indices. Bloomberg does not approve or endorse this material or guarantee the accuracy or completeness of any information herein, nor does Bloomberg make any warranty, express or implied, as to the results to be obtained therefrom, and, to the maximum extent allowed by law, Bloomberg shall not have any liability or responsibility for injury or damages arising in connection therewith.
Neither the information nor any opinion expressed in this report constitutes an offer, or an invitation to make an offer, to buy or sell any securities.
Any return expectations provided are not intended as, and must not be regarded as, a representation, warranty or predication that the investment will achieve any particular rate of return over any particular time period or that investors will not incur losses.
Past performance is not indicative of future results.
Investments in private funds are speculative, involve a high degree of risk, and are designed for sophisticated investors.
All data is as of July 31, 2023 unless otherwise noted.