


-01.webp?width=400)


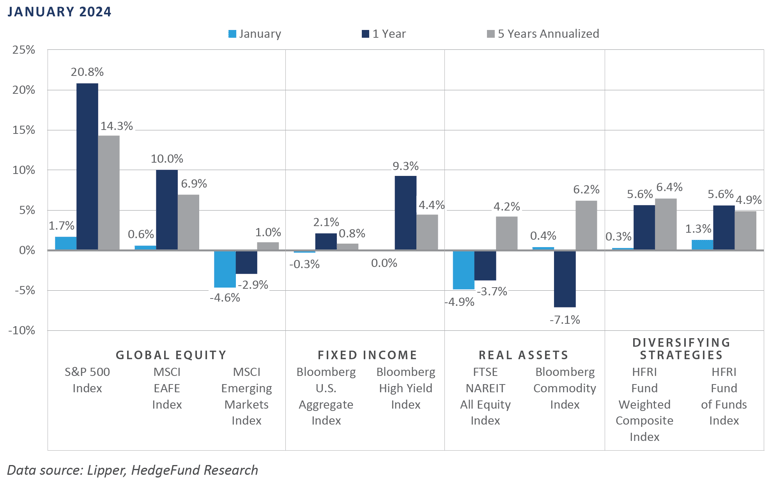
On the heels of positive performance across most global asset classes and categories in the fourth quarter of 2023, the first month of 2024 presented investors with mixed performance to begin the new year. In the global equity markets, the long-standing theme of domestic equities outperforming international remained firmly in place through January, particularly when viewed versus emerging market equities, as Chinese equities continued to serve as a millstone around the broader emerging market equity index’s neck. Within the bond market, interest rates were generally static for the month, while below investment-grade credit risk premiums widened modestly from their historically low levels. These two forces translated into a mostly flat performance out of the major bond market sectors to begin 2024. Structurally, despite a growing narrative that the Federal Reserve (Fed) has achieved the historically difficult feat of a soft landing, the Treasury yield curve remained inverted, suggesting that not only does monetary policy remain restrictive but it may be a premature assumption to declare victory for the Fed. For January, performance across the primary real asset sectors was mixed, with the economically and interest rate-sensitive real estate and global listed infrastructure sectors posting performance declines, while commodity futures eked out a modest gain on the month.
Economic Update
Successfully Navigated Federal Reserve "Soft Landing" Comes into View
A full two years into the Fed’s campaign to restore price stability amid the worst cost of living crisis faced by the U.S. in four decades, the narrative of a successfully engineered economic soft landing—one often characterized by a healthy labor market, near-mandate (2%) inflation, and a stable growth trajectory—has been garnering increased support.
Given the disinflationary path of cost pressures in recent months—including core personal consumption expenditure data from the past three months, which has, on average, trended at an annualized pace of 2%—expectations for a soft landing appear to have merit. Moreover, despite the highest policy rate level in more than 20 years and ongoing quantitative tightening in the form of a $90 billion reduction in the size of the Fed’s balance sheet, both consumer and government spending have remained robust, and the labor market has shown no overwhelming evidence of loosening.
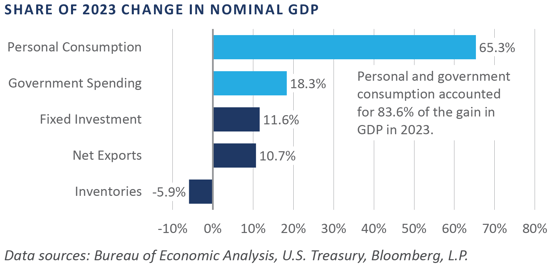
Theoretically, by increasing the cost of money through higher interest rates, the trend rate of consumption growth should turn down, which should ease cost pressures and bring the supply and demand for goods and services closer to balance. In 2023, despite both the federal funds rate being hiked to 5.50% and the yield on the benchmark 10-Year Treasury Note increasing to 5.00% in October, both consumer and government spending increased significantly, while gains across fixed investment, net exports, and inventories appeared muted.
On an annual basis, the U.S. economy grew an impressive $1.6 trillion in 2023, with government spending ($294.5 billion) and personal consumption ($1.1 trillion) accounting for nearly 84% of the increase in economic activity. If the Fed’s goal is to alleviate cost price pressures through curtailing excess consumption/spending, 2023 seemed to have quite the opposite phenomenon.
Moreover, the increase in consumption occurred with a substantially higher price tag than in past years at both the government and consumer level, as interest rates ascended to multi-decade highs in 2023. While consumer-driven consumption drove the lion’s share of economic gains last year (with consumers presumably drawing down pandemic-era surplus savings) a potential turn in the business cycle which will likely be accompanied by higher levels of unemployment, calls into question consumers’ ability to continue bailing out the economy over the near to intermediate term.
To conclude, the first month of 2024 presented investors with a mixed bag of performance across the global financial markets as market participants assessed the timing and magnitude of the Fed's eventual change in course. Most gauges of the health and well-being of the U.S. economy continued to appear sound on the surface—a privilege not shared by many of the country’s key trading partners, particularly China and Europe—adding credence to the notion of an economic soft landing.
Market Summary
Global Equity
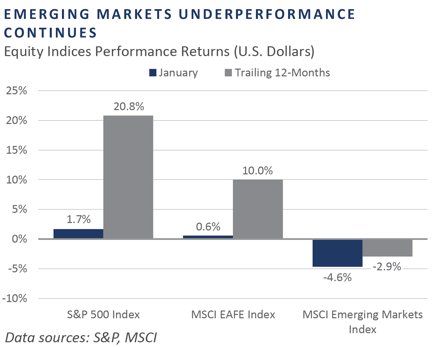
Performance in global equity markets was mixed over January following the strong rally that ended 2023. U.S. and international developed equities provided positive returns for the month as news from the Fed dampened expectations for a rate cut in March, while emerging markets declined amid continued weakness in China. The top-performing sectors within the MSCI All Country World Index that led performance across the globe were information technology, communication services, and healthcare, as the strength of the tech-related securities continued to support markets.
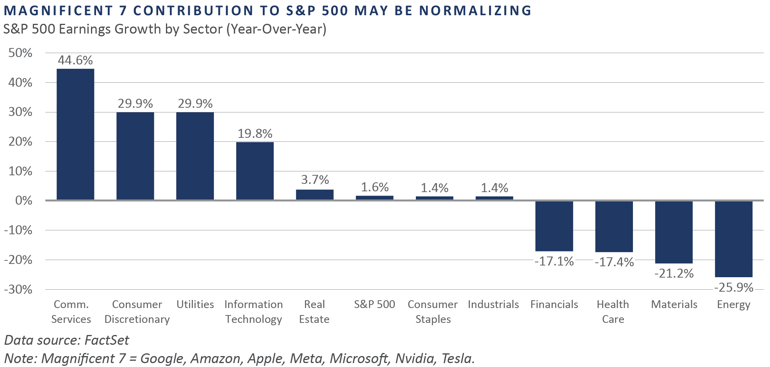
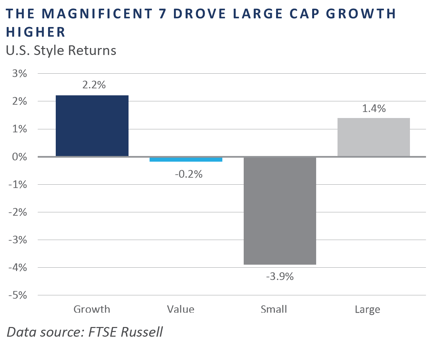
Following impressive gains in November and December, the U.S. equity market marked a third consecutive month of positive performance in January. Many large S&P 500 constituents provided their fourth quarter 2023 earnings reports in the last week of January and showed robust earnings relative to what had been tempered expectations. Of note, Meta Platforms posted revenue gains of 25% year-over-year, coupled with the introduction of a dividend and authorization of a $50 billion share buyback program. This earnings announcement, along with Alphabet’s positive earnings, boosted the communication services sector, which joined information technology as a top performer.
European equities ex-UK finished January with positive returns. Information technology (IT) was the best-performing sector as sanctions against China increased demand for hardware. Germany was a notable source of economic weakness, contracting 0.3% after stagnating for most of the year. European Central Bank did not cut rates as central bankers remained cautious amid lower but still not contained inflation, which measured 2.8% in the eurozone in January.
UK-based equities declined for the month as the nation’s Consumer Price Index unexpectedly increased from 3.9% to 4.0% in December. Conversely, the UK witnessed some positive economic news as the PMI rose to 52.5, out of contraction territory, and consumer confidence hit a two-year high.
Japanese stocks started 2024 strong, outperforming the U.S. and Europe. The yen depreciated, benefiting exporters such as automakers, which supported the consumer discretionary sector. In March of 2023, the Tokyo Stock Exchange encouraged management to implement plans to become more conscious of the cost of capital and share price. In January, the exchange released a list of companies that responded to this request—approximately 40% of the exchange’s listed companies. The Japanese TOPIX Index was up over 25% through 2023 in local currency, as market participants looked favorably on the changes to the Japanese equity markets.
Emerging market equity returns finished the month in negative territory. China was among the worst-performing countries, responsible for over half of the MSCI Emerging Markets Index’s decline. Within China, the information technology and healthcare sectors were the biggest laggards. News of further sanctions from the U.S. against technology companies, coupled with the ongoing property crisis, weighed on sentiment. Indian equities, however, continued their strong performance as the country’s composite PMI measured above 61 amid accelerating business activity.
Fixed Income
January was a quieter month for rates following significant volatility toward the end of 2023. After suffering near-term lows, the 2-year Treasury yield rose 4 basis points in the month to 4.27%, while the 10-year Treasury yield rose 11 basis points to 3.99%. Rates rose mildly following Fed Governor Christopher Waller’s mid-month speech pushing back on market cut projections and ended the month with downward momentum on the back of modest economic data.
At the Federal Open Markets Committee meeting on January 31, Chairman Jerome Powell indicated a March cut was unlikely as more inflation data is needed, leading to a significant decline in market rate cut projections for March. Powell also emphasized the relative strength of the U.S. economy but pushed back against assertions that a soft landing is a foregone conclusion.
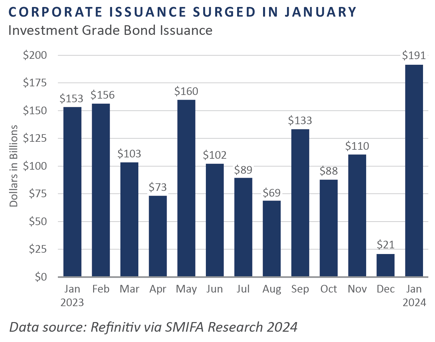
Corporate bond spreads remain tight following minor movement in January. Investment grade (IG) spreads fell 2 basis points to 1.02%, while high yield (HY) spreads rose 20 basis points to 3.59%, both well below historical levels. These spreads, along with encouraging economic data, align with the soft landing narrative. Additionally, IG companies issued over $190 billion in bonds, the highest recorded amount for January. Demand has been strong in both the IG and HY new issuance markets, with most deals oversubscribed, indicating investors' appetite for risk.
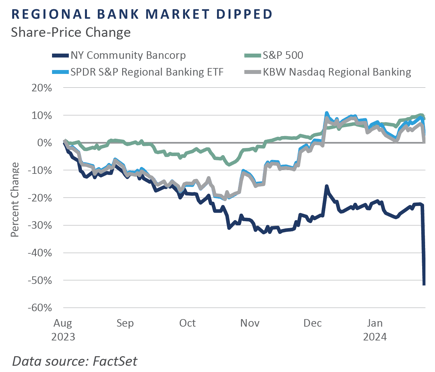
Banking sector concerns returned following New York Community Bancorp's release of disappointing fourth-quarter earnings. After acquiring $40 billion in assets from Signature Bank, which brought total assets over $100 billion and made the bank subject to new regulations, New York Community Bancorp reported $552 million in loan losses, primarily from commercial real estate loans. The company's shares plummeted 38% in one day after posting a net loss of $252 million for the quarter. While this has reignited broader fears for the regional bank market, many believe it to be an idiosyncratic event and remain constructive on banks.
Real Assets
REAL ESTATE
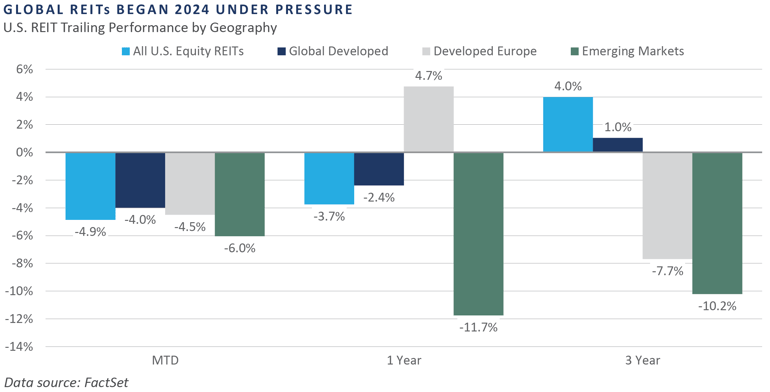
U.S. and global Real Estate Investment Trust (REIT) indices declined in January after a strong December. The negative performance can be attributed in part to a change in rhetoric from Fed governors in January when members alluded to further delays in interest rate cuts.
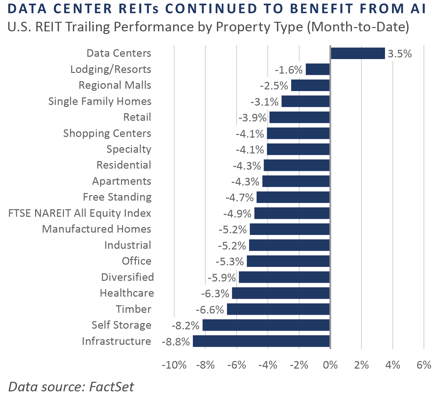
Nearly all REIT subsector indices posted negative returns for January, with the sole exception of the data center index, which continued to benefit from themes around artificial intelligence. As measured by the infrastructure subsector, cell towers lagged other property types in January—after leading the REIT market just a month prior—as valuations remained pressured by higher-for-longer interest rates. Global REIT indices also slightly outperformed the U.S. during the month, which improved the margin of outperformance over the prior year.
NATURAL RESOURCES
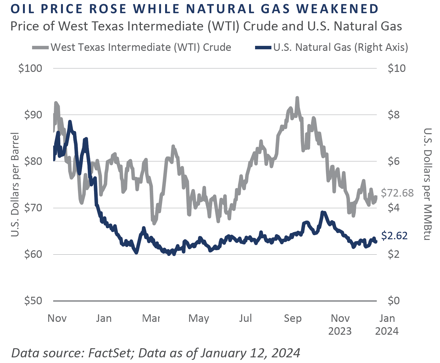
The price of oil, as measured by West Texas Intermediate (WTI), rose over 6% in January and remained range-bound between $70 and $80/barrel. The uplift from geopolitical uncertainty was muted somewhat by concerns of global demand falling due to poor economic conditions, primarily in China. As measured by NYMEX futures prices, natural gas prices declined materially in January to just above $2.00/MMBtu. U.S. producers and transporters have been preparing to capture higher global prices via liquified natural gas (LNG) export terminals coming online to service Europe’s gas needs; however, in January, the Biden administration announced a pause on pending approvals of LNG export terminals.
INFRASTRUCTURE
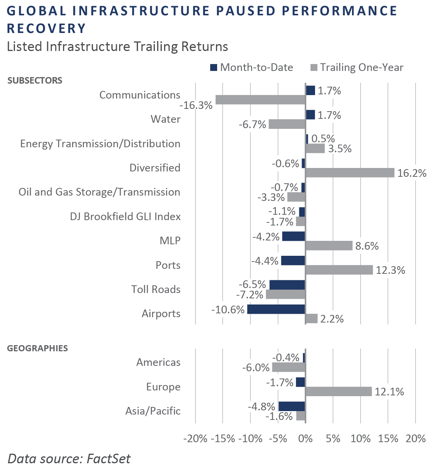
Global listed infrastructure held relatively flat for January, as measured by the Dow Jones Brookfield Global Infrastructure Index. The tone changes from Fed governors in January around delaying interest rate cuts in 2024 added to the sector's headwinds experienced during much of 2023.
Airports, toll roads, and ports were the worst-performing sectors during the month as global demand concerns lingered around potentially weaker economies. European infrastructure outperformed U.S. counterparts over the past year as U.S. valuations entered the rate hiking cycle at lower yields.
Diversifying Strategies
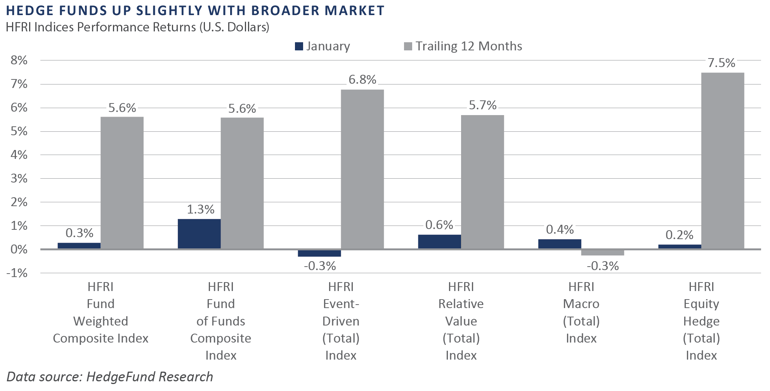
Hedge funds continued their recent positive performance to begin 2024, with impressive contributions from fixed income-based strategies. Gains were concentrated in managers positioned for interest rates to remain elevated for the foreseeable future.
Hedged equity managers focused on healthcare and technology generated strong gains during January. Performance in the broader long/short equity space was more mixed, with a slightly positive performance for the broad index.
Global macro was varied in performance results, with gains coming from long equity positions and losses concentrated in long UK fixed income and exposure to base and precious metals.
INDICES
The Alerian MLP Index is a composite of the 50 most prominent energy Master Limited Partnerships that provides investors with an unbiased, comprehensive benchmark for this emerging asset class.
Bloomberg Fixed Income Indices is an index family comprised of the Bloomberg US Aggregate Index, Government/Corporate Bond Index, Mortgage-Backed Securities Index, and Asset-Backed Securities Index, Municipal Index, High-Yield Index, Commodity Index and others designed to represent the broad fixed income markets and sectors. On August 24, 2016, Bloomberg acquired these long-standing assets from Barclays Bank PLC. and on August 24, 2021, they were rebranded as the Bloomberg Fixed Income Indices. See https://www.bloomberg.com/markets/rates-bonds/bloomberg-fixed-income-indices for more information.
The CBOE Volatility Index (VIX) is an up-to-the-minute market estimate of expected volatility that is calculated by using real-time S&P 500 Index option bid/ask quotes. The Index uses nearby and second nearby options with at least eight days left to expiration and then weights them to yield a constant, 30-day measure of the expected volatility of the S&P 500 Index.
FTSE Real Estate Indices (NAREIT Index and EPRA/NAREIT Index) includes only those companies that meet minimum size, liquidity and free float criteria as set forth by FTSE and is meant as a broad representation of publicly traded real estate securities. Relevant real estate activities are defined as the ownership, disposure, and development of income-producing real estate. See https://www.ftserussell.com/index/category/real-estate for more information.
HFRI Monthly Indices (HFRI) are equally weighted performance indexes, compiled by Hedge Fund Research Inc. (HFX), and are used by numerous hedge fund managers as a benchmark for their own hedge funds. The HFRI are broken down into 37 different categories by strategy, including the HFRI Fund Weighted Composite, which accounts for over 2,000 funds listed on the internal HFR Database. The HFRI Fund of Funds Composite Index is an equal weighted, net of fee, index composed of approximately 800 fund- of- funds which report to HFR. See www.hedgefundresearch.com for more information on index construction.
J.P. Morgan’s Global Index Research group produces proprietary index products that track emerging markets, government debt, and corporate debt asset classes. Some of these indices include the JPMorgan Emerging Market Bond Plus Index, JPMorgan Emerging Market Local Plus Index, JPMorgan Global Bond Non-U.S. Index and JPMorgan Global Bond Non-U.S. Index. See www.jpmorgan.com for more information.
Merrill Lynch high yield indices measure the performance of securities that pay interest in cash and have a credit rating of below investment grade. Merrill Lynch uses a composite of Fitch Ratings, Moody’s and Standard and Poor’s credit ratings in selecting bonds for these indices. These ratings measure the risk that the bond issuer will fail to pay interest or to repay principal in full. See www.ml.com for more information.
Morgan Stanley Capital International – MSCI is a series of indices constructed by Morgan Stanley to help institutional investors benchmark their returns. There are a wide range of indices created by Morgan Stanley covering a multitude of developed and emerging economies and economic sectors. See www.morganstanley.com for more information.
The FTSE Nareit All Equity REITs Index is a free-float adjusted, market capitalization-weighted index of U.S. equity REITs.
Russell Investments rank U.S. common stocks from largest to smallest market capitalization at each annual reconstitution period (May 31). The primary Russell Indices are defined as follows: 1) the top 3,000 stocks become the Russell 3000 Index, 2) the largest 1,000 stocks become the Russell 1000 Index, 3) the smallest 800 stocks in the Russell 1000 Index become the Russell Midcap index, 4) the next 2,000 stocks become the Russell 2000 Index, 5) the smallest 1,000 in the Russell 2000 Index plus the next smallest 1,000 comprise the Russell Microcap Index, and 6) U.S. Equity REITs comprise the FTSE Nareit All Equity REIT Index. See www.russell.com for more information.
S&P 500 Index consists of 500 stocks chosen for market size, liquidity and industry group representation, among other factors by the S&P Index Committee, which is a team of analysts and economists at Standard and Poor’s. The S&P 500 is a market-value weighted index, which means each stock’s weight in the index is proportionate to its market value and is designed to be a leading indicator of U.S. equities, and meant to reflect the risk/return characteristics of the large cap universe. See www.standardandpoors.com for more information.
Information on any indices mentioned can be obtained either through your advisor or by written request to information@feg.com.
DISCLOSURES
This report was prepared by FEG (also known as Fund Evaluation Group, LLC), a federally registered investment adviser under the Investment Advisers Act of 1940, as amended, providing non-discretionary and discretionary investment advice to its clients on an individual basis. Registration as an investment adviser does not imply a certain level of skill or training. The oral and written communications of an adviser provide you with information about which you determine to hire or retain an adviser. Fund Evaluation Group, LLC, Form ADV Part 2A & 2B can be obtained by written request directly to: Fund Evaluation Group, LLC, 201 East Fifth Street, Suite 1600, Cincinnati, OH 45202, Attention: Compliance Department.
The information herein was obtained from various sources. FEG does not guarantee the accuracy or completeness of such information provided by third parties. The information in this report is given as of the date indicated and believed to be reliable. FEG assumes no obligation to update this information, or to advise on further developments relating to it. FEG, its affiliates, directors, officers, employees, employee benefit programs and client accounts may have a long position in any securities of issuers discussed in this report.
Index performance results do not represent any managed portfolio returns. An investor cannot invest directly in a presented index, as an investment vehicle replicating an index would be required. An index does not charge management fees or brokerage expenses, and no such fees or expenses were deducted from the performance shown.
Bloomberg Index Services Limited. BLOOMBERG® is a trademark and service mark of Bloomberg Finance L.P. and its affiliates (collectively “Bloomberg”). Bloomberg or Bloomberg’s licensors own all proprietary rights in the Bloomberg Indices. Bloomberg does not approve or endorse this material or guarantee the accuracy or completeness of any information herein, nor does Bloomberg make any warranty, express or implied, as to the results to be obtained therefrom, and, to the maximum extent allowed by law, Bloomberg shall not have any liability or responsibility for injury or damages arising in connection therewith.
Neither the information nor any opinion expressed in this report constitutes an offer, or an invitation to make an offer, to buy or sell any securities.
Any return expectations provided are not intended as, and must not be regarded as, a representation, warranty or predication that the investment will achieve any particular rate of return over any particular time period or that investors will not incur losses.
Past performance is not indicative of future results.
Investments in private funds are speculative, involve a high degree of risk, and are designed for sophisticated investors.
All data is as of January 31, 2024 unless otherwise noted.