


-01.webp?width=400)


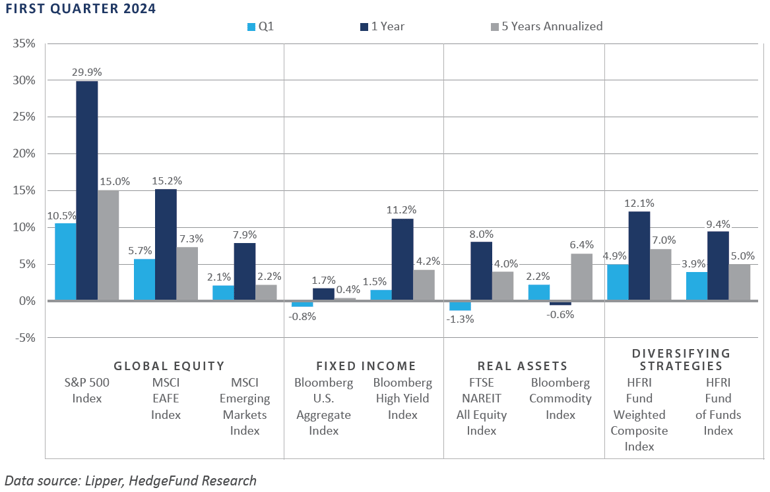
Risk takers, particularly those with a domestic orientation, were handsomely rewarded in the first quarter of 2024 as U.S. large cap stocks—i.e., S&P 500 Index—advanced to a record high and credit risk premiums tightened to near record lows. These gains humbled stock market bears who raised alarm bells in recent months due to historically elevated valuations, stubbornly elevated inflation, an unsustainable U.S. fiscal trajectory, and an unsettling geopolitical stage.
For the quarter, the majority of large cap’s gains came from the growth stocks, while small and microcap companies continued to lag, albeit still posting solid returns. International equities lagged domestic, as regional conflicts in Eastern Europe and the Middle East, paired with lackluster economic performance across Europe and China, helped weigh on investor sentiment. Performance in the bond market was mixed, with rate-sensitive sectors like investment-grade credit and Treasuries witnessing declines, while shorter duration, below-investment-grade credit sectors such as high yield and bank loans eked out low single-digit returns. Real asset performance was also mixed, as real estate investment trusts (REITs) declined modestly amid the backup in interest rates, while commodity futures and global listed infrastructure generated positive total returns.
Economic Update
U.S. Stocks Advance to Record Highs Despite Cooling Fed Rate Cut Sentiment
At their March policy meeting the Federal Reserve (Fed) affirmed their expectation for three 25 basis point rate cuts in 2024—an expectation first introduced at the December 2023 policy meeting—via updates to the Fed’s Summary of Economic Projections “dot plot” table. While on the surface the Fed’s unchanged view of the appropriate year-end level of the policy rate was unsurprising, it was notable that that there was no material deviation in the Fed’s desire to ease policy. This is despite U.S. equity prices and certain valuations having approached the upper-end of their historical range, inflation running well above its 2% target, gold and bitcoin spot prices having seen new record highs, and the labor market and broader economy continuing to demonstrate strength.
In recent quarters, the general trend of the equity market has ebbed and flowed in response to the implied path of Fed policy, with increasing expectations for Fed rate cuts serving as a tailwind behind risk assets and vice versa. This relationship seems to have decoupled, however, as incoming inflationary data indicated that the Fed’s multi-year campaign to restore price stability is unfinished, driving Fed easing sentiment lower.
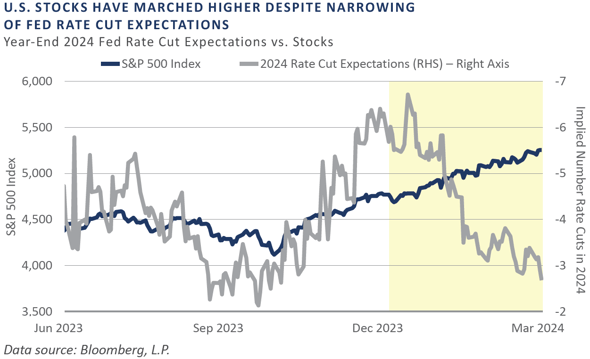
Early in the quarter, the fed funds futures market had discounted nearly seven 25 basis point cuts to occur throughout 2024. By quarter-end, however, this had narrowed to reflect just three 25 basis point cuts, in line with the Fed’s expectations. Despite this convergence, U.S. large cap stocks (S&P 500) advanced to fresh record highs, humbling skeptics who called for a pullback.
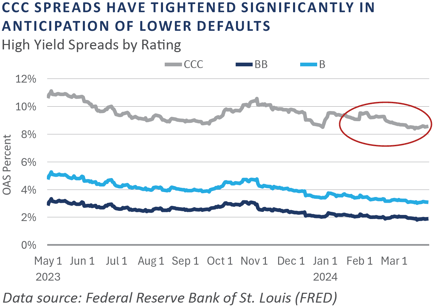
The strong bid for domestic risk exposure was not confined to the equity markets, as credit risk premiums narrowed to the lowest levels since early 2022, a time when the Fed was initiating the monetary tightening process. On a spread basis, U.S. high yield bond risk premiums tightened to a sub-300 basis point (bp) level during the quarter, placing this key financial condition variable in the fourth percentile of observations dating back to the late 1980s.
Often viewed as a leading cyclical indicator of the business cycle, the current subdued level of risk compensation demanded by high yield investors reflects supportive credit conditions, meaningful investor demand for credit risk, a lack of concern for a near-term economic downturn, and a backdrop seemingly priced for perfection.
To conclude, most major risky asset categories advanced in the first quarter, with notable positive momentum observed in domestic markets as U.S. large cap equities gained double digits on their way to a new record high. This strength contrasted with inflationary data suggesting the Fed’s campaign to fully restore price stability is incomplete, which in turn helped drive a notable shift lower in the bond market’s expectation for easing throughout the remainder of 2024.
Market Summary
Global Equity
Equity markets continued the momentum of early 2024 in March providing the S&P 500 Index experiencing its best first quarter since 2019. U.S. markets outperformed both developed and emerging markets. Enthusiasm around artificial intelligence (AI) was especially pivotal in driving market returns across the globe.
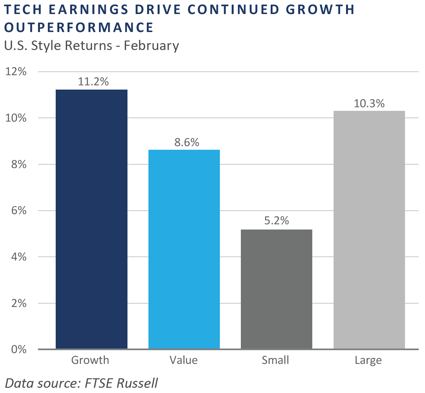
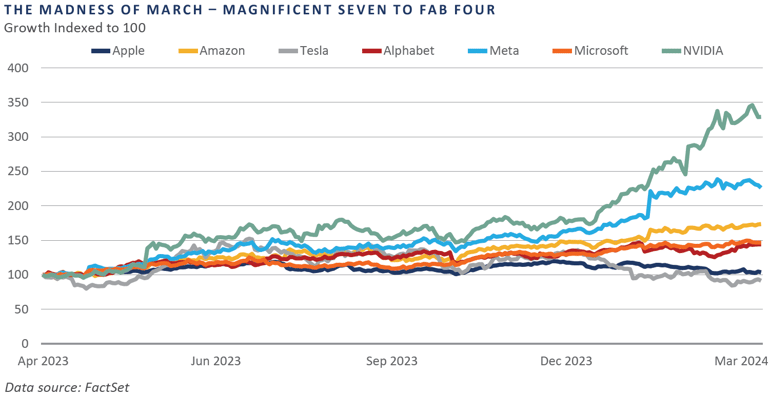
The quarter experienced three consecutive months of positive performance for U.S. equities, driven primarily by what is now referred to as the “Fab Four”: NVIDIA, Microsoft, Meta, and Amazon. These four have outpaced their Magnificent 7 counterparts—Tesla, Apple, and Alphabet—thus far in 2024 and were consequently labeled as a unique group. Strong earnings releases from the information technology and communication services sectors drove returns. The energy sector also performed well due to increased oil prices.
European equities ex-UK produced positive absolute returns, outperforming emerging markets but underperforming U.S. equities. Similar to other equity markets around the world, the information technology sector led returns due to AI demand. In addition, the Purchasing Managers’ Index (PMI) increased in March from 49.2 to 49.9, signaling improvement in euro zone business activity.
UK-based equities rebounded in March after remaining relatively flat in February. The financials, industrials, and energy sectors outperformed. Inflation has decreased faster than expected, helping to boost equity market sentiment. Even with the recent positive performance, UK equities are still trading at around a 30% median industry discount when comparing the UK forward price/earnings ratio to the U.S.
Japanese stocks continued to rally, with the Nikkei 225 Index topping 40,000 yen for the first time in history. Large cap automotive and semiconductor stocks led for the quarter. The weakening yen provided a short-term tailwind for recent corporate earnings announcements, given that many large cap companies in Japan are net exporters. The Bank of Japan (BOJ) hiked rates for the first time since 2007, ending the period of negative interest rates that followed the financial crisis.
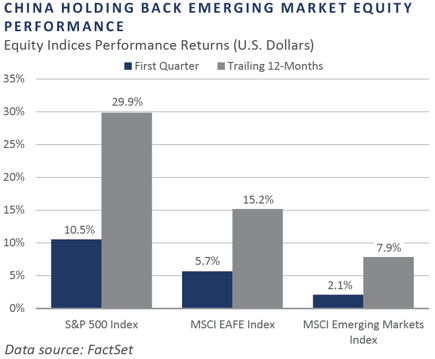
Although emerging markets (EM) produced positive returns, EM equities still lagged U.S. and international equities. In Taiwan and Korea, enthusiasm for artificial intelligence drove market returns. China’s equity markets rebounded in February and produced positive absolute returns in March, although the market still finished down over the first quarter. China has been gaining economic momentum on the back of significant expansions in factory activity.
Fixed Income
Rates sold off in the first quarter, largely in February, returning gains from an impressive fourth-quarter rally. The 10-year Treasury yield rose 0.32% to 4.20%, while the 2-year Treasury yield rose 0.37% to 4.59%.
Expectations of interest rate cuts by the market fell from nearly seven late in the fourth quarter to around three by the end of the first quarter, in line with the Federal Open Market Committee’s (FOMC's) dot plot and economic projections.
Inflation expectations reset during the first quarter following elevated CPI and PCE data, particularly in February following the hot January CPI reading. Additionally, strong economic and jobs data have reinforced the view that continued restrictive rates are needed to bring back price stability. Chair Powell has maintained that the Fed will need adequate evidence of cooling inflation before cutting rates.
Corporate spreads continued to tighten during the quarter. Investment-grade spreads fell 0.10% to 0.94%, while high yield spreads fell 0.24% to 3.15%. While tight spreads indicate limited upside for price appreciation, the high carry of these bonds, especially in the high yield space, can help insulate investors from losses even if spreads widen significantly.
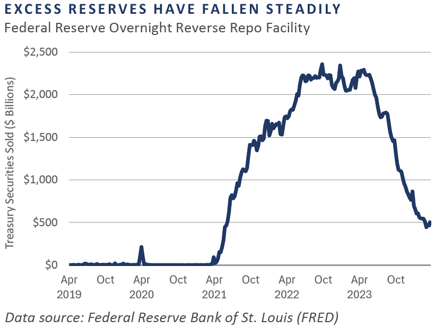
The Fed’s overnight reverse repo facility, commonly referred to as the RRP, has been steadily falling since May of 2023. The RRP is seen as a gauge of “excess” reserves in the system, and as it approaches zero—likely sometime in the middle of this year—the pace and timing of quantitative tightening (QT) will be reconsidered to ensure there is enough liquidity in the system. In September 2019, reserves fell to a level that left a liquidity gap in the financial system, causing repo rates to spike and prompting the Fed to halt QT and inject new liquidity.
Real Assets
REAL ESTATE
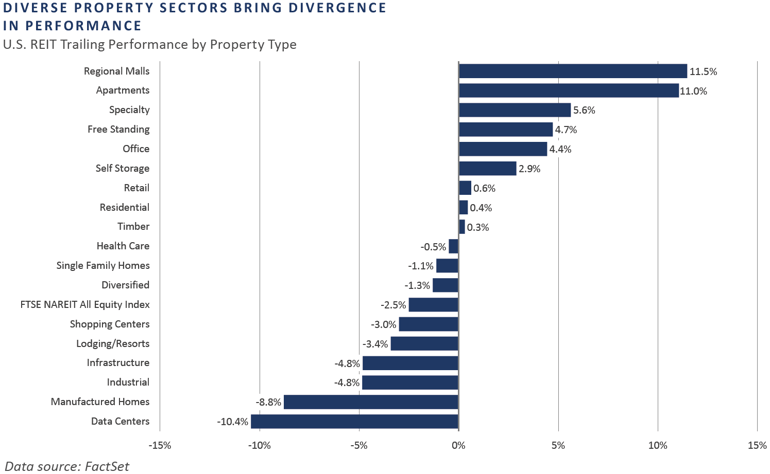
U.S. and global Real Estate Investment Trust (REIT) indexes modestly declined during the first quarter of 2024 following Fed Chairman Jerome Powell's announcement that the Fed may not cut rates to the extent the market had already priced in for 2024. Higher interest rates have been the most significant headwind for listed real estate due to increased borrowing costs and declining property valuations because of higher applied discount rates.
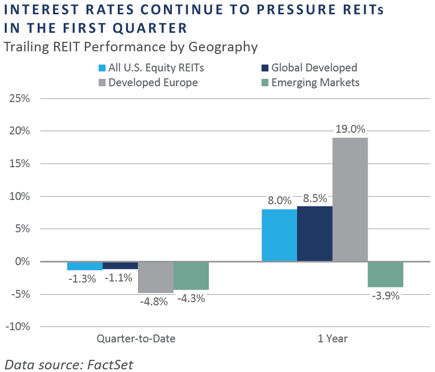
U.S. REITs outperformed their European brethren, although the Europe real estate sector faced similar challenges due to higher interest rates, declining property values, and subdued economic activity. Overall, the U.S. economy has been comparatively resilient for the first quarter, providing some cushion for the impact of higher rates.
NATURAL RESOURCES
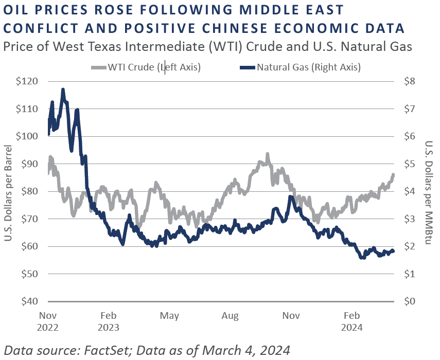
Oil prices, as measured by West Texas Intermediate (WTI), rose over 15% in the first quarter. Geopolitical tensions in the Middle East continued to put upward pressure on oil prices, based on fears of potential adverse supply impact in the region, as Israeli strikes were carried out on an Iranian consulate in Syria. Furthermore, March Purchasing Managers’ Index (PMI) data from China indicated a positive shift in the country’s manufacturing activity. China’s PMI is viewed as a significant economic indicator that can influence oil prices, with an increase in the PMI associated with higher demand for oil, which also contributes to higher prices.
INFRASTRUCTURE
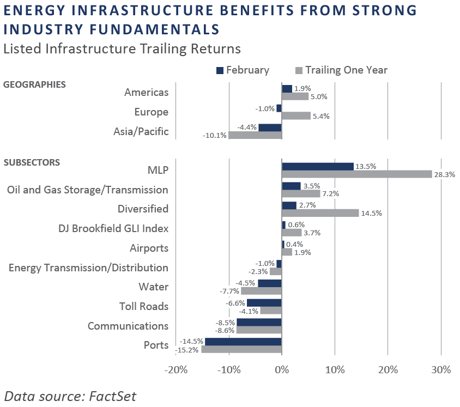
The global diversified infrastructure index was flat during the first quarter, weighed down by the port, communications infrastructure, toll road, and water sectors.
Midstream energy infrastructure remains a standout performer, up more than 13% during the first quarter, as measured by the DJ Brookfield Global Infrastructure MLP Index. Many midstream companies have reduced debt, increased returns to investors, and maintained disciplined capital expenditures, resulting in strong earnings and distributions, with expectations for continued growth in free cash flows.
Diversifying Strategies
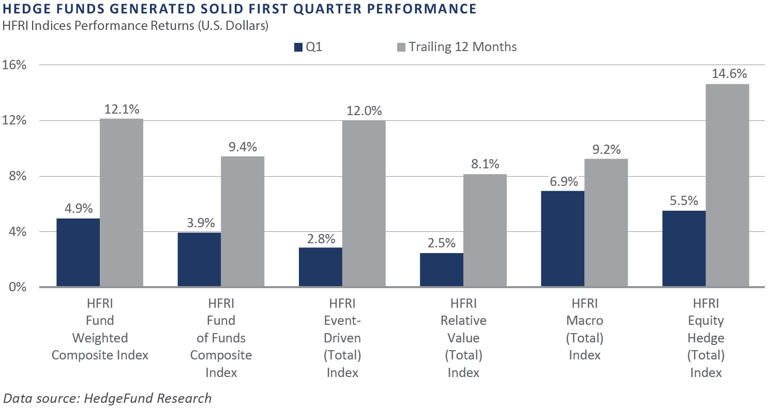
Hedge funds generated solid gains for the quarter, led by global macro and hedged equity strategies. Global macro strategies were particularly strong, witnessing the best quarterly return in over 20 years.
Performance dispersion declined during the quarter across the broad hedge fund industry. The hedge fund benchmark representing hedge funds generally built upon a strong run over the last five months. The elevated interest rate environment relative to recent historical averages has positively impacted most hedge fund strategies.
Trend followers, energy, and cryptocurrency exposures drove robust gains in macro-oriented strategies. The best performers within trend following were allocations to equities and agricultural commodities.
INDICES
The Alerian MLP Index is a composite of the 50 most prominent energy Master Limited Partnerships that provides investors with an unbiased, comprehensive benchmark for this emerging asset class.
Bloomberg Fixed Income Indices is an index family comprised of the Bloomberg US Aggregate Index, Government/Corporate Bond Index, Mortgage-Backed Securities Index, and Asset-Backed Securities Index, Municipal Index, High-Yield Index, Commodity Index and others designed to represent the broad fixed income markets and sectors. On August 24, 2016, Bloomberg acquired these long-standing assets from Barclays Bank PLC. and on August 24, 2021, they were rebranded as the Bloomberg Fixed Income Indices. See https://www.bloomberg.com/markets/rates-bonds/bloomberg-fixed-income-indices for more information.
The CBOE Volatility Index (VIX) is an up-to-the-minute market estimate of expected volatility that is calculated by using real-time S&P 500 Index option bid/ask quotes. The Index uses nearby and second nearby options with at least eight days left to expiration and then weights them to yield a constant, 30-day measure of the expected volatility of the S&P 500 Index.
FTSE Real Estate Indices (NAREIT Index and EPRA/NAREIT Index) includes only those companies that meet minimum size, liquidity and free float criteria as set forth by FTSE and is meant as a broad representation of publicly traded real estate securities. Relevant real estate activities are defined as the ownership, disposure, and development of income-producing real estate. See https://www.ftserussell.com/index/category/real-estate for more information.
HFRI Monthly Indices (HFRI) are equally weighted performance indexes, compiled by Hedge Fund Research Inc. (HFX), and are used by numerous hedge fund managers as a benchmark for their own hedge funds. The HFRI are broken down into 37 different categories by strategy, including the HFRI Fund Weighted Composite, which accounts for over 2,000 funds listed on the internal HFR Database. The HFRI Fund of Funds Composite Index is an equal weighted, net of fee, index composed of approximately 800 fund- of- funds which report to HFR. See www.hedgefundresearch.com for more information on index construction.
J.P. Morgan’s Global Index Research group produces proprietary index products that track emerging markets, government debt, and corporate debt asset classes. Some of these indices include the JPMorgan Emerging Market Bond Plus Index, JPMorgan Emerging Market Local Plus Index, JPMorgan Global Bond Non-U.S. Index and JPMorgan Global Bond Non-U.S. Index. See www.jpmorgan.com for more information.
Merrill Lynch high yield indices measure the performance of securities that pay interest in cash and have a credit rating of below investment grade. Merrill Lynch uses a composite of Fitch Ratings, Moody’s and Standard and Poor’s credit ratings in selecting bonds for these indices. These ratings measure the risk that the bond issuer will fail to pay interest or to repay principal in full. See www.ml.com for more information.
Morgan Stanley Capital International – MSCI is a series of indices constructed by Morgan Stanley to help institutional investors benchmark their returns. There are a wide range of indices created by Morgan Stanley covering a multitude of developed and emerging economies and economic sectors. See www.morganstanley.com for more information.
The FTSE Nareit All Equity REITs Index is a free-float adjusted, market capitalization-weighted index of U.S. equity REITs.
Russell Investments rank U.S. common stocks from largest to smallest market capitalization at each annual reconstitution period (May 31). The primary Russell Indices are defined as follows: 1) the top 3,000 stocks become the Russell 3000 Index, 2) the largest 1,000 stocks become the Russell 1000 Index, 3) the smallest 800 stocks in the Russell 1000 Index become the Russell Midcap index, 4) the next 2,000 stocks become the Russell 2000 Index, 5) the smallest 1,000 in the Russell 2000 Index plus the next smallest 1,000 comprise the Russell Microcap Index, and 6) U.S. Equity REITs comprise the FTSE Nareit All Equity REIT Index. See www.russell.com for more information.
S&P 500 Index consists of 500 stocks chosen for market size, liquidity and industry group representation, among other factors by the S&P Index Committee, which is a team of analysts and economists at Standard and Poor’s. The S&P 500 is a market-value weighted index, which means each stock’s weight in the index is proportionate to its market value and is designed to be a leading indicator of U.S. equities, and meant to reflect the risk/return characteristics of the large cap universe. See www.standardandpoors.com for more information.
Information on any indices mentioned can be obtained either through your advisor or by written request to information@feg.com.
DISCLOSURES
This report was prepared by FEG (also known as Fund Evaluation Group, LLC), a federally registered investment adviser under the Investment Advisers Act of 1940, as amended, providing non-discretionary and discretionary investment advice to its clients on an individual basis. Registration as an investment adviser does not imply a certain level of skill or training. The oral and written communications of an adviser provide you with information about which you determine to hire or retain an adviser. Fund Evaluation Group, LLC, Form ADV Part 2A & 2B can be obtained by written request directly to: Fund Evaluation Group, LLC, 201 East Fifth Street, Suite 1600, Cincinnati, OH 45202, Attention: Compliance Department.
The information herein was obtained from various sources. FEG does not guarantee the accuracy or completeness of such information provided by third parties. The information in this report is given as of the date indicated and believed to be reliable. FEG assumes no obligation to update this information, or to advise on further developments relating to it. FEG, its affiliates, directors, officers, employees, employee benefit programs and client accounts may have a long position in any securities of issuers discussed in this report.
Index performance results do not represent any managed portfolio returns. An investor cannot invest directly in a presented index, as an investment vehicle replicating an index would be required. An index does not charge management fees or brokerage expenses, and no such fees or expenses were deducted from the performance shown.
Bloomberg Index Services Limited. BLOOMBERG® is a trademark and service mark of Bloomberg Finance L.P. and its affiliates (collectively “Bloomberg”). Bloomberg or Bloomberg’s licensors own all proprietary rights in the Bloomberg Indices. Bloomberg does not approve or endorse this material or guarantee the accuracy or completeness of any information herein, nor does Bloomberg make any warranty, express or implied, as to the results to be obtained therefrom, and, to the maximum extent allowed by law, Bloomberg shall not have any liability or responsibility for injury or damages arising in connection therewith.
Neither the information nor any opinion expressed in this report constitutes an offer, or an invitation to make an offer, to buy or sell any securities.
Any return expectations provided are not intended as, and must not be regarded as, a representation, warranty or predication that the investment will achieve any particular rate of return over any particular time period or that investors will not incur losses.
Past performance is not indicative of future results.
Investments in private funds are speculative, involve a high degree of risk, and are designed for sophisticated investors.
All data is as of March 29, 2024 unless otherwise noted.