The first quarter of 2023 handed global investors much to digest. The year started with the erratic market performance of January and February, with the former witnessing broadly positive performance across most major asset classes and the latter generally the opposite. Then March’s banking system turmoil took center stage. By the time the quarter concluded, however, substantial gains had been generated for the breadth of the major global financial indices, despite lingering banking system concerns and a Federal Reserve (Fed) that reaffirmed its commitment to restoring price stability through a 25-basis point hike to the policy rate and hawkish near- term forward guidance. Across the equity markets, large cap companies, particularly growth-oriented, generated the most substantial total returns, while smaller cap and value-oriented companies struggled. Bond returns were overwhelmingly positive across both rate and credit-sensitive sectors, as interest rates declined sharply and credit risk premiums narrowed. Performance across real assets for the quarter appeared dispersed yet generally positive for the major asset categories excluding broad commodity indices, which faced headwinds of strong downward momentum across crude oil and natural gas spot prices.
Economic Update
Banking System Stress Comes into Focus as Depositors Assess Safety of their Liquidity
Through the first two months of the year, financial market performance appeared somewhat balanced, with February’s broad-based weakness serving as a counterbalance to January’s strong showing. The events that unfolded across the U.S. banking system throughout March, however, dominated financial media headlines and conversation circles, as the failures of Silicon Valley Bank (SVB) and Signature Bank rekindled fears of contagion within the U.S. banking industry and broader financial markets. Across the pond, Credit Suisse’s longer-term operating struggles ended abruptly on March 19, with Swiss authorities forcing a merger with rival UBS.
As is often the case when the Fed seeks to tighten the monetary reigns, the most aggressive and over-levered players that were previously able to remain a going concern amid accommodative conditions remained exposed to higher interest rates. In the current Fed tightening campaign, SVB and Signature Bank appeared to be the first dominoes to fall, with others such as First Republic Bank and a number of regional banking institutions suffering through challenging operating conditions during the month.
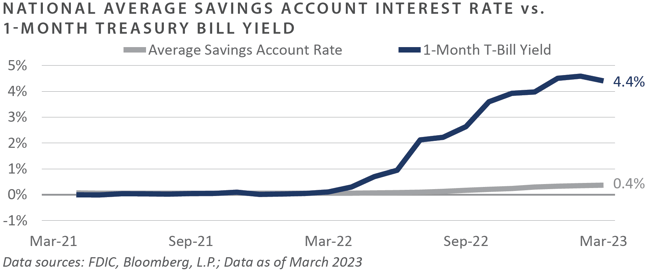
Central to the growing unease across the banking industry was an increasing divergence between interest rates offered by banks to depositors versus yields available on ultra-short-term Treasury securities. Through March, for example, the national average rate on savings accounts stood at just 0.37%. In contrast, the yield on 1-month Treasury Bills was more than 400 basis points higher, with no associated credit or counterparty risk.
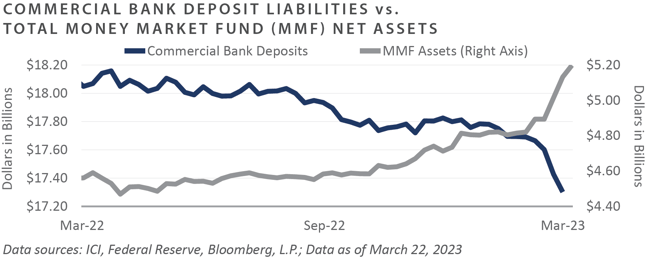
In a world dominated by banking access at one’s fingertips and an abundance of real-time financial media news flow, fundamental concerns about the soundness of an individual’s or institution’s liquidity increase the risk of a digital “run on the bank,” in which depositors flock to larger and presumably more financially sound banking institutions to safeguard their deposits. In the first quarter, U.S. commercial bank deposit liabilities declined nearly $500 billion, whereas total money market net assets increased $463 billion, according to Investment Company Institute data.
In the months ahead, investors are likely to tread through continued unsettling market conditions, with persistent inflationary and recessionary pressures coalescing with a hawkish Fed and the potential for further banking system strains. Prospects for additional monetary restraint in the face of inflation running uncomfortably above the Fed’s 2% target may result in further downside risks to the near and intermediate-term outlook, placing downward pressure on global risk premia and rewarding patient investors with an increasingly compelling investment opportunity set.
To conclude, while the first two months of 2023 offered investors a mixed performance picture across the major corners of financial markets, the failure of two major U.S. banking institutions and the forced merger between banking giants Credit Suisse and UBS demanded market participants’ attention in March.
Market Summary
Global Equity
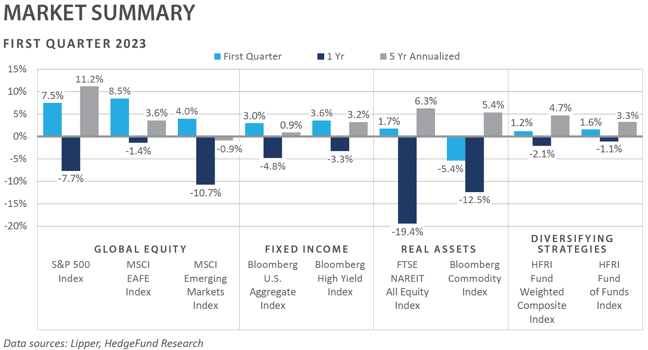
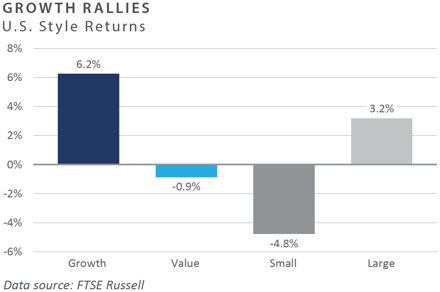
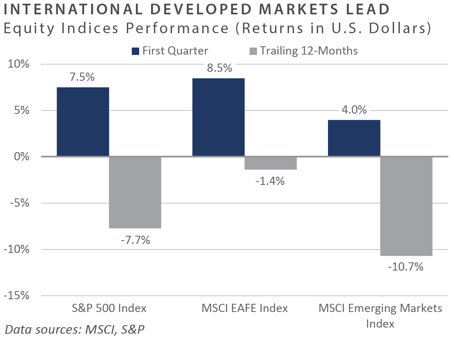
- Global stock markets finished the first quarter with positive returns. Growth equity outperformed value equity, and large cap stocks outperformed small cap stocks.
- S&P 500 earnings-per-share estimates declined at a larger-than-average rate for the first quarter, decreasing by 6.6%. This marked the most significant earnings decline reported since the second quarter of 2020 (-31.8%). Full-year 2023 estimates were also revised lower, decreasing 3.8%.
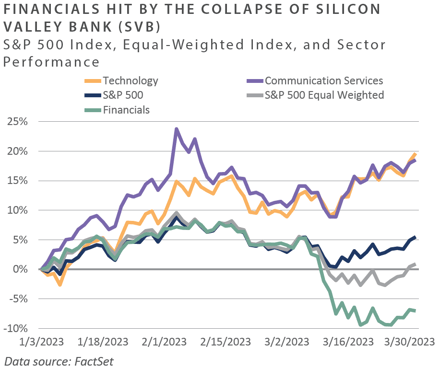
- The information technology and communication services sectors were the best-performing, as growth companies benefitted from declining interest rates. Financials finished the quarter as the worst-performing sector, down 5.6%, as the collapse of Silicon Valley Bank created concerns about possible systemic risk within the regional banking industry.
- European equities finished the quarter with solid returns led by the information technology, consumer discretionary, and communication services sectors. Despite a volatile March, financials finished the quarter with positive returns as Credit Suisse’s issues were considered company-specific.
- In the United Kingdom (UK), equity returns were mixed by sector. The most recent quarterly gross domestic product (GDP) data from the Office of National Statistics showed that the UK economy did not contract in the fourth quarter of 2022, beating consensus expectations, which benefited cyclical sectors.
- Japanese equities produced positive returns. In February, the Tokyo Stock Exchange requested companies trading below book value to develop capital improvement plans. About 33% of Topix 100 members have price-to-book ratios below one, compared to only 3% of constituents within the S&P 500.
- Emerging markets equities posted positive results despite volatility over the quarter. To start the year, China re-opening provided a positive backdrop for emerging markets which reversed with U.S.-China tensions escalating in February and March. Continued optimism around easing regulatory pressure served as a tailwind for the information technology and communication services sectors, supporting returns in both sectors.
- Brazil’s performance weighed on the Latin American region as anti-government riots in January hurt sentiment coupled with softening economic data coming out of Brazil. India, which makes up 13% of the MSCI Emerging Markets Index, finished the quarter down 3%. The underperformance was mainly due to allegations of fraud and share price manipulation by one of India’s biggest conglomerates, Adani Group.
Fixed Income
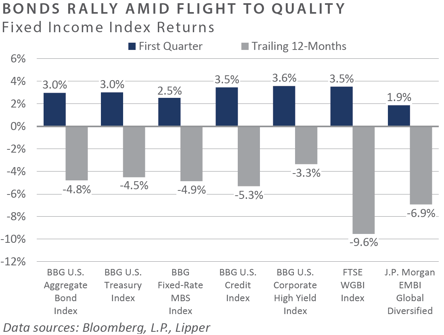
- Investors were greeted to the new year with declining rates before hawkish Fed commentary dragged rates higher. The 10- year and 2-year Treasury yields reached an intra-quarter high of 4.08% and 5.05% respectively, pushing the yield curve further into inverted territory. However, these moves were swiftly reversed with the collapse of several large banks. While rates rallied across the curve, the moves were most acute at the front end as the 2-year Treasury yield rallied 124 bps over five trading days. The flight to quality was spurred by investor risk aversion and the exodus of bank deposits into higher-yielding Treasury and money markets.
- Economic surprise indices flipped into positive territory during the first quarter as strong labor, inflation, and housing reports surprised the upside as the Citigroup Economic Surprise Index ended the quarter at the highest since Spring 2022. Fed Chair Powell testified to Congress that the data- dependent Federal Open Market Committee (FOMC) might reaccelerate the pace of rate increases in response to the resilient economy, pushing Fed Fund Futures priced in a peak rate above 5.5%.
- Expectations of the path of interest rates were quickly lowered following the developments in the banking sector as market-based expectations pointed to multiple cuts by year-end. This was in stark contrast to the Fed’s Dot Plot released after the collapse of several large banks. The Dot Plot remained unchanged for the FOMC’s 2023 outlook, with a terminal rate of 5.1%. After falling in line with Chair Powell’s outlook in early March, the market is again at odds with the Fed regarding their interest rate outlooks.
- Investment grade (IG) and high yield (HY) credit experienced a solid start to the new year before showing signs of weakness in February and March. During the quarter, IG spreads widened seven basis points (bps) to 1.45%, while HY spreads compressed by 23 bps to 4.58% after reaching a peak of 5.22%.
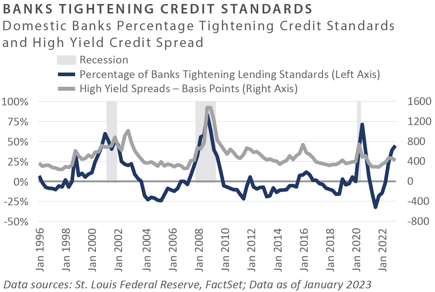
- It is anticipated that regulated financial institutions, such as banks, will begin to tighten credit standards as credit officers reduce risk in response to strains in the banking sector. While the implications are yet to be realized, tighter lending conditions increase borrowing costs, which are expected to increase investment bank sensitivity to hung deals and may push more lending activity to the non-regulated private credit markets. These developments may take months to manifest and will be closely followed by credit investors to determine their true impact on the real economy and borrower fundamentals.
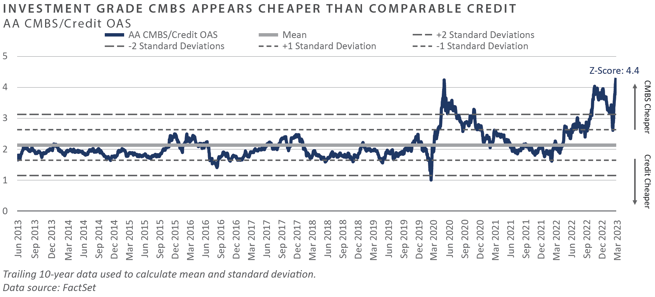
- 2022's rapid increase in interest rates most acutely impacted the residential mortgage-backed securities (RMBS) universe as securities repriced to the new rate environment. During the first quarter of 2023, attention has quickly shifted to commercial mortgage-backed securities (CMBS). The Bloomberg U.S. CMBS 2.0 Index rose 1.03% during the quarter, underperforming RMBS and the Bloomberg S. Aggregate Index by -1.55% and -1.93%, respectively.
- Down the capital structure, BBB-rated CMBS have seen spreads widen by roughly 200 bps to 6.79%, and their dollar price decrease to $72.62. The option-adjusted spread on AA-rated CMBS relative to AA-rated corporate credit has moved to levels only witnessed during the Great Financial Crisis and the Covid-induced selloff in 2020, as CMBS markets price in a much more draconian picture than credit markets.
Real Assets
REAL ESTATE
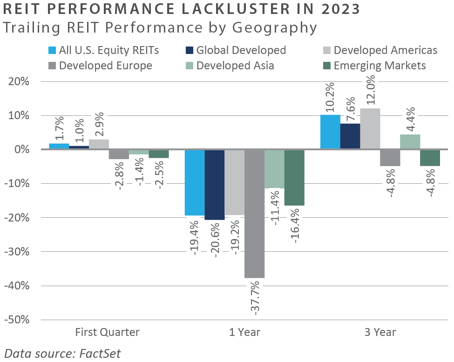
- Global real estate returns were lackluster in the first quarter of 2023. In early March, the markets had widespread concerns that regional and mid-sized banks would fail in part due to their exposure to commercial real estate. The FTSE NAREIT All Equity REITs index fell almost 9% from the beginning of the month until March 23 before recovering substantially by the end of the month.
- The FTSE EPRA/NAREIT Developed Europe index fell more than 10% during the same period but was unable to recover. The forced sale of Credit Suisse, paired with rating agency Moody stating that refinancing risk in the European real estate sector had “significantly increased,” had a substantial impact in Europe relative to other regions.
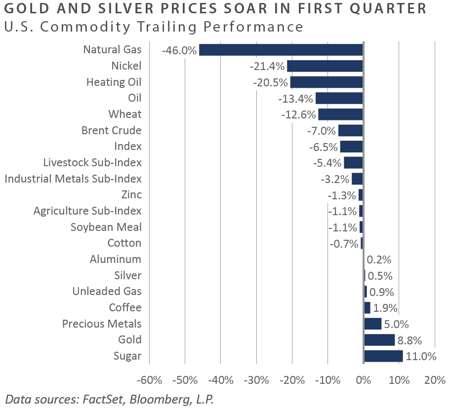
NATURAL RESOURCES
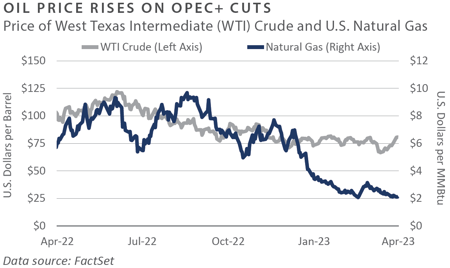
- On Sunday April 2, OPEC+ unexpectedly announced additional production cuts of more than one million barrels per day (MMbpd). The cut brings the total volume of cuts by OPEC+ to 3.66 MMbpd, or 3.7% of global demand, according to Reuters. West Texas Intermediate Crude Oil (WTI) prices jumped 5%+ Monday following the announcement, pushing oil prices back above $80/barrel.
- The U.S. Department of Energy (DOE) stated it could start re-stocking the Strategic Petroleum Reserve (SPR) when oil prices were in the target range of $67-72/barrel, but no sales were announced after WTI prices were in range in March. The DOE is conducting a 26-million-barrel SPR sale mandated by Congress, and two of the four SPR sites in Texas and Louisiana were down for maintenance for life extension work, delaying buybacks.
- Throughout the end of the quarter, banking uncertainty, a weakening dollar, and continued inflation concerns helped boost prices for silver and gold. Additionally, mergers and acquisitions (M&A) activity in the metals and mining space increased, with Swiss-based Glencore PLC proposing a ~$23 billion offer for Canadian-based Teck Resources (Teck). The offer was rejected.
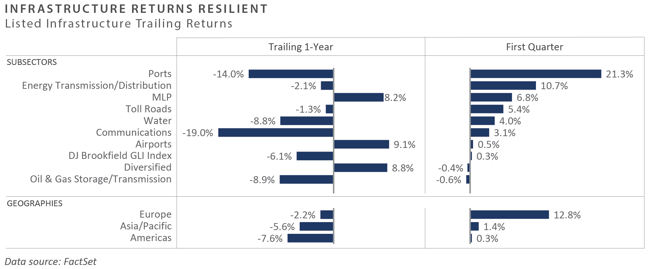
INFRASTRUCTURE
- Global listed infrastructure sectors posted disparate performance in the first quarter. Adani Ports, one of the largest port operators globally, announced it handled 32 million metric tons of cargo, implying a year-over-year growth of 9.5%, yet port performance was relatively weak. Airports continued to outperform, as some airports have announced increased travel. The Italian Bologna Guglielmo Marconi Airport recorded a 21% increase in passengers in March 2023 compared to March 2021, but still 7.5% lower than pre-pandemic.
Diversifying Strategies
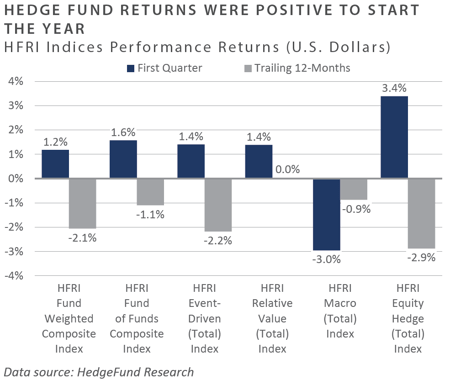
- Over the quarter, hedge funds provided positive returns, with the HFRI Fund Weighted Composite Index up 1.2%. The only strategy in negative territory was global macro, which continued its string of poor performance.
- Hedged equity was the best-performing strategy, up 3.4% over the quarter. Fundamental value and fundamental growth performance led all other indices. Quantitative directional notably had a positive first quarter, even after a particularly poor performance in February. However, the Energy/Basic Materials Index reversed from last quarter’s positive performance down almost 2%.
- Trend-following managers’ performance varied throughout the quarter. The divergence in performance was primarily driven by market volatility, specifically in equity markets. The equity exposure of systematic investors last month surpassed discretionary funds for the first time in almost 18 months.
- Due to interest rate uncertainty, multi- strategy funds operated at lower gross leverage multiples. Multi-strategies maintained large cash balances, intending to capitalize on an increase in deal flow or distressed opportunities. Opportunistic strategies shifted allocations towards relative value trades due to reduced merger and acquisition activity, particularly among large cap companies.
INDICES
The Alerian MLP Index is a composite of the 50 most prominent energy Master Limited Partnerships that provides investors with an unbiased, comprehensive benchmark for this emerging asset class.
Bloomberg Fixed Income Indices is an index family comprised of the Bloomberg US Aggregate Index, Government/Corporate Bond Index, Mortgage-Backed Securities Index, and Asset-Backed Securities Index, Municipal Index, High-Yield Index, Commodity Index and others designed to represent the broad fixed income markets and sectors. On August 24, 2016, Bloomberg acquired these long-standing assets from Barclays Bank PLC. and on August 24, 2021, they were rebranded as the Bloomberg Fixed Income Indices. See https://www.bloomberg.com/markets/rates-bonds/bloomberg-fixed-income-indices for more information.
The CBOE Volatility Index (VIX) is an up-to-the-minute market estimate of expected volatility that is calculated by using real-time S&P 500 Index option bid/ask quotes. The Index uses nearby and second nearby options with at least eight days left to expiration and then weights them to yield a constant, 30-day measure of the expected volatility of the S&P 500 Index.
FTSE Real Estate Indices (NAREIT Index and EPRA/NAREIT Index) includes only those companies that meet minimum size, liquidity and free float criteria as set forth by FTSE and is meant as a broad representation of publicly traded real estate securities. Relevant real estate activities are defined as the ownership, disposure, and development of income-producing real estate. See https://www.ftserussell.com/index/category/real-estate for more information.
HFRI Monthly Indices (HFRI) are equally weighted performance indexes, compiled by Hedge Fund Research Inc. (HFX), and are used by numerous hedge fund managers as a benchmark for their own hedge funds. The HFRI are broken down into 37 different categories by strategy, including the HFRI Fund Weighted Composite, which accounts for over 2,000 funds listed on the internal HFR Database. The HFRI Fund of Funds Composite Index is an equal weighted, net of fee, index composed of approximately 800 fund- of- funds which report to HFR. See www.hedgefundresearch.com for more information on index construction.
J.P. Morgan’s Global Index Research group produces proprietary index products that track emerging markets, government debt, and corporate debt asset classes. Some of these indices include the JPMorgan Emerging Market Bond Plus Index, JPMorgan Emerging Market Local Plus Index, JPMorgan Global Bond Non-U.S. Index and JPMorgan Global Bond Non-U.S. Index. See www.jpmorgan.com for more information.
Merrill Lynch high yield indices measure the performance of securities that pay interest in cash and have a credit rating of below investment grade. Merrill Lynch uses a composite of Fitch Ratings, Moody’s and Standard and Poor’s credit ratings in selecting bonds for these indices. These ratings measure the risk that the bond issuer will fail to pay interest or to repay principal in full. See www.ml.com for more information.
Morgan Stanley Capital International – MSCI is a series of indices constructed by Morgan Stanley to help institutional investors benchmark their returns. There are a wide range of indices created by Morgan Stanley covering a multitude of developed and emerging economies and economic sectors. See www.morganstanley.com for more information.
The FTSE Nareit All Equity REITs Index is a free-float adjusted, market capitalization-weighted index of U.S. equity REITs.
Russell Investments rank U.S. common stocks from largest to smallest market capitalization at each annual reconstitution period (May 31). The primary Russell Indices are defined as follows: 1) the top 3,000 stocks become the Russell 3000 Index, 2) the largest 1,000 stocks become the Russell 1000 Index, 3) the smallest 800 stocks in the Russell 1000 Index become the Russell Midcap index, 4) the next 2,000 stocks become the Russell 2000 Index, 5) the smallest 1,000 in the Russell 2000 Index plus the next smallest 1,000 comprise the Russell Microcap Index, and 6) U.S. Equity REITs comprise the FTSE Nareit All Equity REIT Index. See www.russell.com for more information.
S&P 500 Index consists of 500 stocks chosen for market size, liquidity and industry group representation, among other factors by the S&P Index Committee, which is a team of analysts and economists at Standard and Poor’s. The S&P 500 is a market-value weighted index, which means each stock’s weight in the index is proportionate to its market value and is designed to be a leading indicator of U.S. equities, and meant to reflect the risk/return characteristics of the large cap universe. See www.standardandpoors.com for more information.
Information on any indices mentioned can be obtained either through your advisor or by written request to information@feg.com.
DISCLOSURES
This report was prepared by FEG (also known as Fund Evaluation Group, LLC), a federally registered investment adviser under the Investment Advisers Act of 1940, as amended, providing non-discretionary and discretionary investment advice to its clients on an individual basis. Registration as an investment adviser does not imply a certain level of skill or training. The oral and written communications of an adviser provide you with information about which you determine to hire or retain an adviser. Fund Evaluation Group, LLC, Form ADV Part 2A & 2B can be obtained by written request directly to: Fund Evaluation Group, LLC, 201 East Fifth Street, Suite 1600, Cincinnati, OH 45202, Attention: Compliance Department.
The information herein was obtained from various sources. FEG does not guarantee the accuracy or completeness of such information provided by third parties. The information in this report is given as of the date indicated and believed to be reliable. FEG assumes no obligation to update this information, or to advise on further developments relating to it. FEG, its affiliates, directors, officers, employees, employee benefit programs and client accounts may have a long position in any securities of issuers discussed in this report.
Index performance results do not represent any managed portfolio returns. An investor cannot invest directly in a presented index, as an investment vehicle replicating an index would be required. An index does not charge management fees or brokerage expenses, and no such fees or expenses were deducted from the performance shown.
Bloomberg Index Services Limited. BLOOMBERG® is a trademark and service mark of Bloomberg Finance L.P. and its affiliates (collectively “Bloomberg”). Bloomberg or Bloomberg’s licensors own all proprietary rights in the Bloomberg Indices. Bloomberg does not approve or endorse this material or guarantee the accuracy or completeness of any information herein, nor does Bloomberg make any warranty, express or implied, as to the results to be obtained therefrom, and, to the maximum extent allowed by law, Bloomberg shall not have any liability or responsibility for injury or damages arising in connection therewith.
Neither the information nor any opinion expressed in this report constitutes an offer, or an invitation to make an offer, to buy or sell any securities.
Any return expectations provided are not intended as, and must not be regarded as, a representation, warranty or predication that the investment will achieve any particular rate of return over any particular time period or that investors will not incur losses.
Past performance is not indicative of future results.
Investments in private funds are speculative, involve a high degree of risk, and are designed for sophisticated investors.
All data is as of March 31, 2023 unless otherwise noted.