


-01.webp?width=400)


Performance across the financial markets remained mixed in February for the second consecutive month, with some data released during the month suggesting a potential stall in progress on the Federal Reserve’s (Fed’s) campaign to restore price stability to the U.S. economy. Global equities shrugged off a meaningful monthly rise in interest rates as U.S. large cap stocks (i.e., S&P 500 index) advanced to a new record high during February, demonstrating positive momentum that has persisted into the first half of March. Thematically, domestic equities continued their longstanding string of outperformance versus international, however the gains in emerging market equities nearly matched those of the U.S., buoyed by a bounce across Chinese stocks. The rate-sensitive corners of the bond market were pressured lower during the month as stubbornly elevated inflation contributed to a narrowing in the discounted path of Fed policy easing. This, in turn, led to a 34 basis point monthly rise in the yield on the 10-year U.S. Treasury Note, which ended February at 4.25%. Below investment-grade sectors such as high yield and bank loans saw gains amid a general risk-on tone. In real assets, real estate investment trusts (REITs) generated a nearly 2% total return in February despite the rise in interest rates, while commodity futures declined, and global listed infrastructure posted flat performance.
Economic Update
Disinflationary Momentum Stalls, Calling into Question the Need for Fed Easing
Realized inflationary data received in February highlighted the difficulty policymakers face when inflation is allowed to run “hot” for an extended period—despite the Fed’s best efforts to restore price stability without stoking a recession. Since initiating the tightening process in late 2021, the Fed’s balance sheet has shrunk more than $1 trillion, the policy rate has been raised 525 basis points—the highest level since 2001—and aggregate banking system reserves have been drained to the tune of approximately $700 billion.
In spite of the aggressive policy, inflation rates have stubbornly not yet returned to the Fed’s 2% desired level. A complicating factor in recent months has been the relative outperformance of the U.S. economy, particularly when viewed versus key trading partners such as the euro zone, Japan, and China, with each of these major economies facing recessionary pressures.
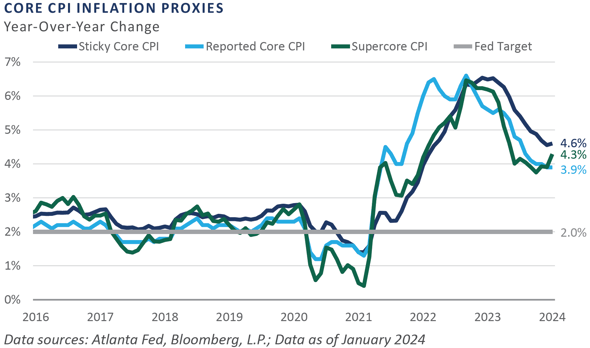
In February, Bureau of Labor Statistics data showed the annual pace of core inflation, which excludes the volatile food and energy sectors, has held steady at 3.9%, essentially matching the pace witnessed since October and nearly doubling the Fed’s 2% target. Moreover, alternative measures of core cost pressures—such as the Atlanta Fed’s sticky CPI series and the closely watched “supercore” series, which measures core services inflation less housing—not only appear to be stabilizing comfortably above the Fed’s target, they also appear to be reaccelerating.
After telegraphing three 25 basis point rate cuts in 2024 at their December 2023 policy meeting via dovish updates to their Summary of Economic Projections dot plot, the Fed is faced with a tricky conundrum as inflation continues to run meaningfully above mandate, domestic stock prices have ascended to record highs, credit spreads have narrowed to near record tight levels, and both gold and bitcoin spot prices have surged to fresh record highs.
With the Fed effectively in a “holding pattern” since July 2023, the lags typically associated with monetary policy do not appear to be applying sufficient downward pressure on price level gains. And with only five scheduled policy meetings before the November presidential election, the Fed’s window to materially ease monetary conditions without overtly appearing to be swaying the result of the election is narrowing. Absent an abrupt deceleration in aggregate demand or inflation, further reductions to the policy rate would likely be met with concerns that the Fed has lost control over the price stability half of its dual mandate.
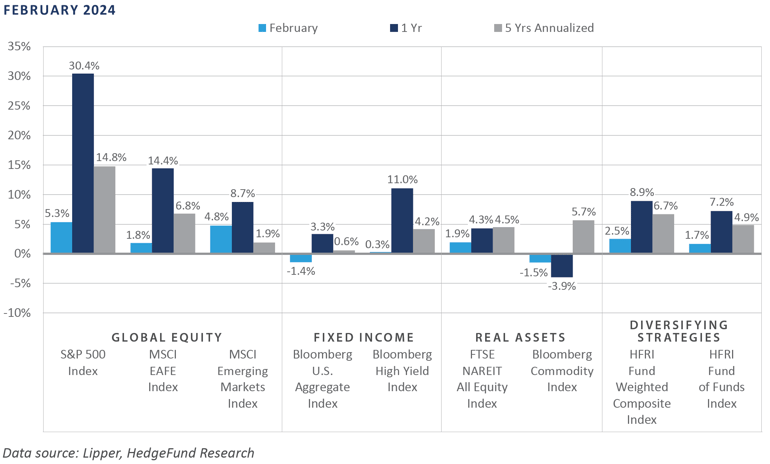
In summary, financial market performance was somewhat mixed in February, with strong gains exhibited by risk sectors such as global equities, below investment grade credit, and REITs, while core bonds and commodities saw losses amid a sharp monthly rise in interest rates and a growth slowdown abroad. Inflationary data released during the month reflected stabilizing cost pressures well above the Fed’s 2% target, calling into question the economic viability of a near-term easing in the federal funds rate despite Fed and bond market measures that continue to indicate at least 75 basis points of policy rate easing throughout the remainder of the year.
Market Summary
Global Equity
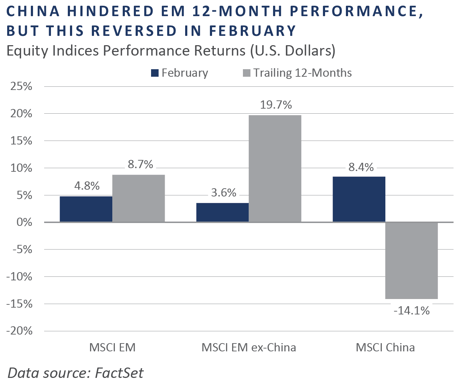
Global equity markets produced positive returns in February. Developed market equities had a particularly strong start to the year, outperforming international markets. However, emerging markets snapped back from January’s under- performance and almost kept pace with the U.S. market, driven by a performance rebound in China amid indications of support from Beijing.
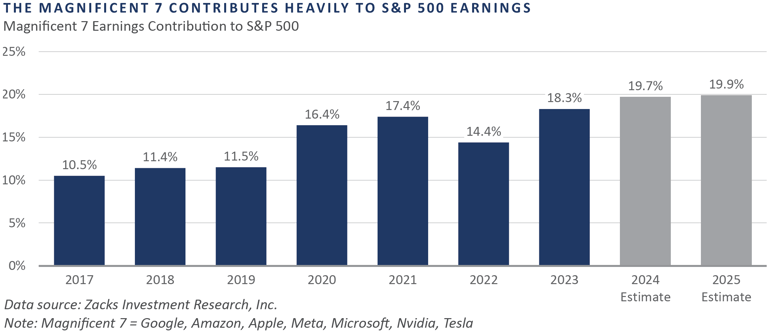
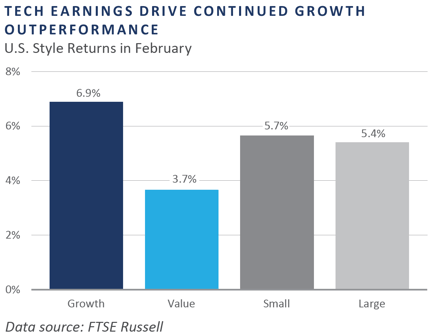
February marked the fourth consecutive month of positive performance for U.S. equities. Domestic stocks have continued to outperform, albeit with a lack of breadth in gaining stocks. NVIDIA’s blowout earnings report in late February drove the stock higher as the company reported quarterly revenue growth of 22% and yearly revenue growth of 265%. NVIDIA finished the month up over 25%, accounting for a fifth of the S&P 500's return. Small caps outperformed large caps within growth as the information technology, healthcare, and consumer discretionary sectors drove Russell 2000 returns.
European equities ex-UK produced positive returns but underperformed U.S. and emerging market equities. Despite economic weakness, consumer discretionary was the top-performing sector, led by luxury retailers and companies within the automotive industry. In late January, LVMH, a French luxury goods holding company, rose 13% following positive earnings that showed an increase in fourth-quarter sales. Real estate was the worst-performing sector as rates remained unchanged and financing costs remained elevated.
UK-based equities finished the month flat. In the second half of 2023, the UK economy officially entered a technical recession with quarterly contractions of 0.1% and 0.3% in last year's third and fourth quarters. Catalysts included the rollover of post-pandemic spending, elevated core inflation, and a continued hawkish stance from the Bank of England. Though inflation data is improving, Governor Andrew Bailey of the Bank of England remains concerned about a possible second wave of inflation later in 2024.
Japanese stocks continued their strong start to 2024, up 3% in USD. In February, the Nikkei 225 Index reached new all-time highs for the first time since the Japanese Bubble in 1989. The recent rally in Japanese equities is the result of a renewed flow from global investors and earnings strength in the industrials and financials sectors. While many countries or regions are struggling with inflation, Japan has benefited from a return to inflation coupled with new reforms around corporate governance.
Emerging market equities finished February with positive returns, outperforming international equities broadly. China experienced a rebound in performance, finishing as the best-performing country following months of turmoil. Signals of government support and increased economic activity drove the rebound. In Korea and Taiwan, enthusiasm and continued demand for artificial intelligence infrastructure boosted the tech sector, specifically hardware.
Fixed Income
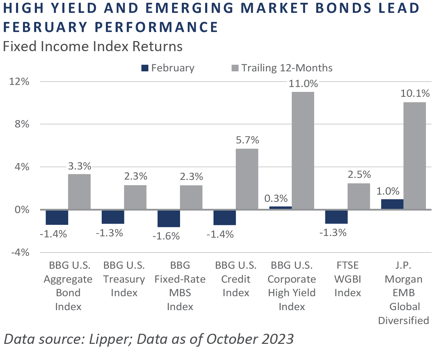
Rates rose in February, with the 10-year Treasury rising 0.22% to 4.27% and the 2-year Treasury rising 0.29% to 4.65%. The 10-year Treasury briefly breached 4.3% during the month—its highest level this year—on the heels of strong economic data, including hot fourth-quarter GDP and January’s CPI report. With this rise in short-term rates, the yield curve further inverted. The 10-year/2-year Treasury spread widened 0.11%, dropping to -0.39%, the highest level of inversion in the new year.
An impending maturity wall looms over subprime leveraged loans in both the U.S. and Europe, posing significant challenges for refinancing, particularly among CCC- rated loans. The leveraged loan market has grown but has also meaningfully deteriorated in quality, given its covenant light structures and floating rate nature. Unlike high yield bonds, leveraged loans face unique refinancing pressures, highlighting the need for proactive risk management strategies amidst evolving market dynamics.
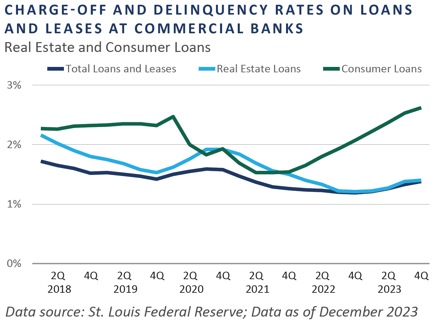
The higher-for-longer narrative continues to be possible; however, delinquency rates for real estate and consumer loans rose modestly between the third and the fourth quarters. Of particular concern is that credit card delinquencies have hit their highest level since the first quarter of 2012. Stock and bond issuance for 2023 mirrored 2022 levels but still lagged considerably compared to previous years. Both stock and bond issuance spiked in November, likely fueled by companies capitalizing on rates subsiding at year-end.
Real Assets
REAL ESTATE
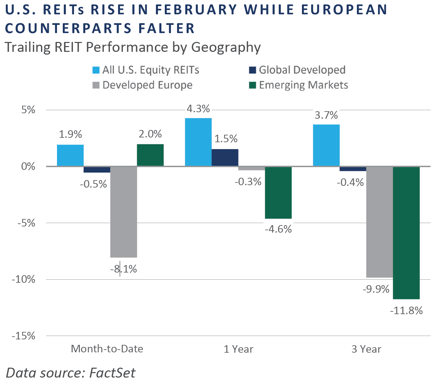
U.S. real estate investment trust (REIT) indices posted modestly positive performance in February, surpassing European REITs, which declined sharply throughout the month. The market’s expectation of rate cuts by the European Central Bank (ECB) was pushed further into the year, as economic data released during the month showed greater-than-expected resiliency in the economy.
NATURAL RESOURCES
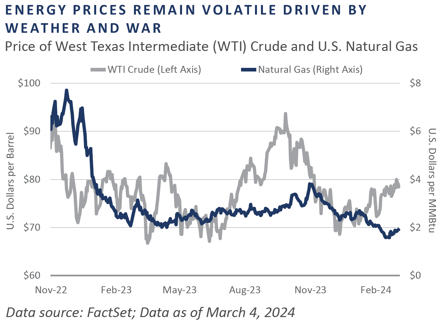
The price of oil, as measured by West Texas Intermediate, rose 2.6% in February, while natural gas, as measured by Henry Hub spot prices, fell -11.4%. Tension in the Middle East continued to support higher oil prices globally as ceasefire negotiations in Gaza stalled. Additionally, the U.S. and UK carried out several strikes on the Houthis Rebel Group in Yemen in response to the group’s attacks on cargo vessels in the Red Sea. Natural gas prices continued to fall during the month as warm winter weather drove supply stockpiles higher.
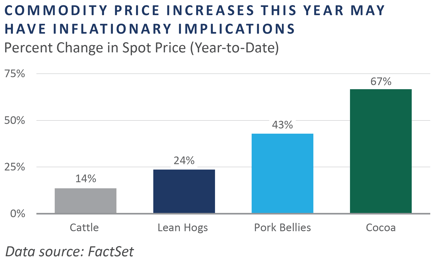
As energy prices take the spotlight, a trend is emerging in agricultural commodity markets, where some prices have risen sharply this year. These increases—ranging from cocoa to meats—are already being felt by consumers through higher prices in grocery stores and restaurants, raising concerns about continued inflationary pressures. The intersection of rising energy and agricultural commodity prices underscores the complex web of factors contributing to inflationary trends and highlights the Fed's challenge of combatting inflation.
INFRASTRUCTURE
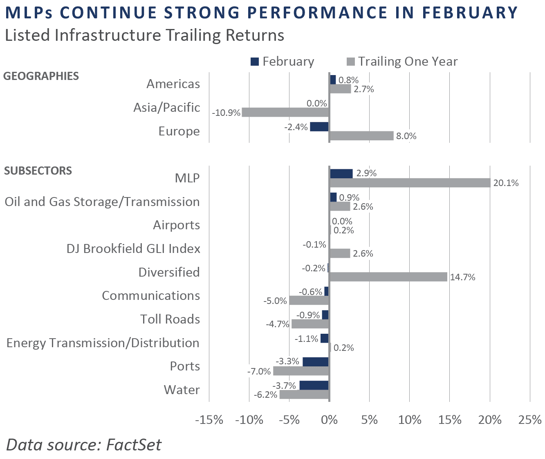
Global listed infrastructure continued to hold flat for February, as measured by the Dow Jones Brookfield Global Infrastructure Index. Higher interest rates continue to put downward pressure on the sector, with rate cut expectations pushed back further into 2024. Master Limited Partnerships (MLPs) have emerged as a standout infrastructure sector over the past year, driven by healthier balance sheets, high free cash flow yields, and growing share buyback programs. The MLP sector increased 2.9% in February and more than 20% year-over-year, as measured by the DJ Brookfield Global Infrastructure MLP Index.
Diversifying Strategies
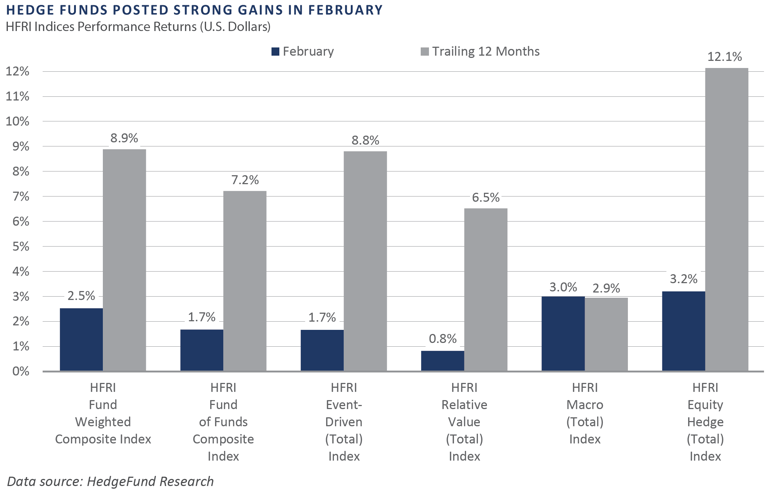
Hedge fund performance was broadly positive, as all main strategies saw gains in February. Global macro and hedged equity were the largest winners, with gains focused on technology, artificial intelligence, and cryptocurrency. An improving outlook for economic growth and expectations for interest rate cuts, among other factors, drove the surge in hedge fund performance.
Hedged equity managers were led by directional strategies, which benefitted from a risk-on environment. The technology and health care sectors were the biggest beneficiaries of that tailwind.
Systematic macro managers generated strong gains in February, with longer-term models outperforming shorter-term ones. Strategies produced profits across agricultural commodities, equities, and currencies. Slightly offsetting those gains were losses in base and precious metals.
INDICES
The Alerian MLP Index is a composite of the 50 most prominent energy Master Limited Partnerships that provides investors with an unbiased, comprehensive benchmark for this emerging asset class.
Bloomberg Fixed Income Indices is an index family comprised of the Bloomberg US Aggregate Index, Government/Corporate Bond Index, Mortgage-Backed Securities Index, and Asset-Backed Securities Index, Municipal Index, High-Yield Index, Commodity Index and others designed to represent the broad fixed income markets and sectors. On August 24, 2016, Bloomberg acquired these long-standing assets from Barclays Bank PLC. and on August 24, 2021, they were rebranded as the Bloomberg Fixed Income Indices. See https://www.bloomberg.com/markets/rates-bonds/bloomberg-fixed-income-indices for more information.
The CBOE Volatility Index (VIX) is an up-to-the-minute market estimate of expected volatility that is calculated by using real-time S&P 500 Index option bid/ask quotes. The Index uses nearby and second nearby options with at least eight days left to expiration and then weights them to yield a constant, 30-day measure of the expected volatility of the S&P 500 Index.
FTSE Real Estate Indices (NAREIT Index and EPRA/NAREIT Index) includes only those companies that meet minimum size, liquidity and free float criteria as set forth by FTSE and is meant as a broad representation of publicly traded real estate securities. Relevant real estate activities are defined as the ownership, disposure, and development of income-producing real estate. See https://www.ftserussell.com/index/category/real-estate for more information.
HFRI Monthly Indices (HFRI) are equally weighted performance indexes, compiled by Hedge Fund Research Inc. (HFX), and are used by numerous hedge fund managers as a benchmark for their own hedge funds. The HFRI are broken down into 37 different categories by strategy, including the HFRI Fund Weighted Composite, which accounts for over 2,000 funds listed on the internal HFR Database. The HFRI Fund of Funds Composite Index is an equal weighted, net of fee, index composed of approximately 800 fund- of- funds which report to HFR. See www.hedgefundresearch.com for more information on index construction.
J.P. Morgan’s Global Index Research group produces proprietary index products that track emerging markets, government debt, and corporate debt asset classes. Some of these indices include the JPMorgan Emerging Market Bond Plus Index, JPMorgan Emerging Market Local Plus Index, JPMorgan Global Bond Non-U.S. Index and JPMorgan Global Bond Non-U.S. Index. See www.jpmorgan.com for more information.
Merrill Lynch high yield indices measure the performance of securities that pay interest in cash and have a credit rating of below investment grade. Merrill Lynch uses a composite of Fitch Ratings, Moody’s and Standard and Poor’s credit ratings in selecting bonds for these indices. These ratings measure the risk that the bond issuer will fail to pay interest or to repay principal in full. See www.ml.com for more information.
Morgan Stanley Capital International – MSCI is a series of indices constructed by Morgan Stanley to help institutional investors benchmark their returns. There are a wide range of indices created by Morgan Stanley covering a multitude of developed and emerging economies and economic sectors. See www.morganstanley.com for more information.
The FTSE Nareit All Equity REITs Index is a free-float adjusted, market capitalization-weighted index of U.S. equity REITs.
Russell Investments rank U.S. common stocks from largest to smallest market capitalization at each annual reconstitution period (May 31). The primary Russell Indices are defined as follows: 1) the top 3,000 stocks become the Russell 3000 Index, 2) the largest 1,000 stocks become the Russell 1000 Index, 3) the smallest 800 stocks in the Russell 1000 Index become the Russell Midcap index, 4) the next 2,000 stocks become the Russell 2000 Index, 5) the smallest 1,000 in the Russell 2000 Index plus the next smallest 1,000 comprise the Russell Microcap Index, and 6) U.S. Equity REITs comprise the FTSE Nareit All Equity REIT Index. See www.russell.com for more information.
S&P 500 Index consists of 500 stocks chosen for market size, liquidity and industry group representation, among other factors by the S&P Index Committee, which is a team of analysts and economists at Standard and Poor’s. The S&P 500 is a market-value weighted index, which means each stock’s weight in the index is proportionate to its market value and is designed to be a leading indicator of U.S. equities, and meant to reflect the risk/return characteristics of the large cap universe. See www.standardandpoors.com for more information.
Information on any indices mentioned can be obtained either through your advisor or by written request to information@feg.com.
DISCLOSURES
This report was prepared by FEG (also known as Fund Evaluation Group, LLC), a federally registered investment adviser under the Investment Advisers Act of 1940, as amended, providing non-discretionary and discretionary investment advice to its clients on an individual basis. Registration as an investment adviser does not imply a certain level of skill or training. The oral and written communications of an adviser provide you with information about which you determine to hire or retain an adviser. Fund Evaluation Group, LLC, Form ADV Part 2A & 2B can be obtained by written request directly to: Fund Evaluation Group, LLC, 201 East Fifth Street, Suite 1600, Cincinnati, OH 45202, Attention: Compliance Department.
The information herein was obtained from various sources. FEG does not guarantee the accuracy or completeness of such information provided by third parties. The information in this report is given as of the date indicated and believed to be reliable. FEG assumes no obligation to update this information, or to advise on further developments relating to it. FEG, its affiliates, directors, officers, employees, employee benefit programs and client accounts may have a long position in any securities of issuers discussed in this report.
Index performance results do not represent any managed portfolio returns. An investor cannot invest directly in a presented index, as an investment vehicle replicating an index would be required. An index does not charge management fees or brokerage expenses, and no such fees or expenses were deducted from the performance shown.
Bloomberg Index Services Limited. BLOOMBERG® is a trademark and service mark of Bloomberg Finance L.P. and its affiliates (collectively “Bloomberg”). Bloomberg or Bloomberg’s licensors own all proprietary rights in the Bloomberg Indices. Bloomberg does not approve or endorse this material or guarantee the accuracy or completeness of any information herein, nor does Bloomberg make any warranty, express or implied, as to the results to be obtained therefrom, and, to the maximum extent allowed by law, Bloomberg shall not have any liability or responsibility for injury or damages arising in connection therewith.
Neither the information nor any opinion expressed in this report constitutes an offer, or an invitation to make an offer, to buy or sell any securities.
Any return expectations provided are not intended as, and must not be regarded as, a representation, warranty or predication that the investment will achieve any particular rate of return over any particular time period or that investors will not incur losses.
Past performance is not indicative of future results.
Investments in private funds are speculative, involve a high degree of risk, and are designed for sophisticated investors.
All data is as of February 29, 2024 unless otherwise noted.