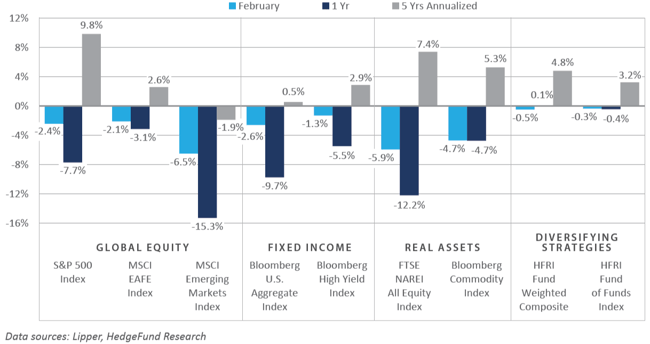
Following a notably strong start to the 2023 calendar year with broad-based gains generated across the major global asset classes and categories in January, financial market performance in February left much to be desired, as equities, bonds, and real assets posted overwhelmingly negative performance amid a steepening in the near-term implied Federal Reserve (Fed) policy path. Supporting the increased sentiment for tighter monetary conditions was a positive upside surprise in the Fed’s preferred inflationary gauge, as well as persistent robust labor market data suggesting historically high demand for labor capital, despite meaningful efforts by the Fed to help bring the labor market back into balance. Global equity performance was broadly negative in February, particularly within emerging markets, which posted a return of -6.5%, the lowest monthly total return since September 2022 (-11.7%). Headwinds included a strengthening U.S. dollar (USD), rising interest rates, and increased U.S.-China geopolitical tensions. Bond market returns were also pressured lower in February, as a steepening of the Fed’s implied tightening path helped drive a meaningful monthly rise in interest rates. In real assets, the interest rate sensitive real estate investment trust (REIT) sector was one of the poorest performing areas within the asset class universe, giving back most of the performance gains experienced in January amid a sharp move higher in Treasury interest rates.
Economic Update
Performance Headwinds Resurface in February Amid Steeper Implied Fed Policy Path
Global investors breathed a sigh of relief in January, as 2022’s performance headwinds—namely aggressive Fed tightening measures that helped drive a surge in interest rates and the global exchange rate value of the USD – took a momentary backseat, supporting a rally across the financial markets. These headwinds resurfaced in February, however, as hotter-than-anticipated inflationary data and a resilient—and historically tight—labor market pointed to the need for further tightening in monetary conditions.
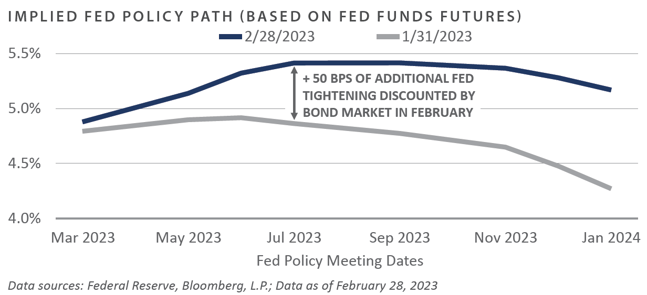
As reported by the Bureau of Economic Analysis and Bureau of Labor Statistics in February, personal consumption expenditure (PCE) and consumer price index (CPI) inflation both came in above sell-side consensus expectations through January, as the ongoing cost of living challenges faced by millions of Americans have proved to be a persistent thorn in the Fed’s side. The failure of inflation to smoothly subside to a level near the Fed’s 2% target— even in the wake of the most aggressive tightening campaign in 40 years—helped drive a notable increase in the terminal federal funds rate expectation as discounted by fed funds futures traders. Expectations shifted 50 basis points higher in February to reflect a policy rate near 5.50% by the summer and served as a key driver behind performance losses across the financial markets during the month.
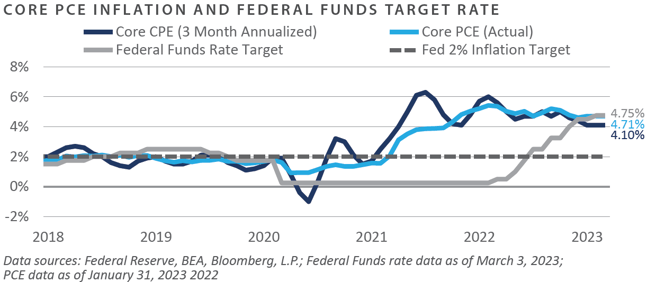
With a current target rate of 4.75%, the federal funds rate now stands above the core PCE on a year-over-year basis as well as on an annualized pace using the last three months of data. This implies the potential for inflation to continue decelerating in the coming months, albeit likely not on a perfect linear trajectory.
Through January, core PCE inflation stood at a 4.7% year-over-year pace, down from the cyclical peak of 5.4% witnessed in February of 2022 but nearly 300 basis points above the Fed’s 2% inflation bogey. The annualization of these figures based on core PCE data reported over the trailing three months shows an even more modest 4.1% pace. With bond market positioning suggesting the Fed is likely to take the policy rate to 5.50% by the summer, further disinflationary momentum may be in order.
In summary, global asset allocators were taken on a round trip through the first two months of 2023, with most of the broad-based performance gains in January given back in February. Hotter-than-expected inflationary pressures, paired with a historically tight labor market and stable current economic conditions, suggest the Fed’s task of restoring price stability remains incomplete.
Market Summary
Global Equity
- Global stock markets finished February in negative territory. At the beginning of the month, the Fed unanimously voted to raise rates 25 bps to 4.75%. Later in February, Chairman Jerome Powell stated that it was premature to declare victory on inflation and that rates would likely increase to an appropriately restrictive level. These comments hurt sentiment, with all S&P 500 sectors producing negative returns.
- The information technology and industrials sectors were comparatively strong. Chip- maker Nvidia (NVDA) was a notable performer, as the stock climbed 18.8% over February due to strong earnings results and greater involvement in the artificial intelligence space. The semiconductor industry as a whole has shown resilience, with the S&P Semiconductor Select Industry Index up 1.1% through February.
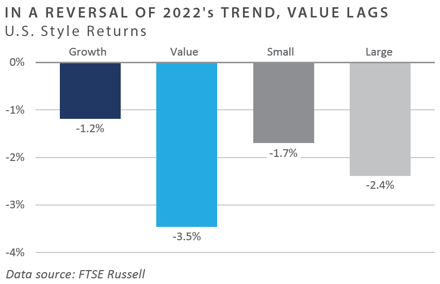
- Reversing some of 2022’s trends, growth equity returns outperformed value equity returns for the month, and energy was the worst-performing sector in February (-8.4%) due to cost pressures hurting sentiment amid declining energy prices.
- Europe was the best-performing region in February, continuing the outperformance from January. European economic data indicates the most robust expansion of business activity since last May. The flash Markit composite purchasing managers’ index for February reached 52.3, up from 50.3 in January. Large caps within the United Kingdom (UK) were among the top contributors to performance in that nation, as the FTSE 100 Index, an index of the 100 largest UK companies, achieved a new record high over the month.
- Japanese equities returns were slightly positive for the month. The yen weakened sharply following testimony from Kazuo Ueda, nominee for governor of the Bank of Japan, who appeared to prefer the status quo on monetary policy. Ueda’s comments were particularly influential on market sentiment given Japan’s recent inflation print of 4.3%, the highest level in 40 years. Quarterly earnings released during the month were mixed, as exporters struggled due to yen appreciation in the fourth quarter, and a slowdown in production hurt tech earnings.
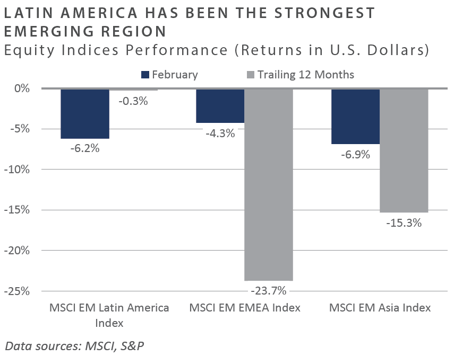
- Emerging markets equity returns were negative for February, posting the worst February returns for the region since 2001. Re-escalation in U.S.-China tensions negatively affected sentiment, while a strengthening dollar acted as a headwind. Regionally, Latin America, which has been a relatively strong performer, and Asia emerging markets were the worst performers. Brazil—an approximately 58% weight in the MSCI Latin American Index—was down 9.2% over the month, while Colombia was down 16.3%. Within Asia, Korea and China drove underperformance amid uncertainty about China’s recovery weighing on the outlook for global trade.
Fixed Income
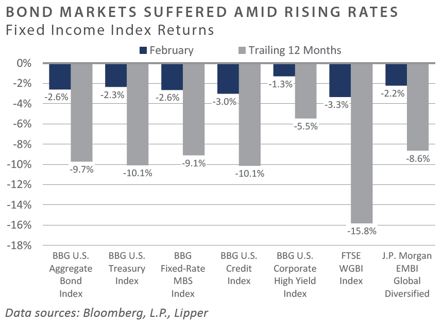
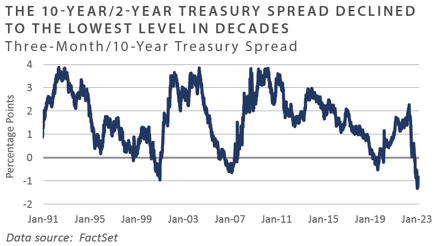
- February brought renewed volatility in the fixed income markets as January’s rate rally proved to be ephemeral. Reminiscent of 2022, strong labor market reports and inflationary data proved to be a catalyst for rising rates. The 2-year Treasury yield ended the month at 4.8%, rising roughly 60 bps. Further out the yield curve, the 10-year Treasury yield moved 40 bps higher, ending the month at 3.9%. More acute movements on the front end of the curve pushed curve inversions further into negative territory. The 10-year/2-year Treasury spread declined 20 bps to below 0.9%, the lowest level since the early 1980s.
- Hotter-than-expected inflation and labor market prints for January pushed market- based expectations for rate hikes more in line with that of the Fed. Market participants came to terms with the reality that the Fed might not be pausing—let alone pivoting— in the near future, as the fed fund futures market essentially removed the expectation for rate cuts in 2023 and pushed the expected terminal rate above 5.5%. As measured by the ICE BofA MOVE Index, interest rate volatility increased roughly 25% to an index level of 124 but is still down from the highs above 160 in the fall.
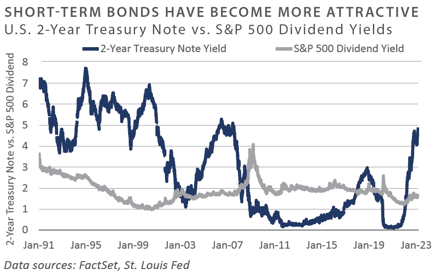
- Credit spreads were largely sideline spectators for the month, seeing relatively small movements. Investment grade (IG) option-adjusted spreads (OAS) widened slightly by five bps, and high yield (HY) OAS tightened by eight bps. Some of the biggest exchange-traded fund (ETF) outflows for the month represented IG and HY sectors, while short-term treasury ETFs were the biggest recipients of inflows. Attractive yields on the short end of the curve are gaining market attention, with investors losing their appetite for more credit risk.
- Mortgage applications were on a steady downward path during the month in the face of rising rates. Issuance of mortgage-backed securities (MBS) has fallen significantly off recent highs, and fears of anemic supply continue to loom, given the current rising trend in mortgage rates. At the same time, the Fed has remained behind schedule with its MBS runoff program due to uncertain payoffs, causing additional technical dynamics in the MBS market. Agency MBS convexity profiles ended February near positive territory as increasing rate volatility and interest rates put downward pressure on bond prices.
Real Assets
REAL ESTATE
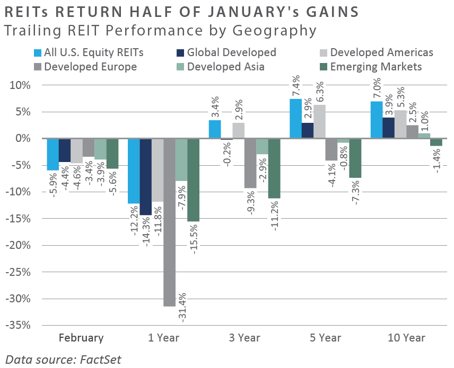
- Global real estate investment trust (REIT) indices posted moderate losses of approximately 4-5% in February. While all regions were down, the U.S. and Asia Pacific (ex-Japan) led losses. Hong Kong REITs were hit particularly hard after the Hong Kong government added national security clauses to their land sale and short- term lease tender documents. The move fueled uncertainty in Hong Kong’s real estate sector and quickly drew concern from investors. Link REIT, Asia’s largest REIT, further exacerbated the shock to Hong Kong’s REIT sector after it unexpectedly proposed a rights issue to raise $2.4 billion to pay down debt amid rising interest rates and fund future acquisitions.
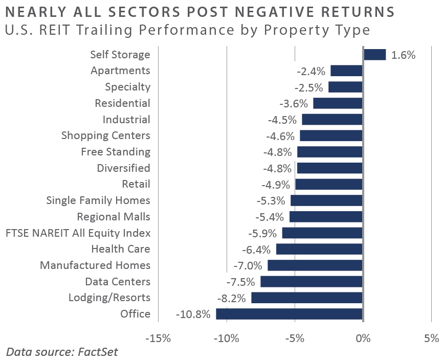
- Concerns about whether inflation adequately declined due to rate hikes were reignited in the face of January’s Consumer Price Index (CPI) print and hotter-than-expected releases for both the Producer Price Index (PPI) and the PCE. As a result, the market became more pessimistic about the near-term possibility of rate cuts, leading to a decline in performance in the broader REIT sector in February. The self-storage REIT sector was the only one with positive performance during the month, driven by potential mergers and acquisitions activity and strong industry fundamentals. Office REITs continued to underperform the group, a persistent theme since the increase in hybrid/remote work due to the COVID-19 pandemic.
NATURAL RESOURCES
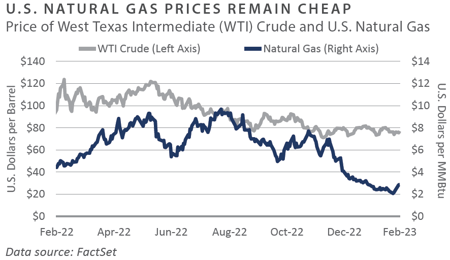
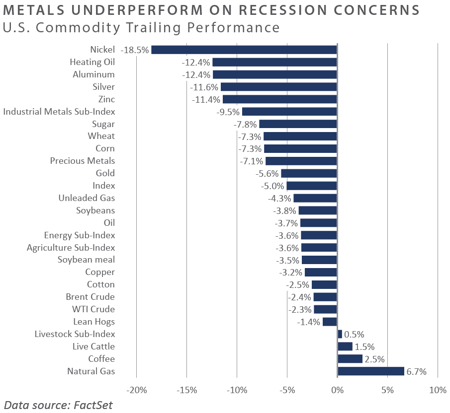
- WTI Crude Oil declined -2.3% in February, the fourth consecutive monthly loss. China reopening remains a key potential tailwind for oil demand, although to what extent was questioned following weaker-than-expected gross domestic product (GDP) forecasts from the Chinese government, targeting economic growth of 5% in 2023, up from 3% in 2022, but below analyst estimates. Natural gas prices increased 6.7% during the month as the Freeport liquified natural gas (LNG) facility came back online after eight months, which supplied roughly 15% of all U.S. LNG before the temporary shutdown. Nonetheless, warmer winter weather and high storage projections have kept prices substantially lower than the record highs seen in 2022.
- Industrial and precious metals declined in February, also attributed to China’s softer GDP growth target. China’s physical commodity demand remained weak, with recovery taking longer than expected following the country’s re-opening.
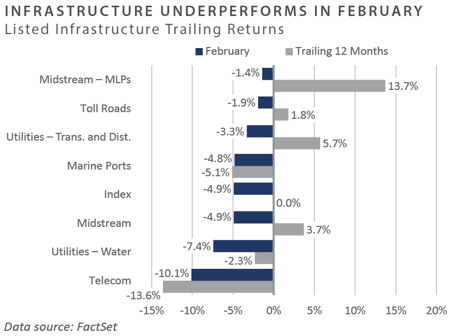
INFRASTRUCTURE
- Global listed infrastructure (GLI) underperformed the broader equity markets in February. All regions declined, with the most significant downturns in the Americas, followed by Asia Pacific, with Europe holding up best. Europe’s relative outperformance was driven by a slight gain from airport names following potentially stronger growth indications. The airport sector was the only GLI sub-sector with positive monthly performance. Conversely, communications was the sub-sector that lagged, as the rise in interest rates disproportionally impacted tower names.
- Midstream Master Limited Partnerships (MLPs) outperformed the broader equity markets in February. The current yield on MLPs stands higher than the broad market benchmark of investment-grade bonds and the 10-year treasury, offering investors an attractive yield spread.
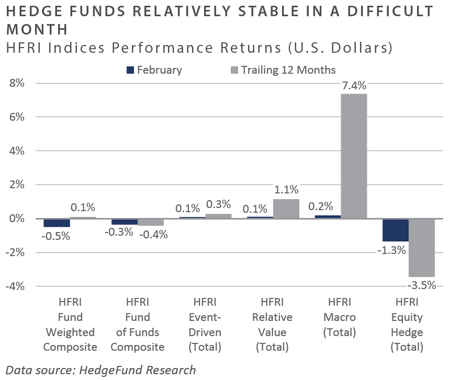
Diversifying Strategies
- Hedge fund performance was sub-par in February due largely to equity hedge strategies. Relative value, event-driven, and macro strategies all produced slightly positive returns.
- Trend-following manager performance varied throughout February. The divergence in performance was primarily driven by market volatility and fluctuations in asset prices, particularly in equity markets. The global energy market volatility created an environment that trend-following strategies have historically found advantageous.
- Within hedged equity, fundamental growth significantly underperformed fundamental value. Quantitative directional and energy/basic were the worst-performing equity hedge strategies for the month, while equity-market neutral and technology strategies managed to avoid notable losses.
- Credit markets tightened, investors remained risk-averse, and high borrowing costs continued to decrease deal flow, which has limited the hard catalyst opportunities funds relied on in past years. In response, many multi-strategy managers have begun shifting portfolios to capitalize on credit arbitrage rather than event-driven opportunities.
INDICES
The Alerian MLP Index is a composite of the 50 most prominent energy Master Limited Partnerships that provides investors with an unbiased, comprehensive benchmark for this emerging asset class.
Bloomberg Fixed Income Indices is an index family comprised of the Bloomberg US Aggregate Index, Government/Corporate Bond Index, Mortgage-Backed Securities Index, and Asset-Backed Securities Index, Municipal Index, High-Yield Index, Commodity Index and others designed to represent the broad fixed income markets and sectors. On August 24, 2016, Bloomberg acquired these long-standing assets from Barclays Bank PLC. and on August 24, 2021, they were rebranded as the Bloomberg Fixed Income Indices. See https://www.bloomberg.com/markets/rates-bonds/bloomberg-fixed-income-indices for more information..
The CBOE Volatility Index (VIX) is an up-to-the-minute market estimate of expected volatility that is calculated by using real-time S&P 500 Index option bid/ask quotes. The Index uses nearby and second nearby options with at least eight days left to expiration and then weights them to yield a constant, 30-day measure of the expected volatility of the S&P 500 Index.
FTSE Real Estate Indices (NAREIT Index and EPRA/NAREIT Index) includes only those companies that meet minimum size, liquidity and free float criteria as set forth by FTSE and is meant as a broad representation of publicly traded real estate securities. Relevant real estate activities are defined as the ownership, disposure, and development of income-producing real estate. See https://www.ftserussell.com/index/category/real-estate for more information.
HFRI Monthly Indices (HFRI) are equally weighted performance indexes, compiled by Hedge Fund Research Inc. (HFX), and are used by numerous hedge fund managers as a benchmark for their own hedge funds. The HFRI are broken down into 37 different categories by strategy, including the HFRI Fund Weighted Composite, which accounts for over 2,000 funds listed on the internal HFR Database. The HFRI Fund of Funds Composite Index is an equal weighted, net of fee, index composed of approximately 800 fund- of- funds which report to HFR. See www.hedgefundresearch.com for more information on index construction.
J.P. Morgan’s Global Index Research group produces proprietary index products that track emerging markets, government debt, and corporate debt asset classes. Some of these indices include the JPMorgan Emerging Market Bond Plus Index, JPMorgan Emerging Market Local Plus Index, JPMorgan Global Bond Non-U.S. Index and JPMorgan Global Bond Non-U.S. Index. See www.jpmorgan.com for more information.
Merrill Lynch high yield indices measure the performance of securities that pay interest in cash and have a credit rating of below investment grade. Merrill Lynch uses a composite of Fitch Ratings, Moody’s and Standard and Poor’s credit ratings in selecting bonds for these indices. These ratings measure the risk that the bond issuer will fail to pay interest or to repay principal in full. See www.ml.com for more information.
Morgan Stanley Capital International – MSCI is a series of indices constructed by Morgan Stanley to help institutional investors benchmark their returns. There are a wide range of indices created by Morgan Stanley covering a multitude of developed and emerging economies and economic sectors. See www.morganstanley.com for more information.
The FTSE Nareit All Equity REITs Index is a free-float adjusted, market capitalization-weighted index of U.S. equity REITs.
Russell Investments rank U.S. common stocks from largest to smallest market capitalization at each annual reconstitution period (May 31). The primary Russell Indices are defined as follows: 1) the top 3,000 stocks become the Russell 3000 Index, 2) the largest 1,000 stocks become the Russell 1000 Index, 3) the smallest 800 stocks in the Russell 1000 Index become the Russell Midcap index, 4) the next 2,000 stocks become the Russell 2000 Index, 5) the smallest 1,000 in the Russell 2000 Index plus the next smallest 1,000 comprise the Russell Microcap Index, and 6) U.S. Equity REITs comprise the FTSE Nareit All Equity REIT Index. See www.russell.com for more information.
S&P 500 Index consists of 500 stocks chosen for market size, liquidity and industry group representation, among other factors by the S&P Index Committee, which is a team of analysts and economists at Standard and Poor’s. The S&P 500 is a market-value weighted index, which means each stock’s weight in the index is proportionate to its market value and is designed to be a leading indicator of U.S. equities, and meant to reflect the risk/return characteristics of the large cap universe. See www.standardandpoors.com for more information.
Information on any indices mentioned can be obtained either through your advisor or by written request to information@feg.com.
DISCLOSURES
This report was prepared by FEG (also known as Fund Evaluation Group, LLC), a federally registered investment adviser under the Investment Advisers Act of 1940, as amended, providing non-discretionary and discretionary investment advice to its clients on an individual basis. Registration as an investment adviser does not imply a certain level of skill or training. The oral and written communications of an adviser provide you with information about which you determine to hire or retain an adviser. Fund Evaluation Group, LLC, Form ADV Part 2A & 2B can be obtained by written request directly to: Fund Evaluation Group, LLC, 201 East Fifth Street, Suite 1600, Cincinnati, OH 45202, Attention: Compliance Department.
The information herein was obtained from various sources. FEG does not guarantee the accuracy or completeness of such information provided by third parties. The information in this report is given as of the date indicated and believed to be reliable. FEG assumes no obligation to update this information, or to advise on further developments relating to it. FEG, its affiliates, directors, officers, employees, employee benefit programs and client accounts may have a long position in any securities of issuers discussed in this report.
Index performance results do not represent any managed portfolio returns. An investor cannot invest directly in a presented index, as an investment vehicle replicating an index would be required. An index does not charge management fees or brokerage expenses, and no such fees or expenses were deducted from the performance shown.
Bloomberg Index Services Limited. BLOOMBERG® is a trademark and service mark of Bloomberg Finance L.P. and its affiliates (collectively “Bloomberg”). Bloomberg or Bloomberg’s licensors own all proprietary rights in the Bloomberg Indices. Bloomberg does not approve or endorse this material or guarantee the accuracy or completeness of any information herein, nor does Bloomberg make any warranty, express or implied, as to the results to be obtained therefrom, and, to the maximum extent allowed by law, Bloomberg shall not have any liability or responsibility for injury or damages arising in connection therewith.
Neither the information nor any opinion expressed in this report constitutes an offer, or an invitation to make an offer, to buy or sell any securities.
Any return expectations provided are not intended as, and must not be regarded as, a representation, warranty or predication that the investment will achieve any particular rate of return over any particular time period or that investors will not incur losses.
Past performance is not indicative of future results.
Investments in private funds are speculative, involve a high degree of risk, and are designed for sophisticated investors.
All data is as of February 28, 2023 unless otherwise noted.