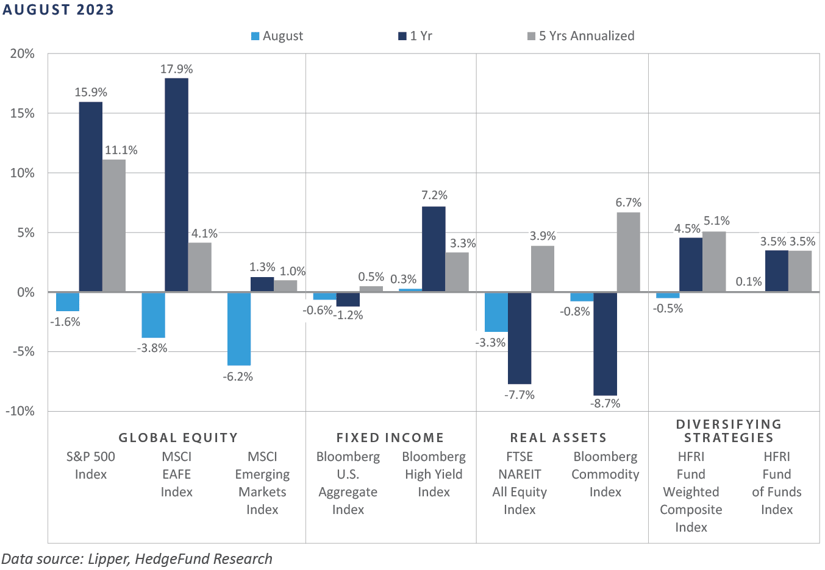
Contrary to the broad-based gains posted through the first seven months of the year, performance across the financial markets in August left much to be desired, with sizable losses blanketing the primary asset classes and categories. The establishment of a new cyclical peak in U.S. interest rates, as proxied by the yield on the benchmark 10-year Treasury Note, sent ripples through the market during the month. Across global equities, returns were overwhelmingly negative, particularly among international and smaller capitalization stocks. Bond performance was mixed on the month, as the rise in rates pressured the rate-sensitive sectors, while credit-oriented sectors eked out modest gains. Across real assets, both real estate investment trusts (REITs) and global listed infrastructure suffered a pullback in performance. At the same time, broad commodity-related indices outperformed, renewing some concerns of a stagflationary regime.
Economic Update
"The lackluster trend of employee productivity in the post-COVID environment has been somewhat alarming despite the narrative of alternative intelligence (AI) economic gains in recent quarters."
Resilient U.S. Labor Market Begins to Show Signs of Cooling
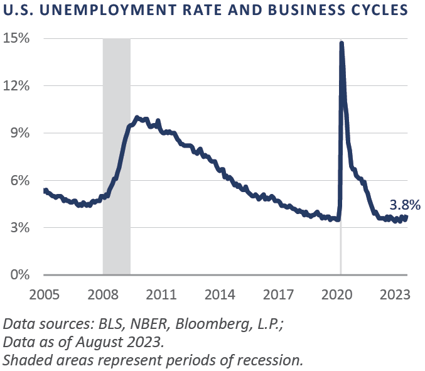
A key factor underpinning the U.S. economy’s growth engine in the post-COVID era took a meaningful step back in August as the Bureau of Labor Statistics reported a 0.3 percentage point (ppt) month-over-month rise in the headline unemployment rate to 3.8%, versus a cyclical low of 3.4% measured in both January and April of 2023.
Often viewed as a key coincident economic indicator, trends across the labor market are a primary variable in estimating the stage of the broader economic cycle. A strengthening labor market is synonymous with economic expansion, a moderating labor market is consistent with a moderating business cycle, and a deteriorating labor backdrop is a classic recessionary dynamic. August’s 0.3 ppt rise in the headline rate of unemployment is consistent with late-expansion tendencies. As indicated by the graph of the U.S. unemployment rate, the labor market has been relatively directionless since spring 2022.
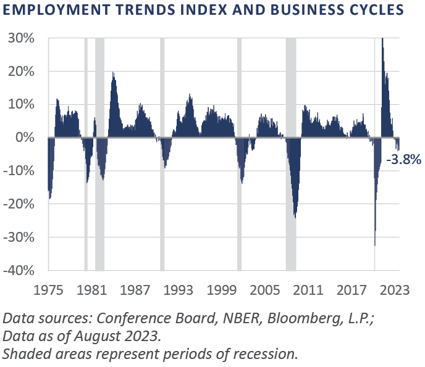
While the single-variable deterioration of the unemployment rate may seem like fodder for dismissal, broader gauges of the fundamental health of the labor market corroborate the recent deterioration. The Conference Board’s Employment Trends Index (ETI), for example, has experienced flat-to-negative growth readings year-to-date.
Notably, this gauge—which weighs eight key variables, including first-time claims for unemployment insurance, trends across temporary employment, and the perception of whether jobs are “hard to get”—has registered nine negative annual growth readings across the last ten monthly observations.
The lackluster trend of employee productivity in the post-COVID environment has been somewhat alarming despite the narrative of alternative intelligence (AI) economic gains in recent quarters. A simplistic read on this phenomenon includes one of the tightest labor market situations in a half-century combined with inflation-adjusted economic growth that has trended towards 2% over the trailing year.
In the quarters ahead, the combination of restrictive monetary policy and stubborn inflationary pressures—and the related tailwind behind employee compensation proclivities—will likely be a recipe for continued weakness across the labor capital engine of the U.S. economy, a circumstance that demands the attention of investors and asset allocators.
To summarize, performance across the primary financial market asset classes and categories was overwhelmingly negative in August, as U.S. Treasury rates ascended to a new cyclical high and the labor market began to exhibit signs of advanced aging. Over the intermediate-term horizon, the Federal Reserve’s (Fed) efforts at engineering an economic soft landing in the wake of one of the worst cost-of-living increases in decades appear to be facing headwinds as one of the remaining expansionary factors succumbs to the grips of increasing monetary restraint.
Market Summary
Global Equity
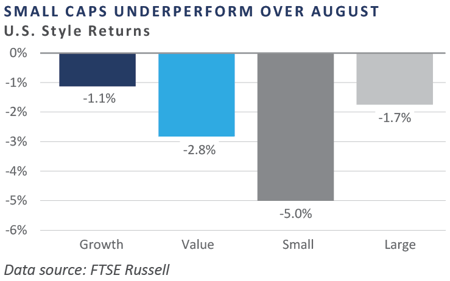
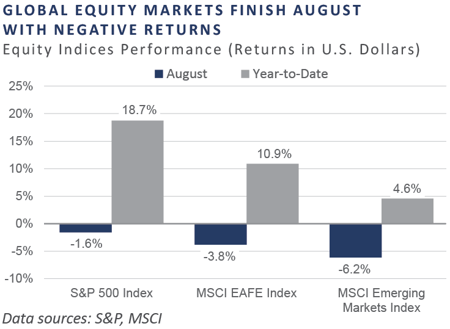
Global equity markets produced negative returns over August, with emerging markets underperforming developed markets. Large caps out-performed small caps, continuing a trend that began in the first half of 2023. Market volatility increased due in part to increased interest rates in multiple markets, signs of European economic weakness, and renewed stress in the Chinese economy, most notably in the property market.
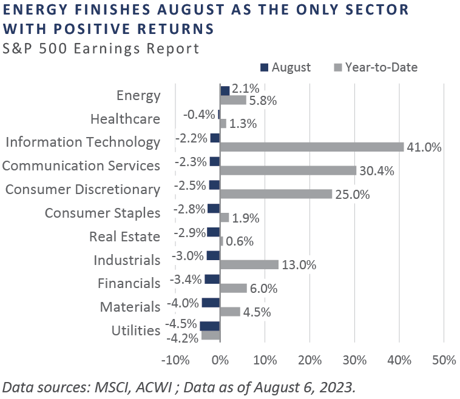
U.S. equity markets finished August with negative absolute returns. The S&P 500 Index declined as many large tech weights within the index experienced a pullback, weighing on the index’s overall returns.
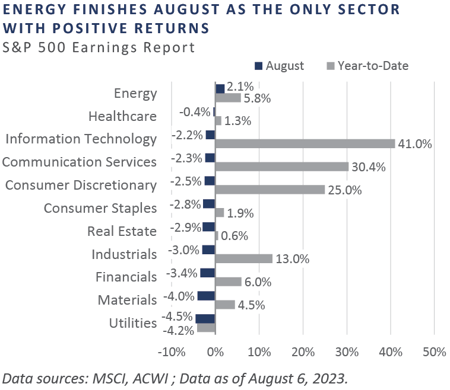
Eurozone shares declined as energy was the only sector to produce positive returns. The worst-performing sectors were those most sensitive to the economic backdrop. Like Europe, UK equities fell in August. Domestically- focused areas of the market, such as consumer discretionary, consumer staples, and industrials, struggled as UK macroeconomic data showed signs of deterioration.
Japanese equities produced mixed returns over the month—large caps underperformed while small and mid cap stocks outperformed. The Bank of Japan’s policy adjustments at the end of July fueled a rise in Japanese government bond yields, negatively impacting large cap growth stocks. Increasing signs of tourism and improving quarter-over-quarter GDP growth data drove the outperformance of domestically-focused small and mid cap stocks.
Emerging market equities produced negative returns in the face of difficulties in China. Chinese property developers Country Garden and Evergrande weighed on the real estate sector, which has been an epicenter of challenges for China. Investor worries about slowing economic growth also acted as a headwind, prompting authorities to announce further economic stimulus, specifically in the real estate sector. Latin America underperformed as a region despite Brazilian authorities cutting interest rates and the nation’s congress approving a new fiscal framework.
Fixed Income
Interest rates rose during the month as rising commodity prices and resilient economic data challenged the peak disinflation narrative. Overall, the 10-year Treasury yield rose 0.12% to 4.09% after trading to a fresh cycle high of 4.34%. The bear steepener continued as the longer end of the yield curve rose more sharply than the front end. The majority of the yield curve remains in inverted territory. The spread between the 10-year and 2-year Treasuries narrowed 0.15%, reaching -0.76%.
At this year’s Jackson Hole Economic Symposium, Fed Chair Powell’s comments did not waiver from the Fed’s commitment to bring inflation down to the 2% target. While market reactions post-meeting were tempered relative to last year, Powell took the opportunity to push back against the notion that the Fed’s 2% target could be pushed higher and would not commit to the path of policy moving forward, opting to remain data-dependent.
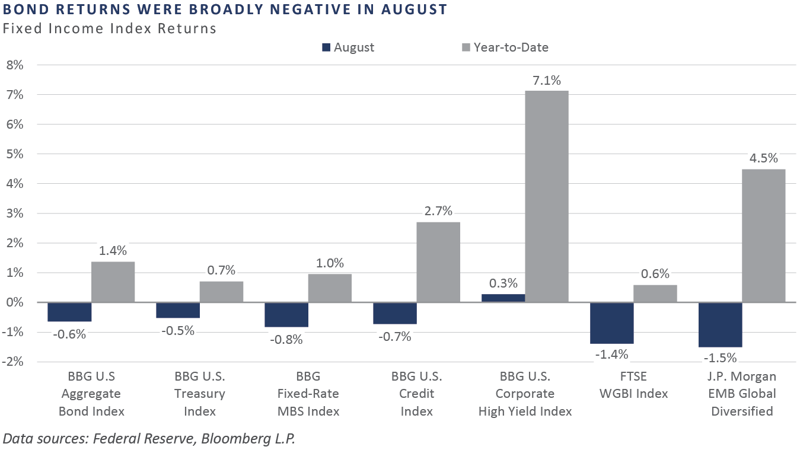
Despite volatility in the equity markets, corporate credit sectors squeezed out mixed performance as carry and modest spread compression offset the impact of rising interest rates. Longer-duration investment grade corporates (IG) returns were negative, falling 0.8%, while higher-carry and high yield corporates (HY) credit eked out a small positive return. Credit spreads remain historically tight, with IG and HY spreads ending the quarter at 1.22% and 3.79%, respectively.
Rising interest rates continued to negatively impact agency mortgage backed securities (MBS) as prepayment assumptions extended. Agency MBS underperformed the Bloomberg U.S. Aggregate Index during the month and lagged the index by roughly 40 basis points year-to-date. Despite the average 30-year fixed rate mortgage reaching more than 7% in August, national home price appreciation remains resilient, as measured by the S&P/Case-Shiller 20-city Home Price Index. Data released in August pointed towards a 0.9% increase month-over-month.
Real Assets
REAL ESTATE
Global real estate investment trust (REIT) indices declined modestly in August amid a sell-off across risk assets. Emerging market REIT indices underperformed their global counterparts, weighed down by China’s real estate troubles. Country Garden, one of China’s largest private real estate developers, missed inter-est payments on two bonds in early August. The event raised significant concerns from investors, who fear a potential collapse of the major developer could reverberate through China’s property market, leading to a substantial decline of confidence in the sector.
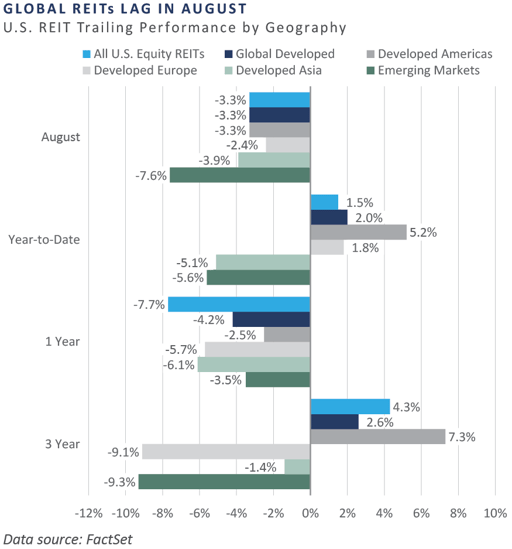
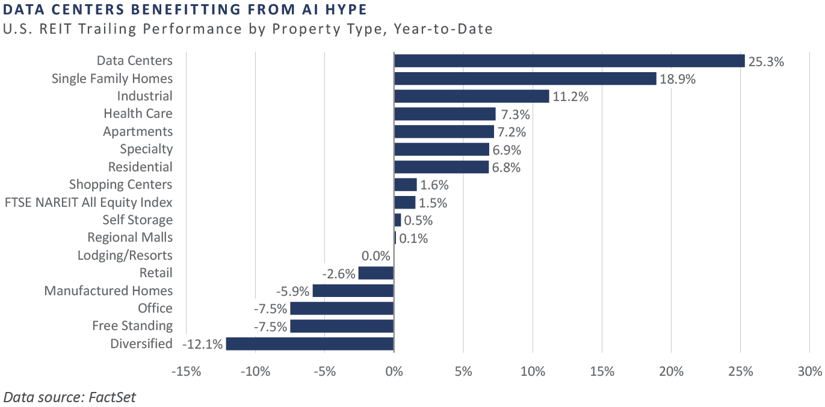
All U.S. REIT property sectors were flat to negative in August. The industrial property sector remained healthy amid continued strong demand, but rent growth has decelerated, according to Green Street. Data center vacancy rates remained low, and industry fundamentals strong, with the potential for AI to drive a significant growth cycle in the data center sector.
NATURAL RESOURCES
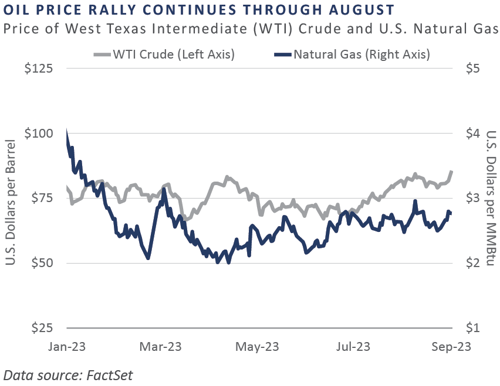
Oil prices, as measured by West Texas Intermediate (WTI), continued to rally through August, rising for the third consecutive month. OPEC+ production cuts continue to put upward pressure on oil prices, with Saudi Arabia and Russia extending their cuts through the end of 2023.
Industrial metals lagged within commodities as slowing global economic growth continued to depress demand. Within the indus-trial metals group, nickel remained most pressured due to the growing supply from Indonesia, the world’s largest nickel supplier. Year-to-date, nickel prices are down more than 30% as measured by the Bloomberg Nickel Subindex.
INFRASTRUCTURE
All global infrastructure indices underperformed in August, with the exclusion of midstream energy. The midstream sector has leveraged its strengthened balance sheets to pursue acquisitions, leading to a trend of consolidation as companies look to enhance their asset base. Additionally, utilities, which com-prise a large portion of the listed infrastructure universe, significantly underperformed the broader market year-to-date—primarily due to higher interest rates—which resulted in their dividend yields becoming less attractive.
Midstream energy infrastructure posted a slight gain of 0.7% during August, benefiting from its attractive yield profile and strength in the broader energy sector.
Diversifying Strategies
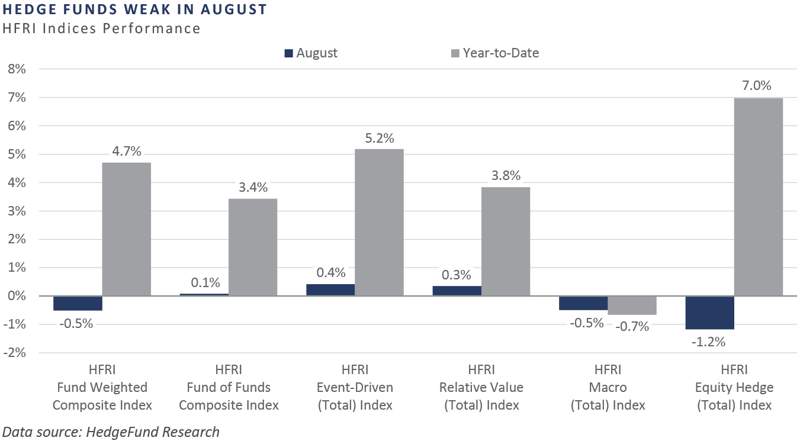
Hedge fund returns were slightly negative in August, with the HFRI Fund Weighted Composite Index declining 0.5%. The HFRI Equity-Hedge Index was the weakest performer, falling over 1%, but year-to-date performance remained strong. The HFRI Event-Driven Index and HFRI Relative Value Index returns were positive for the month, rising 0.4% and 0.3%, respectively.
Hedged equity performance was weak as most S&P 500 sectors were negative on the month. Hedged equity funds experienced a prolonged whipsaw over the summer as funds added to their long books in June and July to cover short positions. Hedge fund gross leverage has been relatively high over the past year, and funds began to slowly de-gross, reducing overall positions while still adding back to short books.
Macro funds struggled despite crude oil prices rising and net buying of energy stocks. Further interest rate hikes and persistent inflation amid a period of low volatility relative to previous market conditions have created a challenging environment for both discretionary and systematic managers. Trend followers have increased exposure to momentum and value over growth while decreasing equity long/short allocations.
INDICES
The Alerian MLP Index is a composite of the 50 most prominent energy Master Limited Partnerships that provides investors with an unbiased, comprehensive benchmark for this emerging asset class.
Bloomberg Fixed Income Indices is an index family comprised of the Bloomberg US Aggregate Index, Government/Corporate Bond Index, Mortgage-Backed Securities Index, and Asset-Backed Securities Index, Municipal Index, High-Yield Index, Commodity Index and others designed to represent the broad fixed income markets and sectors. On August 24, 2016, Bloomberg acquired these long-standing assets from Barclays Bank PLC. and on August 24, 2021, they were rebranded as the Bloomberg Fixed Income Indices. See https://www.bloomberg.com/markets/rates-bonds/bloomberg-fixed-income-indices for more information.
The CBOE Volatility Index (VIX) is an up-to-the-minute market estimate of expected volatility that is calculated by using real-time S&P 500 Index option bid/ask quotes. The Index uses nearby and second nearby options with at least eight days left to expiration and then weights them to yield a constant, 30-day measure of the expected volatility of the S&P 500 Index.
FTSE Real Estate Indices (NAREIT Index and EPRA/NAREIT Index) includes only those companies that meet minimum size, liquidity and free float criteria as set forth by FTSE and is meant as a broad representation of publicly traded real estate securities. Relevant real estate activities are defined as the ownership, disposure, and development of income-producing real estate. See https://www.ftserussell.com/index/category/real-estate for more information.
HFRI Monthly Indices (HFRI) are equally weighted performance indexes, compiled by Hedge Fund Research Inc. (HFX), and are used by numerous hedge fund managers as a benchmark for their own hedge funds. The HFRI are broken down into 37 different categories by strategy, including the HFRI Fund Weighted Composite, which accounts for over 2,000 funds listed on the internal HFR Database. The HFRI Fund of Funds Composite Index is an equal weighted, net of fee, index composed of approximately 800 fund- of- funds which report to HFR. See www.hedgefundresearch.com for more information on index construction.
J.P. Morgan’s Global Index Research group produces proprietary index products that track emerging markets, government debt, and corporate debt asset classes. Some of these indices include the JPMorgan Emerging Market Bond Plus Index, JPMorgan Emerging Market Local Plus Index, JPMorgan Global Bond Non-U.S. Index and JPMorgan Global Bond Non-U.S. Index. See www.jpmorgan.com for more information.
Merrill Lynch high yield indices measure the performance of securities that pay interest in cash and have a credit rating of below investment grade. Merrill Lynch uses a composite of Fitch Ratings, Moody’s and Standard and Poor’s credit ratings in selecting bonds for these indices. These ratings measure the risk that the bond issuer will fail to pay interest or to repay principal in full. See www.ml.com for more information.
Morgan Stanley Capital International – MSCI is a series of indices constructed by Morgan Stanley to help institutional investors benchmark their returns. There are a wide range of indices created by Morgan Stanley covering a multitude of developed and emerging economies and economic sectors. See www.morganstanley.com for more information.
The FTSE Nareit All Equity REITs Index is a free-float adjusted, market capitalization-weighted index of U.S. equity REITs.
Russell Investments rank U.S. common stocks from largest to smallest market capitalization at each annual reconstitution period (May 31). The primary Russell Indices are defined as follows: 1) the top 3,000 stocks become the Russell 3000 Index, 2) the largest 1,000 stocks become the Russell 1000 Index, 3) the smallest 800 stocks in the Russell 1000 Index become the Russell Midcap index, 4) the next 2,000 stocks become the Russell 2000 Index, 5) the smallest 1,000 in the Russell 2000 Index plus the next smallest 1,000 comprise the Russell Microcap Index, and 6) U.S. Equity REITs comprise the FTSE Nareit All Equity REIT Index. See www.russell.com for more information.
S&P 500 Index consists of 500 stocks chosen for market size, liquidity and industry group representation, among other factors by the S&P Index Committee, which is a team of analysts and economists at Standard and Poor’s. The S&P 500 is a market-value weighted index, which means each stock’s weight in the index is proportionate to its market value and is designed to be a leading indicator of U.S. equities, and meant to reflect the risk/return characteristics of the large cap universe. See www.standardandpoors.com for more information.
Information on any indices mentioned can be obtained either through your advisor or by written request to information@feg.com.
DISCLOSURES
This report was prepared by FEG (also known as Fund Evaluation Group, LLC), a federally registered investment adviser under the Investment Advisers Act of 1940, as amended, providing non-discretionary and discretionary investment advice to its clients on an individual basis. Registration as an investment adviser does not imply a certain level of skill or training. The oral and written communications of an adviser provide you with information about which you determine to hire or retain an adviser. Fund Evaluation Group, LLC, Form ADV Part 2A & 2B can be obtained by written request directly to: Fund Evaluation Group, LLC, 201 East Fifth Street, Suite 1600, Cincinnati, OH 45202, Attention: Compliance Department.
The information herein was obtained from various sources. FEG does not guarantee the accuracy or completeness of such information provided by third parties. The information in this report is given as of the date indicated and believed to be reliable. FEG assumes no obligation to update this information, or to advise on further developments relating to it. FEG, its affiliates, directors, officers, employees, employee benefit programs and client accounts may have a long position in any securities of issuers discussed in this report.
Index performance results do not represent any managed portfolio returns. An investor cannot invest directly in a presented index, as an investment vehicle replicating an index would be required. An index does not charge management fees or brokerage expenses, and no such fees or expenses were deducted from the performance shown.
Bloomberg Index Services Limited. BLOOMBERG® is a trademark and service mark of Bloomberg Finance L.P. and its affiliates (collectively “Bloomberg”). Bloomberg or Bloomberg’s licensors own all proprietary rights in the Bloomberg Indices. Bloomberg does not approve or endorse this material or guarantee the accuracy or completeness of any information herein, nor does Bloomberg make any warranty, express or implied, as to the results to be obtained therefrom, and, to the maximum extent allowed by law, Bloomberg shall not have any liability or responsibility for injury or damages arising in connection therewith.
Neither the information nor any opinion expressed in this report constitutes an offer, or an invitation to make an offer, to buy or sell any securities.
Any return expectations provided are not intended as, and must not be regarded as, a representation, warranty or predication that the investment will achieve any particular rate of return over any particular time period or that investors will not incur losses.
Past performance is not indicative of future results.
Investments in private funds are speculative, involve a high degree of risk, and are designed for sophisticated investors.
All data is as of Augusst 31, 2023 unless otherwise noted.