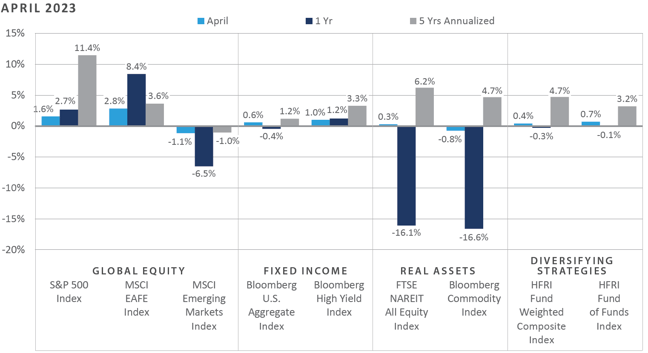
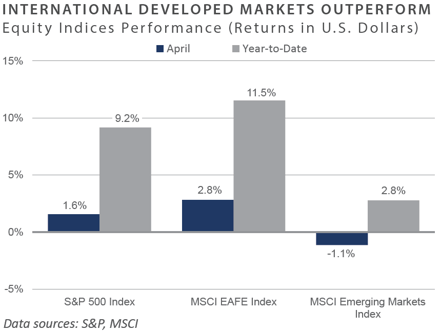
Continued uncertainty surrounding the ongoing debt ceiling negotiations, renewed stress within the regional banking industry, and an early May rate hike by the Federal Reserve (Fed) were some of the key macro developments that warranted investors’ attention throughout April and into the early trading days of May. Despite this, global equity returns were mostly positive across the financial markets in April, with continued outperformance on behalf of international developed equities versus both domestic equities and—even more so—emerging market equities. Performance across the fixed income landscape was overwhelmingly positive on the month, with credit-oriented sectors posting relatively stronger returns versus their interest rate-sensitive counterparts amid a generally supportive environment for risk assets, despite persistent recessionary pressures and a further tightening in monetary conditions. Similar to stocks and bonds, most major real asset sectors witnessed positive performance in April, particularly in the global listed infrastructure space.
Economic Update
Financial Markets Shrug Off Macro Headwinds in April with Broadly Positive Gains
After weathering a flare-up of banking system stressors in March—including the failures of both Silicon Valley Bank and Signature Bank—performance across the major financial market asset classes and categories was overwhelmingly positive in April against an abundance of worrisome macro developments. Notable headwinds that have surfaced in recent months include ongoing strains across the U.S. banking system—particularly among regional banks—numerous recessionary warning signals, an unresolved debt ceiling debate, and a further tightening in monetary conditions by the Fed in early May. Additionally, San Francisco-based First Republic Bank was the third U.S. bank failure thus far in 2023, with JPMorgan Chase Bank acquiring the institution on May 1.
At their policy meeting on May 2-3, the Federal Open Market Committee (FOMC) raised the policy rate 25 basis points (bps) to a new upper limit of 5.25%. The hike, which was largely anticipated by swap and Fed funds futures prices preceding the announcement, may prove to be the final hike in the Fed’s ongoing tightening campaign, should the Fed manage its near-term monetary operations in line with market-implied expectations. Market expectations have evolved in recent trading activity to reflect increasing sentiment for interest rate cuts by the summer.
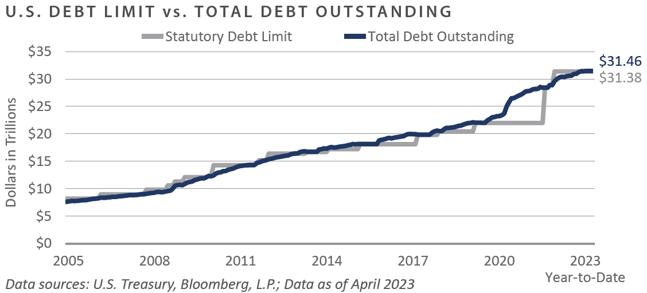
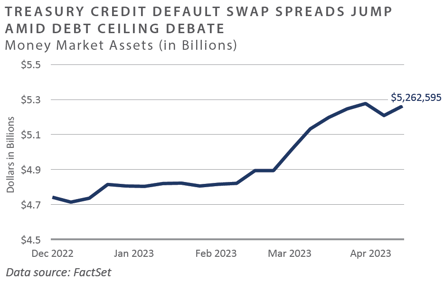
In addition to the Fed’s latest increase in the overnight borrowing rate and its lagged effect on aggregate demand and inflation, investors have also grappled with ongoing debt ceiling negotiations, which are expected to persist until the eleventh hour. The so-called “X-date” when the Treasury is anticipated to deplete its emergency reserves has been estimated by policymakers and market participants to potentially occur as soon as June 1. Through April, total public debt outstanding outstripped the statutory debt limit by nearly $100 billion.
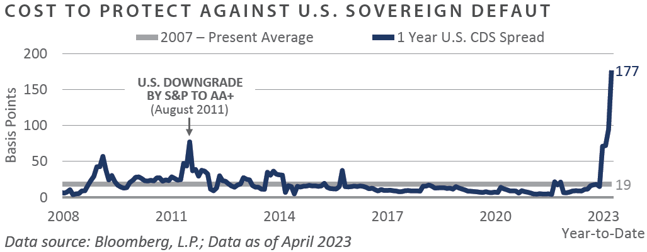
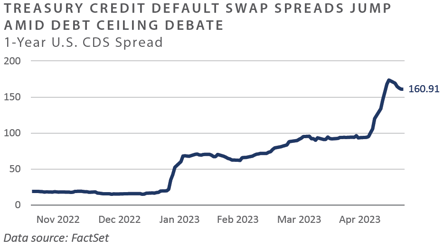
While the Treasury technically defaulting on its debt may seem an unlikely scenario, the cost to protect against such an event has surged to a record high, surpassing levels witnessed in both the 2007-2008 Global Financial Crisis and the debt ceiling debacle of 2011 in which Standard Poor’s downgraded the U.S. sovereign credit one notch from AAA to AA+.
Near-term (i.e., 1-year) credit default swap (CDS) spreads blew out to nearly 180 bps by the end of April, a level approximately 100 basis points above the previous peak established in 2011 and almost ten times the 2007 to present average.
Despite the disconcerting macro developments discussed above, risk assets and safe havens alike posted solid performance in April. This may likely reflect the market’s ongoing discounting of an expected Fed pivot to easier monetary conditions—a somewhat peculiar potentiality given persistent sticky inflation measures.
In summary, in spite of numerous headwinds, including a recent increase to the policy rate, persistent banking system stress, and surging costs to protect against a U.S. sovereign default, financial market performance in April appeared broadly positive, with the market discounting looming Fed pivot presumably supporting risk appetites.
Market Summary
Global Equity
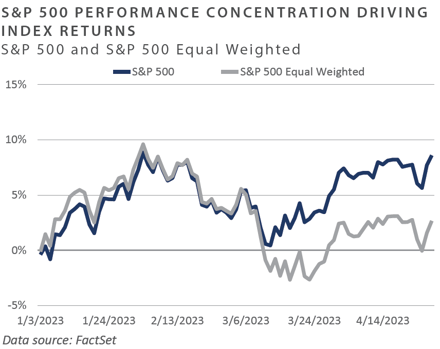
- Global stock market returns were mixed over the month, as the U.S. and international markets saw positive returns while emerging markets results turned negative. The S&P 500’s positive return in April was driven by a few stocks—Microsoft, Apple, and Meta contributed over half of the index’s return, as the market-weighted index remains top-heavy.
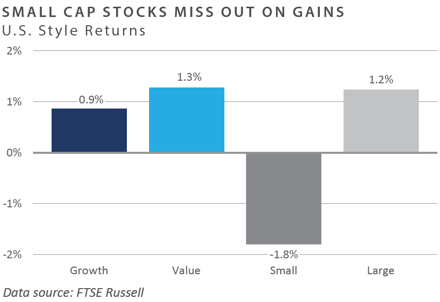
- Value outperformed growth equity in large caps but underperformed in small caps. More broadly, however, large caps outperformed small caps. All S&P 500 sectors produced positive returns over the month, led by the communication services and real estate sectors. Meta announced positive earnings at the end of the month, benefiting the communication services sector, which finished the quarter up approximately 13%.
- European equities finished the month strong, with all sectors producing positive returns. Real estate was the top-performing sector, which marked a notable turnaround as it had been the worst-performing sector over the trailing one-year. Information technology was the worst-performing sector within Europe as several semiconductor companies warned that a demand slowdown would likely be longer than expected. In the United Kingdom, sector performance was largely positive. Financials were the most significant contributor to returns due to receding fears around the health system. Other top contributors were Shell and BP, boosted by a recovery in oil prices after OPEC+ announced a surprise production cut.
- Japanese equities produced slightly positive returns on the month. The Tokyo Stock Exchange’s February decision to push companies with a below 1x price-to-book ratio to develop capital improvement plans to boost corporate values and stock prices saw momentum as foreign investors purchased Japanese stocks rapidly in April. The Bank of Japan’s first policy meeting under Governor Ueda’s leadership was interpreted as dovish, causing the yen to weaken.
- Emerging markets equities produced negative returns over the month. Despite positive first-quarter gross domestic product (GDP) data and retail sales numbers, geopolitical tensions weighed on Chinese equity returns as the country’s markets finished April in the red. Increasing reports of possible U.S. investment regulations on China led the communication services, information technology, and consumer discretionary sectors to produce negative returns. Although China and Taiwan detracted from the overall performance of emerging markets, India, Brazil, and Saudi Arabia saw positive returns. Saudi Arabia benefited from oil production cuts, while Brazil’s political issues have shown signs of abating, improving sentiment.
Fixed Income
- The Treasury yield curve was little changed on a month-over-month basis. However, the uncomfortably high interest rate volatility trend continued in April, with the 10-year and 2-year Treasury yields trading within a range of 30 bps and 45 bps, respectively. The yield curve remained inverted, as the 10-year/2-year Treasury yield spread was static over the month following a rapid steepening in March.
- The ISM Services Purchasing Managers' Index (PMI) increased to 51.9 in April, indicating the most significant expansion in the services sector in a year, supported by growth in output and new orders. The ISM Manufacturing PMI—while still in contraction territory—rose to 47.1 in April from a 3-year low of 46.3 in March and slightly above the market consensus of 46.8. PMIs and the labor market point to solid economic momentum, but forward-looking indicators offer a contrasting view. The Conference Board’s Leading Economic Indicators Index was released in April and printed at -1.2% month-over-month. Additional banking turmoil and the looming potential of a U.S. government default added to a problematic macroeconomic backdrop for investors.
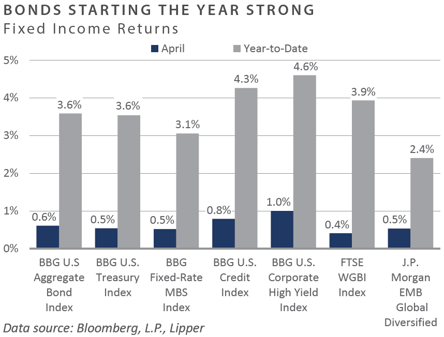
- Credit spreads continued to paint a rosy picture despite the tightening lending standards, providing a trend that contradicts the historically high correlation between tightening credit conditions and the widening of corporate credit spreads. During the month, investments grade (IG) and high yield (HY) spreads compressed slightly to 1.4% and 4.5% respectively. Earnings reports in the first quarter delivered a better picture than initially feared, but expectations were low given that many management teams had issued cautious guidance while downgrading their forecasts. While the performance was not as negative as expected, the index still reported a year-over-year decline in earnings.
- The Federal Deposit Insurance Corporation (FDIC) selected BlackRock Inc's Financial Market Advisory unit to market Signature and Silicon Valley Banks' securities portfolio with sales starting in mid-April. The assets for sale include agency mortgage-backed securities, commercial mortgage-backed securities, and other securities created in the low-rate environment. Even though the selling process is expected to be orderly, spreads widened in anticipation of the increased supply. Recent turmoil in regional banks has also put pressure on the Commercial Real Estate (CRE) sector, as banks account for a large proportion of CRE lending sources. The office sector is broadly anticipated to face the most acute pressure as demographic changes and work-from-home policies pressure occupancy.
Real Assets
REAL ESTATE
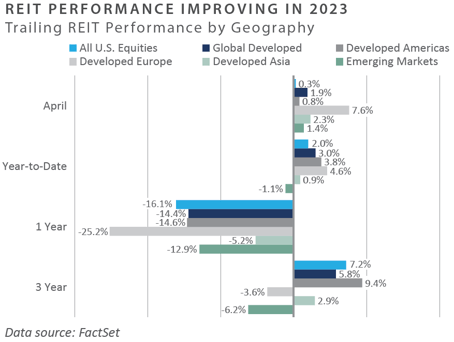
- Global real estate returns improved through April after drawing down the prior month, as concerns of contagion between regional banks and commercial property persisted. The FTSE NAREIT All Equity REITs index remained flat for the month. At the same time, the FTSE EPRA/NAREIT Developed Index rose 1.9%, led by the recovery of developed Europe after the first-quarter drawdown on the back of contagion concerns around the Credit Suisse failure.
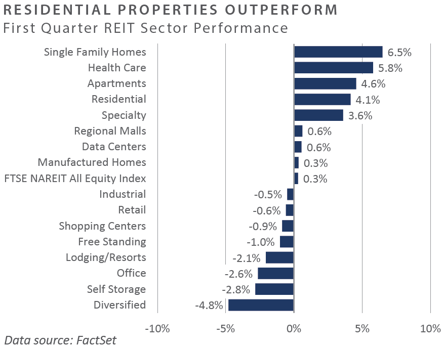
- Residential property sectors were top performers among U.S. REITs, driven by continued strong fundamentals. In contrast, other sectors like office and lodging fell further on concerns of slower leasing heading into an economic slowdown. Retail and industrial sectors, in aggregate, were flat for the month as fundamentals remained unchanged and investors looked for more guidance on consumer demand and spending patterns.
NATURAL RESOURCES
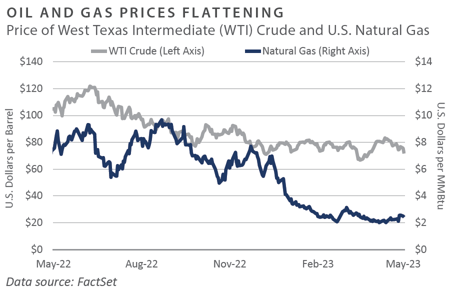
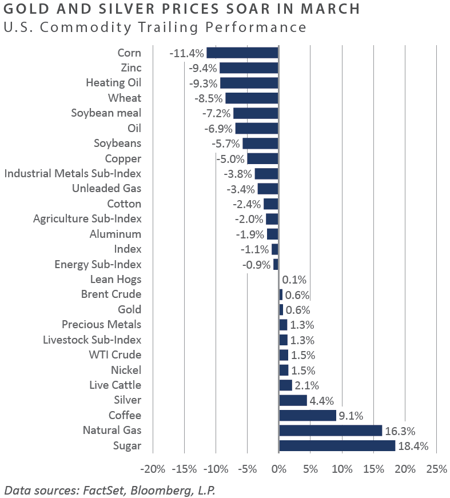
- Following a surprise production cut announcement by OPEC+ on April 2, crude oil prices jumped to a year-to-date high of $82/barrel. However, the pricing support from the production cuts did not hold, as prices came back down to $72/barrel at the end of the month. The market has expected no further production cuts in the near term, but crude pricing remained pressured. Market participants have indicated they expect OPEC+ to make efforts to support oil prices at an $80/barrel target.
- The sharp decline in natural gas pricing reversed in April after approaching what many believe to be a $2/MMBtu floor. Countries that typically begin their injection season to build stores after winter did not have to come to market coming out of the first quarter, given their full storage levels heading into the warmer-than-expected winter. Natural gas pricing now looks ahead to expected summer weather as many coal-fired power plants have switched to natural gas as a fuel source.
- Grain commodities sold off for another consecutive month in April as a favorable growing season is expected in North and South America due to the developing El Niño weather system. These commodities also started the year coming down from the highs of 2022 due to volatility from the Russia-Ukraine war.
INFRASTRUCTURE
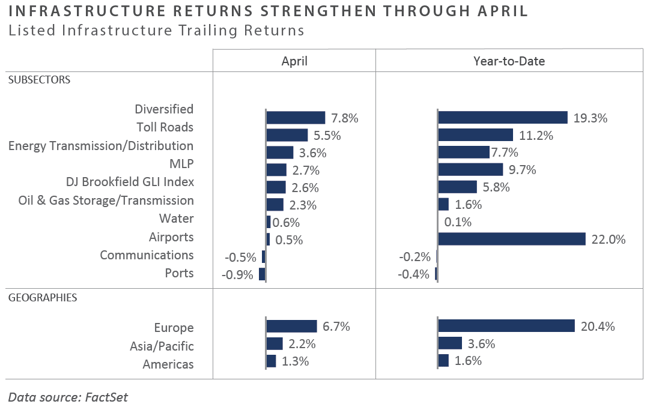
- The majority of global listed infrastructure sectors posted positive performance in April, with the exception of the communication and port sectors. Airports, toll roads, and diversified infrastructure led the group in performance, with global travel increasing month-over-month. Energy-related infra-structure also performed positively in light of commodity price drawdowns, given that names in these sectors have significantly limited exposure to debt and are committed to returning capital to shareholders.
Diversifying Strategies
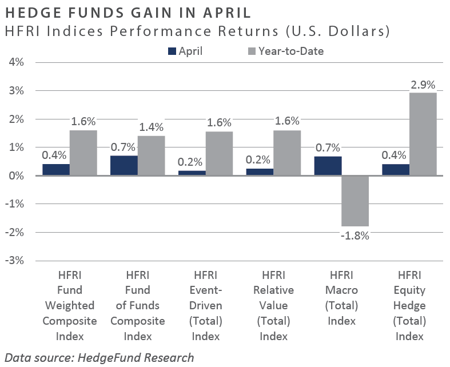
- Hedge funds provided positive returns in April, with the HFRI Fund Weighted Composite Index gaining 0.4%. All main hedge fund strategies were modest contributors for the month. Each strategy displayed the ability to preserve capital and navigate challenging market conditions.
- Hedged equity was up 4% over the month as strategies managed to catch a portion of equities' upwards swing in April. The HFRI Equity Hedge Healthcare Index far outperformed all other hedged equity strategies, returning 3.9%. Conversely, the HFRI Equity Hedge Technology Index far underperformed, returning -2.8% on the month.
- Macro rebounded from the previous quarter despite the choppy nature of commodities and currencies throughout April. OPEC+ supply cuts were met with uncertain global demand, making it challenging to trade directionally. Macro strategies were prompt to create positions around ongoing agricultural supply issues worldwide—specifically in sugar, corn, and wheat.
- Trend following strategies that were short the curve in the first quarter have reeled in positions towards neutral holdings as leading indicators point towards a freeze in interest rate hikes. Trend followers took risk-on positions adding to equities, as upbeat earnings data from large U.S. technology companies outweighed continued fears surrounding regional bank liquidity pressure.
INDICES
The Alerian MLP Index is a composite of the 50 most prominent energy Master Limited Partnerships that provides investors with an unbiased, comprehensive benchmark for this emerging asset class.
Bloomberg Fixed Income Indices is an index family comprised of the Bloomberg US Aggregate Index, Government/Corporate Bond Index, Mortgage-Backed Securities Index, and Asset-Backed Securities Index, Municipal Index, High-Yield Index, Commodity Index and others designed to represent the broad fixed income markets and sectors. On August 24, 2016, Bloomberg acquired these long-standing assets from Barclays Bank PLC. and on August 24, 2021, they were rebranded as the Bloomberg Fixed Income Indices. See https://www.bloomberg.com/markets/rates-bonds/bloomberg-fixed-income-indices for more information.
The CBOE Volatility Index (VIX) is an up-to-the-minute market estimate of expected volatility that is calculated by using real-time S&P 500 Index option bid/ask quotes. The Index uses nearby and second nearby options with at least eight days left to expiration and then weights them to yield a constant, 30-day measure of the expected volatility of the S&P 500 Index.
FTSE Real Estate Indices (NAREIT Index and EPRA/NAREIT Index) includes only those companies that meet minimum size, liquidity and free float criteria as set forth by FTSE and is meant as a broad representation of publicly traded real estate securities. Relevant real estate activities are defined as the ownership, disposure, and development of income-producing real estate. See https://www.ftserussell.com/index/category/real-estate for more information.
HFRI Monthly Indices (HFRI) are equally weighted performance indexes, compiled by Hedge Fund Research Inc. (HFX), and are used by numerous hedge fund managers as a benchmark for their own hedge funds. The HFRI are broken down into 37 different categories by strategy, including the HFRI Fund Weighted Composite, which accounts for over 2,000 funds listed on the internal HFR Database. The HFRI Fund of Funds Composite Index is an equal weighted, net of fee, index composed of approximately 800 fund- of- funds which report to HFR. See www.hedgefundresearch.com for more information on index construction.
J.P. Morgan’s Global Index Research group produces proprietary index products that track emerging markets, government debt, and corporate debt asset classes. Some of these indices include the JPMorgan Emerging Market Bond Plus Index, JPMorgan Emerging Market Local Plus Index, JPMorgan Global Bond Non-U.S. Index and JPMorgan Global Bond Non-U.S. Index. See www.jpmorgan.com for more information.
Merrill Lynch high yield indices measure the performance of securities that pay interest in cash and have a credit rating of below investment grade. Merrill Lynch uses a composite of Fitch Ratings, Moody’s and Standard and Poor’s credit ratings in selecting bonds for these indices. These ratings measure the risk that the bond issuer will fail to pay interest or to repay principal in full. See www.ml.com for more information.
Morgan Stanley Capital International – MSCI is a series of indices constructed by Morgan Stanley to help institutional investors benchmark their returns. There are a wide range of indices created by Morgan Stanley covering a multitude of developed and emerging economies and economic sectors. See www.morganstanley.com for more information.
The FTSE Nareit All Equity REITs Index is a free-float adjusted, market capitalization-weighted index of U.S. equity REITs.
Russell Investments rank U.S. common stocks from largest to smallest market capitalization at each annual reconstitution period (May 31). The primary Russell Indices are defined as follows: 1) the top 3,000 stocks become the Russell 3000 Index, 2) the largest 1,000 stocks become the Russell 1000 Index, 3) the smallest 800 stocks in the Russell 1000 Index become the Russell Midcap index, 4) the next 2,000 stocks become the Russell 2000 Index, 5) the smallest 1,000 in the Russell 2000 Index plus the next smallest 1,000 comprise the Russell Microcap Index, and 6) U.S. Equity REITs comprise the FTSE Nareit All Equity REIT Index. See www.russell.com for more information.
S&P 500 Index consists of 500 stocks chosen for market size, liquidity and industry group representation, among other factors by the S&P Index Committee, which is a team of analysts and economists at Standard and Poor’s. The S&P 500 is a market-value weighted index, which means each stock’s weight in the index is proportionate to its market value and is designed to be a leading indicator of U.S. equities, and meant to reflect the risk/return characteristics of the large cap universe. See www.standardandpoors.com for more information.
Information on any indices mentioned can be obtained either through your advisor or by written request to information@feg.com.
DISCLOSURES
This report was prepared by FEG (also known as Fund Evaluation Group, LLC), a federally registered investment adviser under the Investment Advisers Act of 1940, as amended, providing non-discretionary and discretionary investment advice to its clients on an individual basis. Registration as an investment adviser does not imply a certain level of skill or training. The oral and written communications of an adviser provide you with information about which you determine to hire or retain an adviser. Fund Evaluation Group, LLC, Form ADV Part 2A & 2B can be obtained by written request directly to: Fund Evaluation Group, LLC, 201 East Fifth Street, Suite 1600, Cincinnati, OH 45202, Attention: Compliance Department.
The information herein was obtained from various sources. FEG does not guarantee the accuracy or completeness of such information provided by third parties. The information in this report is given as of the date indicated and believed to be reliable. FEG assumes no obligation to update this information, or to advise on further developments relating to it. FEG, its affiliates, directors, officers, employees, employee benefit programs and client accounts may have a long position in any securities of issuers discussed in this report.
Index performance results do not represent any managed portfolio returns. An investor cannot invest directly in a presented index, as an investment vehicle replicating an index would be required. An index does not charge management fees or brokerage expenses, and no such fees or expenses were deducted from the performance shown.
Bloomberg Index Services Limited. BLOOMBERG® is a trademark and service mark of Bloomberg Finance L.P. and its affiliates (collectively “Bloomberg”). Bloomberg or Bloomberg’s licensors own all proprietary rights in the Bloomberg Indices. Bloomberg does not approve or endorse this material or guarantee the accuracy or completeness of any information herein, nor does Bloomberg make any warranty, express or implied, as to the results to be obtained therefrom, and, to the maximum extent allowed by law, Bloomberg shall not have any liability or responsibility for injury or damages arising in connection therewith.
Neither the information nor any opinion expressed in this report constitutes an offer, or an invitation to make an offer, to buy or sell any securities.
Any return expectations provided are not intended as, and must not be regarded as, a representation, warranty or predication that the investment will achieve any particular rate of return over any particular time period or that investors will not incur losses.
Past performance is not indicative of future results.
Investments in private funds are speculative, involve a high degree of risk, and are designed for sophisticated investors.
All data is as of April 30, 2023 unless otherwise noted.