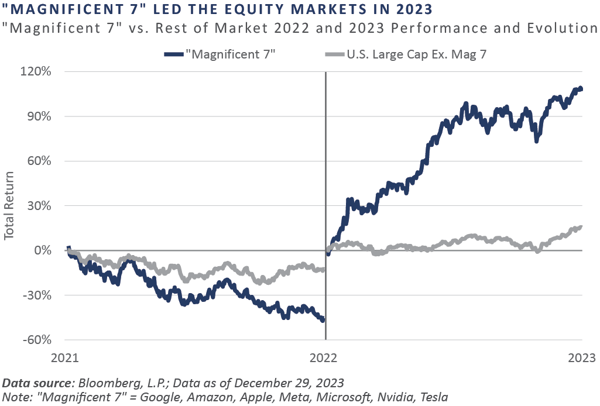
In many ways, 2023 appeared the polar opposite of 2022. The traditional 60/40 portfolio of stocks/bonds declined double digits in 2022, yet this same portfolio mix increased double digits in 2023. The "Magnificent Seven" group of Google, Amazon, Apple, Meta, Microsoft, Nvidia, and Tesla plunged 45.3% in 2022, but they more than recouped their losses in 2023, seeing a 107% total return—on an equal-weighted basis—and accounted for more than half of the S&P 500 Index’s total return for the year. What these examples point to is the capriciousness of the markets, which can have difficulty determining the fair value of a business on any given day or calendar year.
Benjamin Graham once said, "In the short run, the market is a voting machine but in the long run it is a weighing machine." Currently, the "Magnificent Seven" accounts for roughly 28% of the S&P 500 Index by market capitalization but contributes only 20% of its earnings. Ultimately, however, these values will converge as the market finds the right weight for them. Time will tell whether that is achieved by earnings increasing to catch up with the stock price or by the stock pricing falling to meet earnings.
As previously noted, 2023 was a good year for investors, and the fourth quarter was especially kind. Global equity markets, as measured by the MSCI All Country World Index, returned 11.0% for the quarter and 22.2% for 2023. Small cap stocks lagged large cap in 2023, with a return of 16.9%.1 They caught a bid in the fourth quarter, however, outperforming large cap stocks for the quarter with a return of 14.0%. Bonds, real assets, and diversifying strategies all delivered mid-single-digit returns for the quarter and the year, with the Bloomberg U.S. Aggregate Bond, S&P Real Assets Equity, and HFRX Global Hedge Indices posting returns of 5.5%, 7.3%, and 3.1%, respectively, in 2023.
1 Russell 2000 Index
KEY MARKET THEMES AND DEVELOPMENTS
Investors Taken for a Wild Ride in 2023 with a Potential Fed Pivot on the Horizon
Following the tumultuous market environment of 2022, in which the Federal Reserve’s (Fed) quest to restore price stability sent ripples throughout the financial markets, 2023 brought a reversal of fortune, with a looming Fed policy pivot coming closer into focus. Supporting this growing sentiment for a less-restrictive Fed posture was the seemingly goldilocks economic backdrop, marked by a disinflationary bias, solid economic growth, a stable labor market, a recent drop in interest rates, and an "everything rally" of robust performance across asset classes during the year.
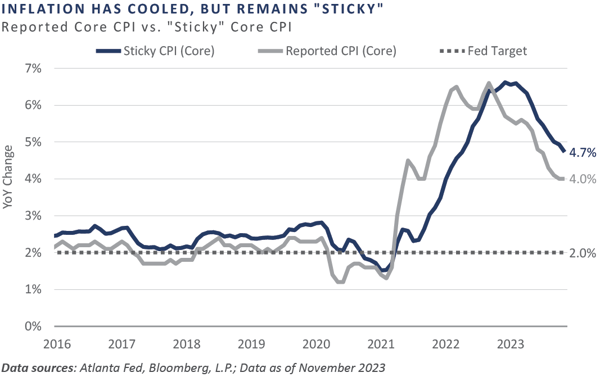
On the inflationary front, after peaking at an annual rate of 9.1% in June 2022, headline consumer price index (CPI) inflation has cooled to a 3.1% pace through November 2023. Core inflation, a more relevant gauge in the eyes of the Fed, has shown a similar disinflationary trend, yet remains elevated versus the Fed’s 2% target at a 4% annual rate through November. It is worth keeping an eye on the persistence or "stickiness" of core cost pressures, as the Atlanta Fed’s proxy for sticky inflation is reflecting a rate of 4.7%. While a significant down payment has been made on slowing inflation’s advance, only time will tell if the Fed’s job is complete.
With the worst of the inflationary pressures appearing in the rearview mirror—and thus the need for further monetary tightening presumably unwarranted—market participants have become slightly more comfortable with moving further along the maturity/duration curve.
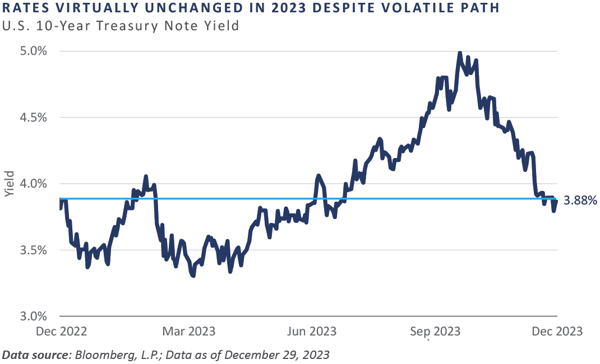
Throughout 2023, the yield on the benchmark 10-Year U.S. Treasury Note traded in a range of 168 bps, with a low of 3.31% reached on April 6 and a high of 4.99% on October 19. Despite this volatile path, the Treasury rally over the last 10 weeks of 2023 resulted in an unchanged yield on the 10-Year Treasury Note on a year-over-year basis.
The duration rally over the final two-and-a-half months of the year was so pronounced that the Bloomberg U.S. Aggregate Bond Index climbed an astonishing 8.9% from October 18 through year-end. Despite appearing on the verge of posting an unprecedented third consecutive calendar year decline, this rally lifted the core bond benchmark to a year-to-date (YTD) return of 5.5%.
Across the global equity markets, the prevailing theme throughout the year included a dynamic that equity investors have grown accustomed to in recent years: U.S. equities outperforming non-U.S. equities, large cap outperforming small cap, and growth outperforming value. Additionally, as discussed earlier, the narrow leadership displayed by the darling U.S. mega-cap tech stocks, the "Magnificent 7," returned more than 100% in 2023 on an equal-weighted basis and clawed back 2022’s losses and then some.
For private equity, 2023 was a return to normalcy. Given the typical lags in performance and valuations relative to the public markets, those investors with more dollars allocated to private equity generated better returns in 2022 versus those with a public market bias. FEG believes the reverse will likely be true for 2023, as public markets roared back and private equity returns, on average, trailed public markets.
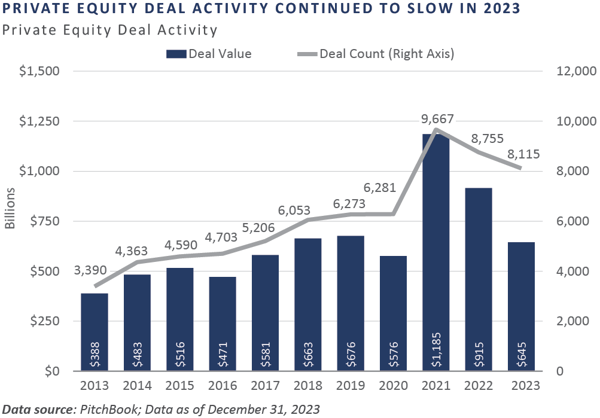
Private market valuations, particularly in the technology sector, reset to more normalized levels in 2023—similar to what public markets experienced in 2022, with the notable exception of AI-related companies. Sentiment returned to capital efficiency and profitable growth rather than the grow at all costs. Capital markets pulled back as fundraising and exits were muted. New investments slowed as managers focused on existing portfolio companies, as shown in the new investment deal activity graph for U.S. private equity.
Underpinning the almost everything rally witnessed in the fourth quarter—save commodity futures and Chinese equities—was a significant easing in the bond market’s expectation for Fed policy in 2024. This was most pronounced during the fourth quarter as Fed funds futures prices implied 75 basis points of cuts for 2024 at the beginning of the quarter, which jumped to 150 basis points of cuts by the end of the quarter.
At their mid-December policy meeting, the Federal Open Market Committee (FOMC) provided a subtle confirmation of the bond market’s discounted easing path, with Chairman Powell stating the committee is actively debating on reversing the current monetary restraint, noting:
"…the question of when will it become appropriate to begin dialing back the amount of policy restraint in place, that, that begins to come into view and is clearly a discussion—topic of discussion out in the world and also a discussion for us at our meeting today."
— FOMC Chairman Jerome Powell Press Conference – December 13, 2023
In the vein of the topic of this letter, What a Difference a Year Makes, "what a difference less than two weeks makes" is an apropos statement for Powell’s 180-degree pivot in the first two weeks of December. At a fireside chat at Spelman College on December 1, Chairman Powell proclaimed,
"It would be premature to… speculate on when policy might ease."
— FOMC Chairman Jerome Powell at a fireside chat with Spelman College President
Helene Gayle, Spelman College, Atlanta, Georgia – December 1, 2023
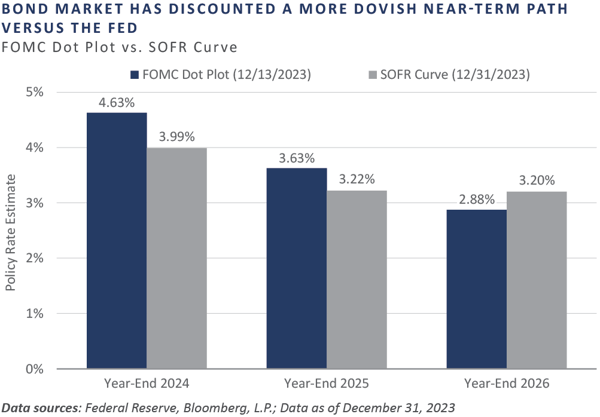
The Chairman’s nod to the near-term easing bias was corroborated by the Fed’s updated "dot plot" projections from their December 12-13 meeting of the appropriate policy rate level in the coming years, which point to 75 bps of easing in 2024. Still, despite the Fed’s dovish revisions, the bond market has assumed an even greater dovish path for the policy rate through 2024 and 2025, and FEG believes the potential reconciliation of this disparity will likely serve as a volatility-inducing catalyst throughout the upcoming year.
On the business cycle front, the U.S. economic engine hummed proudly in 2023, throwing cold water on the widely held notion the economy was on the verge of succumbing to the classic recessionary warning signs which were evident entering the year. These included a persistent inversion of the Treasury yield curve, a manufacturing base mired in contraction, a rolling over of leading economic indicators, and a stalling of the pace of labor market improvement, to name a few.
The resilience of the U.S. economy was punctuated by a notably solid third quarter growth reading, as real gross domestic product (GDP) expanded at a 4.9 percentage point annualized pace during the quarter, the strongest quarterly print since fourth quarter 2021. It is possible the lags typically associated with recessionary warning signs are either impaired or flat out broken during this particular cycle, given the distortions created by the global pandemic and the subsequent ripple effects.
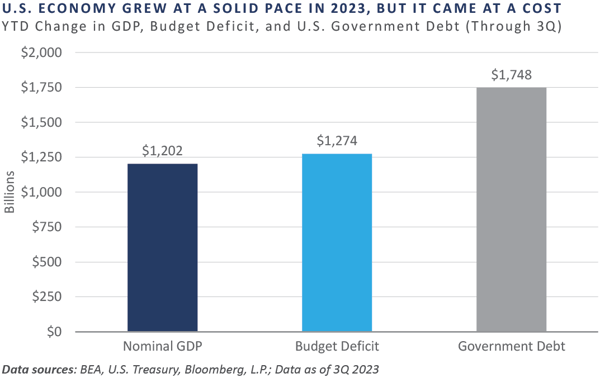
Year-to-date through the third quarter—the latest update to GDP—nominal GDP had increased an impressive $1.2 trillion, from $26.41 trillion at the end of 2022 to $27.61 trillion as of the third quarter 2023. Unfortunately, this economic gain came at the expense of digging an even deeper fiscal hole, as the Treasury budget deficit widened by nearly $1.3 trillion, and the government debt burden ballooned by more than $1.7 trillion. These two are, of course, related.
REFLECTIONS AND OUTLOOK
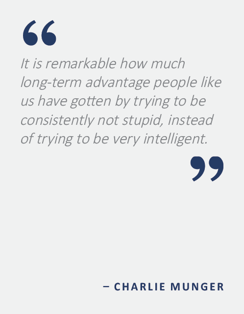 Another notable event of the quarter was the passing of Charlie Munger, one of the world’s greatest thinkers, investors, and human beings. At 99 years of age, Charlie left a legacy of a life well-lived, as well as numerous nuggets of wisdom for investors to follow whenever in doubt of what to do in a challenging market.
With Charlie’s advice in mind, FEG continues to believe that long-term investors’ strategic asset allocation postures should embrace risk and own as much risk (stocks) and illiquidity (private capital) as is prudently acceptable for their unique portfolio objectives. Tactically and within investment policy statement (IPS) parameters, FEG is not making any significant opportunistic moves and is hanging close to IPS targets in the current environment following numerous portfolio shifts throughout 2023 that emphasized an increase in overall portfolio quality. On one hand, risk premiums offered by equity, credit, and real assets do not seem to warrant loading up on risk at this point in the cycle. On the other hand, the Fed seems ready and willing to begin easing and cutting rates in 2024, the economy continues to grow—albeit at a moderate pace—and corporate earnings have been remarkably stable.
Within private markets, the coming years could offer more attractive valuations. If the fundraising market remains muted, FEG expects to see a decline in the number of active private equity funds as some groups struggle to raise capital. Those funds that remain could face reduced competition and less capital in the market. Using history as a reference point, the vintage years during softer fundraising environments have proved to be strong performing years in general. Thus, FEG believes long-term investors should benefit from the pullback in the market as rationality returns.
Although not every decision will always be right, in following Charlie's advice to not be "stupid," FEG has developed a disciplined process that FEG believes should help ensure that, on average, the outcomes that follow will be favorable. More to the point, the firm makes a point to heed Charlie's advice and "choose clients as you would friends," doing the right things, working hard, and trusting the process, so that our clients can reap rewards over the long term.
DISCLOSURES
This report was prepared by FEG (also known as Fund Evaluation Group, LLC), a federally registered investment adviser under the Investment Advisers Act of 1940, as amended, providing non-discretionary and discretionary investment advice to its clients on an individual basis. Registration as an investment adviser does not imply a certain level of skill or training. The oral and written communications of an adviser provide you with information about which you determine to hire or retain an adviser. Fund Evaluation Group, LLC, Form ADV Part 2A & 2B can be obtained by written request directly to: Fund Evaluation Group, LLC, 201 East Fifth Street, Suite 1600, Cincinnati, OH 45202, Attention: Compliance Department.
The information herein was obtained from various sources. FEG does not guarantee the accuracy or completeness of such information provided by third parties. The information in this report is given as of the date indicated and believed to be reliable. FEG assumes no obligation to update this information, or to advise on further developments relating to it. FEG, its affiliates, directors, officers, employees, employee benefit programs and client accounts may have a long position in any securities of issuers discussed in this report.
Bloomberg Index Services Limited. BLOOMBERG® is a trademark and service mark of Bloomberg Finance L.P. and its affiliates (collectively “Bloomberg”). Bloomberg or Bloomberg’s licensors own all proprietary rights in the Bloomberg Indices. Bloomberg does not approve or endorse this material or guarantee the accuracy or completeness of any information herein, nor does Bloomberg make any warranty, express or implied, as to the results to be obtained therefrom, and, to the maximum extent allowed by law, Bloomberg shall not have any liability or responsibility for injury or damages arising in connection therewith
Index performance results do not represent any managed portfolio returns. An investor cannot invest directly in a presented index, as an investment vehicle replicating an index would be required. An index does not charge management fees or brokerage expenses, and no such fees or expenses were deducted from the performance shown.
The Chartered Financial Analyst® (CFA) designation is a professional certification issued by the CFA Institute to qualified financial analysts who: (i) have a bachelor’s degree and four years of professional experience involving investment decision making or four years of qualified work experience[full time, but not necessarily investment related]; (ii) complete a self‐study program (250 hours of study for each of the three levels); (iii) successfully complete a series of three six‐hour exams; and (iv) pledge to adhere to the CFA Institute Code of Ethics and Standards of Professional Conduct.
The Chartered Alternative Investment Analyst Association® is an independent, not‐for‐profit global organization committed to education and professionalism in the field of alternative investments. Founded in 2002, the CAIA Association is the sponsoring body for the CAIA designation. Recognized globally, the designation certifies one's mastery of the concepts, tools and practices essential for understanding alternative investments and promotes adherence to high standards of professional conduct.
Neither the information nor any opinion expressed in this report constitutes an offer, or an invitation to make an offer, to buy or sell any securities.
Any return expectations provided are not intended as, and must not be regarded as, a representation, warranty or predication that the investment will achieve any particular rate of return over any particular time period or that investors will not incur losses.
Diversification or Asset Allocation does not assure or guarantee better performance and cannot eliminate the risk of investment loss.
Past performance is not indicative of future results.
This blog is prepared for informational purposes only. It does not address specific investment objectives, or the financial situation and the particular needs of any person who may receive this report.
INDICES
The Alerian MLP Index is a composite of the 50 most prominent energy Master Limited Partnerships that provides investors with an unbiased, comprehensive benchmark for this emerging asset class.
The HFRI Monthly Indices (HFRI) are equally weighted performance indexes, compiled by Hedge Fund Research Inc., and are utilized by numerous hedge fund managers as a benchmark for their own hedge funds. The HFRI are broken down into 37 different categories by strategy, including the HFRI Fund Weighted Composite, which accounts for over 2000 funds listed on the internal HFR Database. The HFRI Fund of Funds Composite Index is an equal weighted, net of fee, index composed of approximately 800 fund of funds which report to HFR. See www.hedgefundresearch.com for more information on index construction.
The MSCI ACWI (All Country World Index) Index is a free float-adjusted market capitalization weighted index that is designed to measure the equity market performance of developed and emerging markets. The MSCI ACWI consists of 47 country indexes comprising 23 developed and 24 emerging market country indexes. The developed market country indexes included are: Australia, Austria, Belgium, Canada, Denmark, Finland, France, Germany, Hong Kong, Ireland, Israel, Italy, Japan, Netherlands, New Zealand, Norway, Portugal, Singapore, Spain, Sweden, Switzerland, the United Kingdom and the United States. The emerging market country indexes included are: Brazil, Chile, China, Colombia, Czech Republic, Egypt, Greece, Hungary, India, Indonesia, Korea, Kuwait, Malaysia, Mexico, Peru, Philippines, Poland, Qatar,Saudi Arabia, South Africa, Taiwan, Thailand, Turkey, and United Arab Emirates.
The S&P 500 Index is a capitalization-weighted index of 500 stocks. The S&P 500 Index is designed to measure performance of the broad domestic economy through changes in the aggregate market value of 500 stocks representing all major industries.
Information on any indices mentioned can be obtained either through your advisor or by written request to information@feg.com.
Advisors
Latest Publication
Private Giants on the Public Stage: Assessing the Coming Wave of Mega IPOs
In Brief The next wave of mega IPOs could be constructive over the long run, but disruptive in the near term as investor...
Latest Publication
Private Giants on the Public Stage: Assessing the Coming Wave of Mega IPOs
In Brief The next wave of mega IPOs could be constructive over the long run, but disruptive in the near term as investor...
Latest Podcast
Infrastructure for Intelligence: A Conversation with Blue Owl
Exploring the private capital powering AI-era digital infrastructure at global scale.
Market Perspectives
Private Giants on the Public Stage: Assessing the Coming Wave of Mega IPOs
Portfolio Insights
First Quarter 2026: Trump Card Played
Market Perspectives
When Diversification Is Tested: The Opportunity for Hedge Funds in a Dispersed Market
Industry Perspectives
Structuring and Governing EMF Programs: A Four-Step Framework
Fourth Quarter 2023 Market Commentary: What a Difference a Year Makes
In many ways, 2023 appeared the polar opposite of 2022. The traditional 60/40 portfolio of stocks/bonds declined double digits in 2022, yet this same portfolio mix increased double digits in 2023. The "Magnificent Seven" group of Google, Amazon, Apple, Meta, Microsoft, Nvidia, and Tesla plunged 45.3% in 2022, but they more than recouped their losses in 2023, seeing a 107% total return—on an equal-weighted basis—and accounted for more than half of the S&P 500 Index’s total return for the year. What these examples point to is the capriciousness of the markets, which can have difficulty determining the fair value of a business on any given day or calendar year.
Benjamin Graham once said, "In the short run, the market is a voting machine but in the long run it is a weighing machine." Currently, the "Magnificent Seven" accounts for roughly 28% of the S&P 500 Index by market capitalization but contributes only 20% of its earnings. Ultimately, however, these values will converge as the market finds the right weight for them. Time will tell whether that is achieved by earnings increasing to catch up with the stock price or by the stock pricing falling to meet earnings.
As previously noted, 2023 was a good year for investors, and the fourth quarter was especially kind. Global equity markets, as measured by the MSCI All Country World Index, returned 11.0% for the quarter and 22.2% for 2023. Small cap stocks lagged large cap in 2023, with a return of 16.9%.1 They caught a bid in the fourth quarter, however, outperforming large cap stocks for the quarter with a return of 14.0%. Bonds, real assets, and diversifying strategies all delivered mid-single-digit returns for the quarter and the year, with the Bloomberg U.S. Aggregate Bond, S&P Real Assets Equity, and HFRX Global Hedge Indices posting returns of 5.5%, 7.3%, and 3.1%, respectively, in 2023.
1 Russell 2000 Index
KEY MARKET THEMES AND DEVELOPMENTS
Investors Taken for a Wild Ride in 2023 with a Potential Fed Pivot on the Horizon
Following the tumultuous market environment of 2022, in which the Federal Reserve’s (Fed) quest to restore price stability sent ripples throughout the financial markets, 2023 brought a reversal of fortune, with a looming Fed policy pivot coming closer into focus. Supporting this growing sentiment for a less-restrictive Fed posture was the seemingly goldilocks economic backdrop, marked by a disinflationary bias, solid economic growth, a stable labor market, a recent drop in interest rates, and an "everything rally" of robust performance across asset classes during the year.
On the inflationary front, after peaking at an annual rate of 9.1% in June 2022, headline consumer price index (CPI) inflation has cooled to a 3.1% pace through November 2023. Core inflation, a more relevant gauge in the eyes of the Fed, has shown a similar disinflationary trend, yet remains elevated versus the Fed’s 2% target at a 4% annual rate through November. It is worth keeping an eye on the persistence or "stickiness" of core cost pressures, as the Atlanta Fed’s proxy for sticky inflation is reflecting a rate of 4.7%. While a significant down payment has been made on slowing inflation’s advance, only time will tell if the Fed’s job is complete.
With the worst of the inflationary pressures appearing in the rearview mirror—and thus the need for further monetary tightening presumably unwarranted—market participants have become slightly more comfortable with moving further along the maturity/duration curve.
Throughout 2023, the yield on the benchmark 10-Year U.S. Treasury Note traded in a range of 168 bps, with a low of 3.31% reached on April 6 and a high of 4.99% on October 19. Despite this volatile path, the Treasury rally over the last 10 weeks of 2023 resulted in an unchanged yield on the 10-Year Treasury Note on a year-over-year basis.
The duration rally over the final two-and-a-half months of the year was so pronounced that the Bloomberg U.S. Aggregate Bond Index climbed an astonishing 8.9% from October 18 through year-end. Despite appearing on the verge of posting an unprecedented third consecutive calendar year decline, this rally lifted the core bond benchmark to a year-to-date (YTD) return of 5.5%.
Across the global equity markets, the prevailing theme throughout the year included a dynamic that equity investors have grown accustomed to in recent years: U.S. equities outperforming non-U.S. equities, large cap outperforming small cap, and growth outperforming value. Additionally, as discussed earlier, the narrow leadership displayed by the darling U.S. mega-cap tech stocks, the "Magnificent 7," returned more than 100% in 2023 on an equal-weighted basis and clawed back 2022’s losses and then some.
For private equity, 2023 was a return to normalcy. Given the typical lags in performance and valuations relative to the public markets, those investors with more dollars allocated to private equity generated better returns in 2022 versus those with a public market bias. FEG believes the reverse will likely be true for 2023, as public markets roared back and private equity returns, on average, trailed public markets.
Private market valuations, particularly in the technology sector, reset to more normalized levels in 2023—similar to what public markets experienced in 2022, with the notable exception of AI-related companies. Sentiment returned to capital efficiency and profitable growth rather than the grow at all costs. Capital markets pulled back as fundraising and exits were muted. New investments slowed as managers focused on existing portfolio companies, as shown in the new investment deal activity graph for U.S. private equity.
Underpinning the almost everything rally witnessed in the fourth quarter—save commodity futures and Chinese equities—was a significant easing in the bond market’s expectation for Fed policy in 2024. This was most pronounced during the fourth quarter as Fed funds futures prices implied 75 basis points of cuts for 2024 at the beginning of the quarter, which jumped to 150 basis points of cuts by the end of the quarter.
At their mid-December policy meeting, the Federal Open Market Committee (FOMC) provided a subtle confirmation of the bond market’s discounted easing path, with Chairman Powell stating the committee is actively debating on reversing the current monetary restraint, noting:
"…the question of when will it become appropriate to begin dialing back the amount of policy restraint in place, that, that begins to come into view and is clearly a discussion—topic of discussion out in the world and also a discussion for us at our meeting today."
— FOMC Chairman Jerome Powell Press Conference – December 13, 2023
In the vein of the topic of this letter, What a Difference a Year Makes, "what a difference less than two weeks makes" is an apropos statement for Powell’s 180-degree pivot in the first two weeks of December. At a fireside chat at Spelman College on December 1, Chairman Powell proclaimed,
"It would be premature to… speculate on when policy might ease."
— FOMC Chairman Jerome Powell at a fireside chat with Spelman College President
Helene Gayle, Spelman College, Atlanta, Georgia – December 1, 2023
The Chairman’s nod to the near-term easing bias was corroborated by the Fed’s updated "dot plot" projections from their December 12-13 meeting of the appropriate policy rate level in the coming years, which point to 75 bps of easing in 2024. Still, despite the Fed’s dovish revisions, the bond market has assumed an even greater dovish path for the policy rate through 2024 and 2025, and FEG believes the potential reconciliation of this disparity will likely serve as a volatility-inducing catalyst throughout the upcoming year.
On the business cycle front, the U.S. economic engine hummed proudly in 2023, throwing cold water on the widely held notion the economy was on the verge of succumbing to the classic recessionary warning signs which were evident entering the year. These included a persistent inversion of the Treasury yield curve, a manufacturing base mired in contraction, a rolling over of leading economic indicators, and a stalling of the pace of labor market improvement, to name a few.
The resilience of the U.S. economy was punctuated by a notably solid third quarter growth reading, as real gross domestic product (GDP) expanded at a 4.9 percentage point annualized pace during the quarter, the strongest quarterly print since fourth quarter 2021. It is possible the lags typically associated with recessionary warning signs are either impaired or flat out broken during this particular cycle, given the distortions created by the global pandemic and the subsequent ripple effects.
Year-to-date through the third quarter—the latest update to GDP—nominal GDP had increased an impressive $1.2 trillion, from $26.41 trillion at the end of 2022 to $27.61 trillion as of the third quarter 2023. Unfortunately, this economic gain came at the expense of digging an even deeper fiscal hole, as the Treasury budget deficit widened by nearly $1.3 trillion, and the government debt burden ballooned by more than $1.7 trillion. These two are, of course, related.
REFLECTIONS AND OUTLOOK
With Charlie’s advice in mind, FEG continues to believe that long-term investors’ strategic asset allocation postures should embrace risk and own as much risk (stocks) and illiquidity (private capital) as is prudently acceptable for their unique portfolio objectives. Tactically and within investment policy statement (IPS) parameters, FEG is not making any significant opportunistic moves and is hanging close to IPS targets in the current environment following numerous portfolio shifts throughout 2023 that emphasized an increase in overall portfolio quality. On one hand, risk premiums offered by equity, credit, and real assets do not seem to warrant loading up on risk at this point in the cycle. On the other hand, the Fed seems ready and willing to begin easing and cutting rates in 2024, the economy continues to grow—albeit at a moderate pace—and corporate earnings have been remarkably stable.
Within private markets, the coming years could offer more attractive valuations. If the fundraising market remains muted, FEG expects to see a decline in the number of active private equity funds as some groups struggle to raise capital. Those funds that remain could face reduced competition and less capital in the market. Using history as a reference point, the vintage years during softer fundraising environments have proved to be strong performing years in general. Thus, FEG believes long-term investors should benefit from the pullback in the market as rationality returns.
Although not every decision will always be right, in following Charlie's advice to not be "stupid," FEG has developed a disciplined process that FEG believes should help ensure that, on average, the outcomes that follow will be favorable. More to the point, the firm makes a point to heed Charlie's advice and "choose clients as you would friends," doing the right things, working hard, and trusting the process, so that our clients can reap rewards over the long term.
DISCLOSURES
This report was prepared by FEG (also known as Fund Evaluation Group, LLC), a federally registered investment adviser under the Investment Advisers Act of 1940, as amended, providing non-discretionary and discretionary investment advice to its clients on an individual basis. Registration as an investment adviser does not imply a certain level of skill or training. The oral and written communications of an adviser provide you with information about which you determine to hire or retain an adviser. Fund Evaluation Group, LLC, Form ADV Part 2A & 2B can be obtained by written request directly to: Fund Evaluation Group, LLC, 201 East Fifth Street, Suite 1600, Cincinnati, OH 45202, Attention: Compliance Department.
The information herein was obtained from various sources. FEG does not guarantee the accuracy or completeness of such information provided by third parties. The information in this report is given as of the date indicated and believed to be reliable. FEG assumes no obligation to update this information, or to advise on further developments relating to it. FEG, its affiliates, directors, officers, employees, employee benefit programs and client accounts may have a long position in any securities of issuers discussed in this report.
Bloomberg Index Services Limited. BLOOMBERG® is a trademark and service mark of Bloomberg Finance L.P. and its affiliates (collectively “Bloomberg”). Bloomberg or Bloomberg’s licensors own all proprietary rights in the Bloomberg Indices. Bloomberg does not approve or endorse this material or guarantee the accuracy or completeness of any information herein, nor does Bloomberg make any warranty, express or implied, as to the results to be obtained therefrom, and, to the maximum extent allowed by law, Bloomberg shall not have any liability or responsibility for injury or damages arising in connection therewith
Index performance results do not represent any managed portfolio returns. An investor cannot invest directly in a presented index, as an investment vehicle replicating an index would be required. An index does not charge management fees or brokerage expenses, and no such fees or expenses were deducted from the performance shown.
The Chartered Financial Analyst® (CFA) designation is a professional certification issued by the CFA Institute to qualified financial analysts who: (i) have a bachelor’s degree and four years of professional experience involving investment decision making or four years of qualified work experience[full time, but not necessarily investment related]; (ii) complete a self‐study program (250 hours of study for each of the three levels); (iii) successfully complete a series of three six‐hour exams; and (iv) pledge to adhere to the CFA Institute Code of Ethics and Standards of Professional Conduct.
The Chartered Alternative Investment Analyst Association® is an independent, not‐for‐profit global organization committed to education and professionalism in the field of alternative investments. Founded in 2002, the CAIA Association is the sponsoring body for the CAIA designation. Recognized globally, the designation certifies one's mastery of the concepts, tools and practices essential for understanding alternative investments and promotes adherence to high standards of professional conduct.
Neither the information nor any opinion expressed in this report constitutes an offer, or an invitation to make an offer, to buy or sell any securities.
Any return expectations provided are not intended as, and must not be regarded as, a representation, warranty or predication that the investment will achieve any particular rate of return over any particular time period or that investors will not incur losses.
Diversification or Asset Allocation does not assure or guarantee better performance and cannot eliminate the risk of investment loss.
Past performance is not indicative of future results.
This blog is prepared for informational purposes only. It does not address specific investment objectives, or the financial situation and the particular needs of any person who may receive this report.
INDICES
The Alerian MLP Index is a composite of the 50 most prominent energy Master Limited Partnerships that provides investors with an unbiased, comprehensive benchmark for this emerging asset class.
The HFRI Monthly Indices (HFRI) are equally weighted performance indexes, compiled by Hedge Fund Research Inc., and are utilized by numerous hedge fund managers as a benchmark for their own hedge funds. The HFRI are broken down into 37 different categories by strategy, including the HFRI Fund Weighted Composite, which accounts for over 2000 funds listed on the internal HFR Database. The HFRI Fund of Funds Composite Index is an equal weighted, net of fee, index composed of approximately 800 fund of funds which report to HFR. See www.hedgefundresearch.com for more information on index construction.
The MSCI ACWI (All Country World Index) Index is a free float-adjusted market capitalization weighted index that is designed to measure the equity market performance of developed and emerging markets. The MSCI ACWI consists of 47 country indexes comprising 23 developed and 24 emerging market country indexes. The developed market country indexes included are: Australia, Austria, Belgium, Canada, Denmark, Finland, France, Germany, Hong Kong, Ireland, Israel, Italy, Japan, Netherlands, New Zealand, Norway, Portugal, Singapore, Spain, Sweden, Switzerland, the United Kingdom and the United States. The emerging market country indexes included are: Brazil, Chile, China, Colombia, Czech Republic, Egypt, Greece, Hungary, India, Indonesia, Korea, Kuwait, Malaysia, Mexico, Peru, Philippines, Poland, Qatar,Saudi Arabia, South Africa, Taiwan, Thailand, Turkey, and United Arab Emirates.
The S&P 500 Index is a capitalization-weighted index of 500 stocks. The S&P 500 Index is designed to measure performance of the broad domestic economy through changes in the aggregate market value of 500 stocks representing all major industries.
Information on any indices mentioned can be obtained either through your advisor or by written request to information@feg.com.
Authors
Nolan Bean
Disclosures
This information is prepared for informational purposes only. It does not address specific investment objectives, or the financial situation and the particular needs of any person who may receive this presentation. Neither the information nor any opinion expressed in this report constitutes an offer, or an invitation to make an offer, to buy or sell any securities.
The information herein was obtained from various sources. FEG does not guarantee the accuracy or completeness of such information provided by third parties. The information in this presentation is given as of the date indicated and believed to be reliable. FEG assumes no obligation to update this information, or to advise on further developments relating to it.