The stock market started the year with a bang. In keeping with the Taylor Swift song Shake It Off, the market has remained unbothered by potential external signs of instability and has continued to march higher. Swift released the song as the lead single on her fifth album in the fall of 2014. Nearly a decade later, the artist’s popularity and net worth have grown exponentially, as have the gains for many investors that remained long the stock market over the same period.
While it is true that the market brushed off areas of concern to reach new highs, it is also true that investors have fundamental reasons to remain optimistic. Earnings growth estimates for the S&P 500 Index are in the low double digits for 2024, operating margins are expanding, and corporate CFO optimism about the economy is increasing. On the flip slide, insider selling by management teams has increased to a level similar to 2022, often a sign corporate management teams believe their stock price is fully valued, if not overvalued.
Global equity markets, as measured by the MSCI All Country World Index, returned 8.2% in the first quarter. In a familiar tune for investors, U.S. stocks outperformed non-U.S. stocks, large cap bested small cap, and growth topped value. Unlike equities, however, other asset classes struggled in the quarter. Bonds and real assets were both slightly negative, with the Bloomberg U.S. Aggregate Bond Index and S&P Real Assets Equity Index posting returns of -0.8% and -0.1%, respectively. Lastly, diversifying strategies were in the black, with the HFRX Global Hedge Fund Index generating a quarterly return of 2.5%.
KEY MARKET THEMES AND DEVELOPMENTS
U.S. Stock Market Exuberance Humbles Naysayers Despite a Swelling List of Concerns
The multi-year theme of robust U.S. financial market performance—both absolute and relative—remained in place through the first quarter of 2024 despite a growing number of factors which, in isolation, should broadcast caution to risk-takers. Examples of these perceived headwinds include elevated valuations across both stock and credit markets, a highly uncertain near-term path of Federal Reserve (Fed) monetary policy, stubbornly elevated inflation rates, ongoing conflicts in eastern Europe—and more recently the Red Sea—and a U.S. fiscal situation which appears highly unsustainable.
Nevertheless, the U.S. equity market marched higher in the first three months of the year, propelling the S&P 500 Index to its highest price and total return index level on record, with gains of 10.2% and 10.6%, respectively. The strong bid for U.S.-based risk exposure was not confined to the equity markets during the quarter, as credit risk premiums narrowed to the lowest level since early 2022, a time when the Fed was initiating the monetary tightening process.
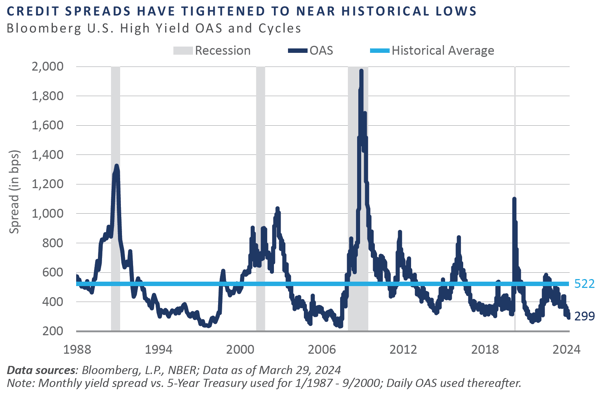
On a spread basis, U.S. high yield bond risk premiums tightened to a sub-300 basis point (bp) level, placing this variable in the fourth percentile of observations dating back to the late 1980s. Often viewed as a leading cyclical indicator of the business cycle, the current subdued level of risk compensation assumed by high yield investors reflects supportive credit conditions, significant investor demand for credit risk, and little-to-no worry for a near-term economic downturn.
However, given the Fed’s purchases of high yield bonds during the COVID-19 pandemic as they tiptoed outside the confines of the 1913 Federal Reserve Act, the usefulness of this gauge has potentially been tainted. This is similar to the slope of the Treasury yield curve, which has remained inverted for two full years—as reflected by the spread between 2 and 10-Year Treasury Notes—thanks to the Fed’s interventionist asset purchase policies since the 2008-2009 Global Financial Crisis.
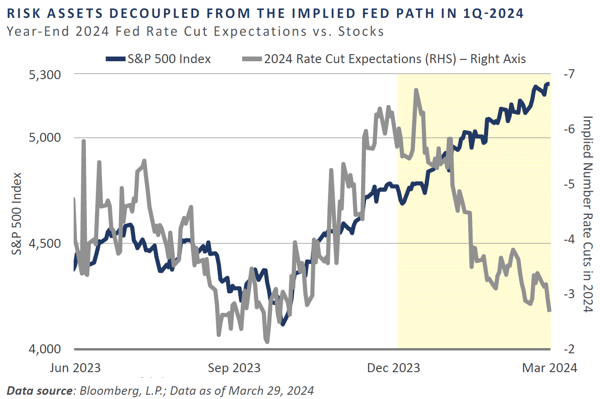
The combination of sticky inflation and a resilient U.S. economy helped prompt a convergence between the bond market’s discounted path of Fed easing and that of the Fed through their Summary of Economic Projections “Dot Plot” table in the first quarter. In prior quarters, the general trend of the equity market ebbed and flowed in response to the implied near-term path of Fed policy. That is, increasing expectations for Fed rate cuts served as a tailwind behind risk assets and vice versa. This relationship seems to have decoupled in recent months, however, as the equity market has powered through reduced rate cut expectations.
At the beginning of the year, the fed funds futures market had discounted nearly seven 25 basis point rate cuts throughout 2024. By the end of the quarter, this expectation had narrowed to just three implied cuts, bringing the implied path in line with the path first laid out by the Fed in December 2023 and later reaffirmed at the March 2024 policy meeting. Surprisingly, stocks seemed unaffected by this convergence.
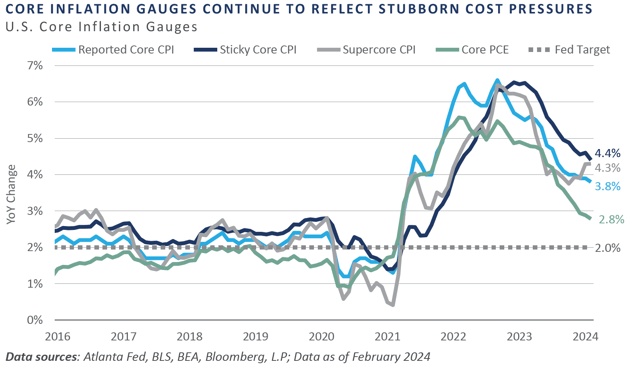
Central to the narrowing of the implied path of Fed easing in recent months is that realized inflation rates, in aggregate, have been slow to return to the Fed’s 2% targeted level. Many of the widely reported inflation indicators have faced resistance in recent months, with several hovering in the 3-4% range. While the general direction appears to favor the disinflationary bias that has been in place since 2023, the combination of a 5.50% federal funds rate and approximately $90 billion per month of quantitative tightening has not done the trick yet.
Nearly every inflation series is sending the same message: “sticky,” “supercore”—i.e., core services inflation excluding housing—and the Fed’s go-to measure of core personal consumption expenditure inflation all remain above mandate. Supercore inflation specifically has exhibited a reaccelerating bias since third quarter 2023.
Interestingly, despite inflation running above mandate and the establishment of record high prices across U.S. large cap stocks, bitcoin, and gold during the quarter, the Fed did not dial back their assessment for the appropriate number of rate cuts for 2024 at their March policy meeting. The Federal Open Market Committee (FOMC) update to the Fed’s dot plot again reflected three 25 basis point rate cuts on the table by the end of the year, an unchanged stance from the prior dot plot in December 2023.
While always a critical variable in assessing the likely path of near-term monetary policy, incoming inflationary data will be of particular focus in the coming months, as market participants seek to sniff out any potential deviation in the Fed’s plans to begin slowly reducing borrowing costs. Should inflation continue to surprise to the upside, a near-term easing in policy will likely be delayed, in turn placing a tailwind behind the recent rise in Treasury interest rates. Equity markets would then be in a tug of war, as higher rates are typically a headwind on valuations, while economic growth and subsequent earnings growth are a tailwind.
Although the public markets have shaken off most of their risks to move forward, private equity markets are moving slower to shake off the excesses experienced during the post-COVID bubble. Fundraising remains well off peak levels, and investment and exit activity have been muted in 2024. There is still a valuation gap between buyer and seller price expectations, though the gap is narrowing. The lack of liquidity is a meaningful hurdle for the private equity market to become more active. The acquisition market has been heavily affected by the valuation expectation gap. Private equity funds raised during the peak fundraising period of 2020-2022 have a ticking clock on their investment periods, which suggests that capital deployment will increase over the next one to three years. On the IPO front, a few select companies have begun testing the waters following the drought in 2023. Their after-market performance will be closely watched as firms seek signals for future IPOs.
One trend to watch is the use of secondary funds and continuation vehicles as managers seek alternative solutions for liquidity. According to Bain & Company, the unrealized value held by buyout funds has reached record highs and is 4x the value witnessed during the Global Financial Crisis. At the end of 2023, there were approximately 28,000 companies valued at $3.2 trillion held by buyout funds. If the limited exit environment continues, investors should expect to see more creative solutions from GPs and the secondary market. The use of continuation funds with capital from the secondary market could ramp up as GPs get capital back to LPs. The room for growth of secondary transactions is meaningful, as secondary transactions provide about $120 billion of liquidity for an industry with over $3 trillion in net asset value. Additionally, dry powder in larger buyout funds is an option for smaller funds to exit portfolio companies to other sponsors.
Strong and Resilient U.S. Economy for Now
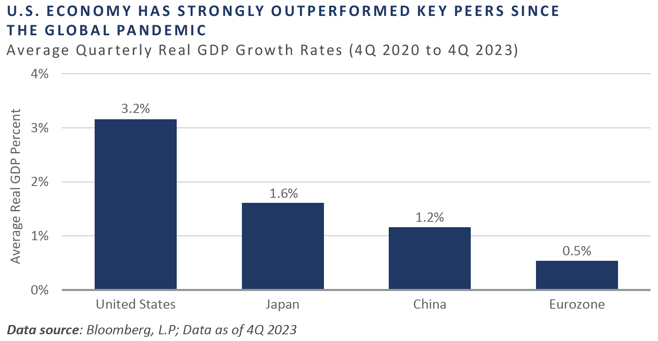
The U.S. economy has displayed remarkable resiliency. A cursory review of inflation-adjusted quarterly growth rates confirms this strength, particularly when viewed relative to key trading partners such as Japan, China, and the eurozone. Since the fourth quarter of 2020—a start that was chosen to eliminate the base effects that stemmed from the COVID-19 pandemic—through the fourth quarter of 2023, quarterly inflation-adjusted real GDP growth has averaged an impressive 3.2% in the U.S, easily besting Japan (+1.6%), China (+1.2%), and the eurozone (+0.5%).
Moreover, the impressive average annualized quarterly growth of the U.S. economy has occurred despite a number of historically reliable recessionary indicators pointing to a looming downturn. For example, the U.S. term structure has remained inverted for two full years, growth rates across the Conference Board’s set of leading economic indicators have indicated recessionary pressures for the past 18 months, and the manufacturing base has been mired in contraction since October 2022. And the labor market, while seemingly strong on the surface, has exhibited some early warning signs of loosening.
In addition to these classic cyclical slowdown warning signs, the geopolitical stage has been fraught with unsettling developments, most notably the ongoing war in Ukraine, conflict in the Middle East, and a tense relationship between the world’s two foremost superpowers: the U.S. and China. In spite of this wall of worry, both the domestic economy and key financial markets have remained undeterred, leading investors to ponder what is underlying this prosperity. The answer may lie, in part, on the fiscal front.
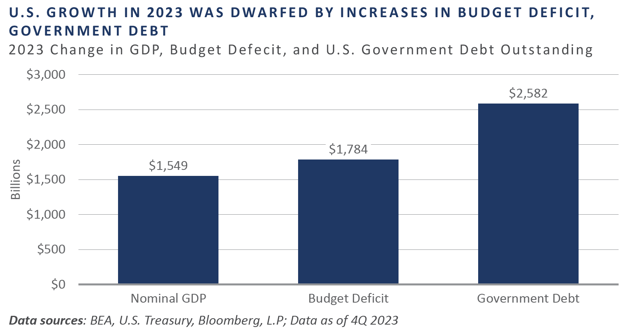
Debt, credit, leverage, whatever you want to call it, the U.S. economy seemingly can’t get by without more of it. In 2023, the U.S. economy expanded by nearly $1.6 trillion in nominal terms. This economic gain, however, was dwarfed by a $1.8 trillion increase in the federal budget deficit and an even greater increase of $2.6 trillion in outstanding government debt. Stated otherwise, it took $1.15 of deficit spending and $1.67 of government debt to generate every $1.00 of GDP growth.
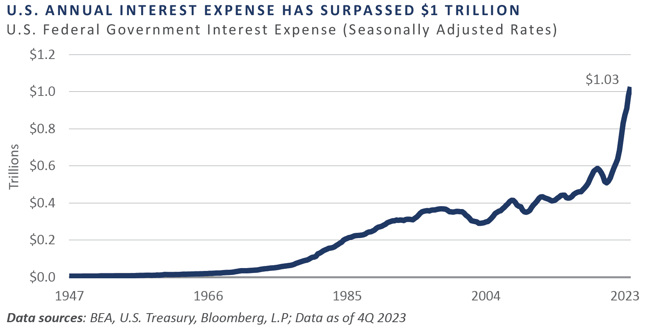
The growing federal debt burden, in conjunction with the highest federal funds rate in more than 20 years, has resulted in the Treasury’s annual interest expense piercing the $1 trillion threshold for the first time on record. In recent months, some pundits have even speculated that the Treasury’s annual interest expense is on the way to becoming the single largest line-item expense on their income statement.
Paying down that debt is critically important, but every incremental dollar spent on interest expense crowds out more productive uses of financial resources, such as investment in physical capital, research and development, and the education and training of our workforce.
REFLECTIONS AND OUTLOOK

For the quarter, and much of recent history, it has paid to be a stock market bull rather than a bear. In Taylor Swift parlance, the bulls who played have been rewarded and the bear haters have not. Since Swift released Shake It Off in 2014, the S&P 500 Index has generated positive returns in eight out of ten years. That said, markets go in cycles. Like driving a car, investors need to navigate by looking forward through the windshield, not looking backward in the rearview mirror. Ultimately, investors should seek to be neither serial players nor haters, but rational actors making fact-based investment decisions.
With that in mind, FEG continues to believe long-term investors’ strategic asset allocation should have a relatively constant risk posture (stocks) and illiquidity budget (private capital) as is prudently acceptable for their unique portfolio objectives. From that starting point, one can then tactically adjust to what the market offers up within Investment Policy Statement (IPS) parameters. Following numerous portfolio shifts in 2023 to emphasize an increase in overall portfolio quality, FEG is not making any significant top-down moves at present. The name of the game in diversifying strategies and private capital is manager selection. The investment team is not willing to sacrifice quality when high conviction managers cannot be found, but are quick to invest when such managers are accepting capital.
Haters will accurately point out that the risks—including valuations, geopolitics, and interest rates—are not abating quickly. Players, on the other hand, can point to earnings growth, profit margin expansion, and the AI revolution. Most of the time, the truth lies somewhere in the middle. That is how FEG is positioned today, and the team stands ready to pivot in either direction as the facts change. Investors should enjoy the strong start to the year. FEG will keep an eye out for top-down moves or bottom-up managers or niches to access and drive risk-adjusted returns with the goal of being ready to move when opportunities present themselves and being patient in the near term if they do not. Thank you for your continued confidence in and support of FEG.
DISCLOSURES
This report was prepared by FEG (also known as Fund Evaluation Group, LLC), a federally registered investment adviser under the Investment Advisers Act of 1940, as amended, providing non-discretionary and discretionary investment advice to its clients on an individual basis. Registration as an investment adviser does not imply a certain level of skill or training. The oral and written communications of an adviser provide you with information about which you determine to hire or retain an adviser. Fund Evaluation Group, LLC, Form ADV Part 2A & 2B can be obtained by written request directly to: Fund Evaluation Group, LLC, 201 East Fifth Street, Suite 1600, Cincinnati, OH 45202, Attention: Compliance Department.
The information herein was obtained from various sources. FEG does not guarantee the accuracy or completeness of such information provided by third parties. The information in this report is given as of the date indicated and believed to be reliable. FEG assumes no obligation to update this information, or to advise on further developments relating to it. FEG, its affiliates, directors, officers, employees, employee benefit programs and client accounts may have a long position in any securities of issuers discussed in this report.
Bloomberg Index Services Limited. BLOOMBERG® is a trademark and service mark of Bloomberg Finance L.P. and its affiliates (collectively “Bloomberg”). Bloomberg or Bloomberg’s licensors own all proprietary rights in the Bloomberg Indices. Bloomberg does not approve or endorse this material or guarantee the accuracy or completeness of any information herein, nor does Bloomberg make any warranty, express or implied, as to the results to be obtained therefrom, and, to the maximum extent allowed by law, Bloomberg shall not have any liability or responsibility for injury or damages arising in connection therewith.
Index performance results do not represent any managed portfolio returns. An investor cannot invest directly in a presented index, as an investment vehicle replicating an index would be required. An index does not charge management fees or brokerage expenses, and no such fees or expenses were deducted from the performance shown.
The Chartered Financial Analyst® (CFA) designation is a professional certification issued by the CFA Institute to qualified financial analysts who: (i) have a bachelor’s degree and four years of professional experience involving investment decision making or four years of qualified work experience[full time, but not necessarily investment related]; (ii) complete a self‐study program (250 hours of study for each of the three levels); (iii) successfully complete a series of three six‐hour exams; and (iv) pledge to adhere to the CFA Institute Code of Ethics and Standards of Professional Conduct.
The Chartered Alternative Investment Analyst Association® is an independent, not‐for‐profit global organization committed to education and professionalism in the field of alternative investments. Founded in 2002, the CAIA Association is the sponsoring body for the CAIA designation. Recognized globally, the designation certifies one's mastery of the concepts, tools and practices essential for understanding alternative investments and promotes adherence to high standards of professional conduct.
Neither the information nor any opinion expressed in this report constitutes an offer, or an invitation to make an offer, to buy or sell any securities.
Any return expectations provided are not intended as, and must not be regarded as, a representation, warranty or predication that the investment will achieve any particular rate of return over any particular time period or that investors will not incur losses.
Diversification or Asset Allocation does not assure or guarantee better performance and cannot eliminate the risk of investment loss.
Past performance is not indicative of future results.
This blog is prepared for informational purposes only. It does not address specific investment objectives, or the financial situation and the particular needs of any person who may receive this report.
INDICES
The Alerian MLP Index is a composite of the 50 most prominent energy Master Limited Partnerships that provides investors with an unbiased, comprehensive benchmark for this emerging asset class.
The HFRI Monthly Indices (HFRI) are equally weighted performance indexes, compiled by Hedge Fund Research Inc., and are utilized by numerous hedge fund managers as a benchmark for their own hedge funds. The HFRI are broken down into 37 different categories by strategy, including the HFRI Fund Weighted Composite, which accounts for over 2000 funds listed on the internal HFR Database. The HFRI Fund of Funds Composite Index is an equal weighted, net of fee, index composed of approximately 800 fund of funds which report to HFR. See www.hedgefundresearch.com for more information on index construction.
The MSCI ACWI (All Country World Index) Index is a free float-adjusted market capitalization weighted index that is designed to measure the equity market performance of developed and emerging markets. The MSCI ACWI consists of 47 country indexes comprising 23 developed and 24 emerging market country indexes. The developed market country indexes included are: Australia, Austria, Belgium, Canada, Denmark, Finland, France, Germany, Hong Kong, Ireland, Israel, Italy, Japan, Netherlands, New Zealand, Norway, Portugal, Singapore, Spain, Sweden, Switzerland, the United Kingdom and the United States. The emerging market country indexes included are: Brazil, Chile, China, Colombia, Czech Republic, Egypt, Greece, Hungary, India, Indonesia, Korea, Kuwait, Malaysia, Mexico, Peru, Philippines, Poland, Qatar,Saudi Arabia, South Africa, Taiwan, Thailand, Turkey, and United Arab Emirates.
The S&P 500 Index is a capitalization-weighted index of 500 stocks. The S&P 500 Index is designed to measure performance of the broad domestic economy through changes in the aggregate market value of 500 stocks representing all major industries.
Information on any indices mentioned can be obtained either through your advisor or by written request to information@feg.com.
Advisors
Latest Publication
Private Giants on the Public Stage: Assessing the Coming Wave of Mega IPOs
In Brief The next wave of mega IPOs could be constructive over the long run, but disruptive in the near term as investor...
Latest Publication
Private Giants on the Public Stage: Assessing the Coming Wave of Mega IPOs
In Brief The next wave of mega IPOs could be constructive over the long run, but disruptive in the near term as investor...
Latest Podcast
Infrastructure for Intelligence: A Conversation with Blue Owl
Exploring the private capital powering AI-era digital infrastructure at global scale.
Market Perspectives
Private Giants on the Public Stage: Assessing the Coming Wave of Mega IPOs
Portfolio Insights
First Quarter 2026: Trump Card Played
Market Perspectives
When Diversification Is Tested: The Opportunity for Hedge Funds in a Dispersed Market
Industry Perspectives
Structuring and Governing EMF Programs: A Four-Step Framework
First Quarter 2024 Market Commentary: Shake It Off
The stock market started the year with a bang. In keeping with the Taylor Swift song Shake It Off, the market has remained unbothered by potential external signs of instability and has continued to march higher. Swift released the song as the lead single on her fifth album in the fall of 2014. Nearly a decade later, the artist’s popularity and net worth have grown exponentially, as have the gains for many investors that remained long the stock market over the same period.
While it is true that the market brushed off areas of concern to reach new highs, it is also true that investors have fundamental reasons to remain optimistic. Earnings growth estimates for the S&P 500 Index are in the low double digits for 2024, operating margins are expanding, and corporate CFO optimism about the economy is increasing. On the flip slide, insider selling by management teams has increased to a level similar to 2022, often a sign corporate management teams believe their stock price is fully valued, if not overvalued.
Global equity markets, as measured by the MSCI All Country World Index, returned 8.2% in the first quarter. In a familiar tune for investors, U.S. stocks outperformed non-U.S. stocks, large cap bested small cap, and growth topped value. Unlike equities, however, other asset classes struggled in the quarter. Bonds and real assets were both slightly negative, with the Bloomberg U.S. Aggregate Bond Index and S&P Real Assets Equity Index posting returns of -0.8% and -0.1%, respectively. Lastly, diversifying strategies were in the black, with the HFRX Global Hedge Fund Index generating a quarterly return of 2.5%.
KEY MARKET THEMES AND DEVELOPMENTS
U.S. Stock Market Exuberance Humbles Naysayers Despite a Swelling List of Concerns
The multi-year theme of robust U.S. financial market performance—both absolute and relative—remained in place through the first quarter of 2024 despite a growing number of factors which, in isolation, should broadcast caution to risk-takers. Examples of these perceived headwinds include elevated valuations across both stock and credit markets, a highly uncertain near-term path of Federal Reserve (Fed) monetary policy, stubbornly elevated inflation rates, ongoing conflicts in eastern Europe—and more recently the Red Sea—and a U.S. fiscal situation which appears highly unsustainable.
Nevertheless, the U.S. equity market marched higher in the first three months of the year, propelling the S&P 500 Index to its highest price and total return index level on record, with gains of 10.2% and 10.6%, respectively. The strong bid for U.S.-based risk exposure was not confined to the equity markets during the quarter, as credit risk premiums narrowed to the lowest level since early 2022, a time when the Fed was initiating the monetary tightening process.
On a spread basis, U.S. high yield bond risk premiums tightened to a sub-300 basis point (bp) level, placing this variable in the fourth percentile of observations dating back to the late 1980s. Often viewed as a leading cyclical indicator of the business cycle, the current subdued level of risk compensation assumed by high yield investors reflects supportive credit conditions, significant investor demand for credit risk, and little-to-no worry for a near-term economic downturn.
However, given the Fed’s purchases of high yield bonds during the COVID-19 pandemic as they tiptoed outside the confines of the 1913 Federal Reserve Act, the usefulness of this gauge has potentially been tainted. This is similar to the slope of the Treasury yield curve, which has remained inverted for two full years—as reflected by the spread between 2 and 10-Year Treasury Notes—thanks to the Fed’s interventionist asset purchase policies since the 2008-2009 Global Financial Crisis.
The combination of sticky inflation and a resilient U.S. economy helped prompt a convergence between the bond market’s discounted path of Fed easing and that of the Fed through their Summary of Economic Projections “Dot Plot” table in the first quarter. In prior quarters, the general trend of the equity market ebbed and flowed in response to the implied near-term path of Fed policy. That is, increasing expectations for Fed rate cuts served as a tailwind behind risk assets and vice versa. This relationship seems to have decoupled in recent months, however, as the equity market has powered through reduced rate cut expectations.
At the beginning of the year, the fed funds futures market had discounted nearly seven 25 basis point rate cuts throughout 2024. By the end of the quarter, this expectation had narrowed to just three implied cuts, bringing the implied path in line with the path first laid out by the Fed in December 2023 and later reaffirmed at the March 2024 policy meeting. Surprisingly, stocks seemed unaffected by this convergence.
Central to the narrowing of the implied path of Fed easing in recent months is that realized inflation rates, in aggregate, have been slow to return to the Fed’s 2% targeted level. Many of the widely reported inflation indicators have faced resistance in recent months, with several hovering in the 3-4% range. While the general direction appears to favor the disinflationary bias that has been in place since 2023, the combination of a 5.50% federal funds rate and approximately $90 billion per month of quantitative tightening has not done the trick yet.
Nearly every inflation series is sending the same message: “sticky,” “supercore”—i.e., core services inflation excluding housing—and the Fed’s go-to measure of core personal consumption expenditure inflation all remain above mandate. Supercore inflation specifically has exhibited a reaccelerating bias since third quarter 2023.
Interestingly, despite inflation running above mandate and the establishment of record high prices across U.S. large cap stocks, bitcoin, and gold during the quarter, the Fed did not dial back their assessment for the appropriate number of rate cuts for 2024 at their March policy meeting. The Federal Open Market Committee (FOMC) update to the Fed’s dot plot again reflected three 25 basis point rate cuts on the table by the end of the year, an unchanged stance from the prior dot plot in December 2023.
While always a critical variable in assessing the likely path of near-term monetary policy, incoming inflationary data will be of particular focus in the coming months, as market participants seek to sniff out any potential deviation in the Fed’s plans to begin slowly reducing borrowing costs. Should inflation continue to surprise to the upside, a near-term easing in policy will likely be delayed, in turn placing a tailwind behind the recent rise in Treasury interest rates. Equity markets would then be in a tug of war, as higher rates are typically a headwind on valuations, while economic growth and subsequent earnings growth are a tailwind.
Although the public markets have shaken off most of their risks to move forward, private equity markets are moving slower to shake off the excesses experienced during the post-COVID bubble. Fundraising remains well off peak levels, and investment and exit activity have been muted in 2024. There is still a valuation gap between buyer and seller price expectations, though the gap is narrowing. The lack of liquidity is a meaningful hurdle for the private equity market to become more active. The acquisition market has been heavily affected by the valuation expectation gap. Private equity funds raised during the peak fundraising period of 2020-2022 have a ticking clock on their investment periods, which suggests that capital deployment will increase over the next one to three years. On the IPO front, a few select companies have begun testing the waters following the drought in 2023. Their after-market performance will be closely watched as firms seek signals for future IPOs.
One trend to watch is the use of secondary funds and continuation vehicles as managers seek alternative solutions for liquidity. According to Bain & Company, the unrealized value held by buyout funds has reached record highs and is 4x the value witnessed during the Global Financial Crisis. At the end of 2023, there were approximately 28,000 companies valued at $3.2 trillion held by buyout funds. If the limited exit environment continues, investors should expect to see more creative solutions from GPs and the secondary market. The use of continuation funds with capital from the secondary market could ramp up as GPs get capital back to LPs. The room for growth of secondary transactions is meaningful, as secondary transactions provide about $120 billion of liquidity for an industry with over $3 trillion in net asset value. Additionally, dry powder in larger buyout funds is an option for smaller funds to exit portfolio companies to other sponsors.
Strong and Resilient U.S. Economy for Now
The U.S. economy has displayed remarkable resiliency. A cursory review of inflation-adjusted quarterly growth rates confirms this strength, particularly when viewed relative to key trading partners such as Japan, China, and the eurozone. Since the fourth quarter of 2020—a start that was chosen to eliminate the base effects that stemmed from the COVID-19 pandemic—through the fourth quarter of 2023, quarterly inflation-adjusted real GDP growth has averaged an impressive 3.2% in the U.S, easily besting Japan (+1.6%), China (+1.2%), and the eurozone (+0.5%).
Moreover, the impressive average annualized quarterly growth of the U.S. economy has occurred despite a number of historically reliable recessionary indicators pointing to a looming downturn. For example, the U.S. term structure has remained inverted for two full years, growth rates across the Conference Board’s set of leading economic indicators have indicated recessionary pressures for the past 18 months, and the manufacturing base has been mired in contraction since October 2022. And the labor market, while seemingly strong on the surface, has exhibited some early warning signs of loosening.
In addition to these classic cyclical slowdown warning signs, the geopolitical stage has been fraught with unsettling developments, most notably the ongoing war in Ukraine, conflict in the Middle East, and a tense relationship between the world’s two foremost superpowers: the U.S. and China. In spite of this wall of worry, both the domestic economy and key financial markets have remained undeterred, leading investors to ponder what is underlying this prosperity. The answer may lie, in part, on the fiscal front.
Debt, credit, leverage, whatever you want to call it, the U.S. economy seemingly can’t get by without more of it. In 2023, the U.S. economy expanded by nearly $1.6 trillion in nominal terms. This economic gain, however, was dwarfed by a $1.8 trillion increase in the federal budget deficit and an even greater increase of $2.6 trillion in outstanding government debt. Stated otherwise, it took $1.15 of deficit spending and $1.67 of government debt to generate every $1.00 of GDP growth.
The growing federal debt burden, in conjunction with the highest federal funds rate in more than 20 years, has resulted in the Treasury’s annual interest expense piercing the $1 trillion threshold for the first time on record. In recent months, some pundits have even speculated that the Treasury’s annual interest expense is on the way to becoming the single largest line-item expense on their income statement.
Paying down that debt is critically important, but every incremental dollar spent on interest expense crowds out more productive uses of financial resources, such as investment in physical capital, research and development, and the education and training of our workforce.
REFLECTIONS AND OUTLOOK
For the quarter, and much of recent history, it has paid to be a stock market bull rather than a bear. In Taylor Swift parlance, the bulls who played have been rewarded and the bear haters have not. Since Swift released Shake It Off in 2014, the S&P 500 Index has generated positive returns in eight out of ten years. That said, markets go in cycles. Like driving a car, investors need to navigate by looking forward through the windshield, not looking backward in the rearview mirror. Ultimately, investors should seek to be neither serial players nor haters, but rational actors making fact-based investment decisions.
With that in mind, FEG continues to believe long-term investors’ strategic asset allocation should have a relatively constant risk posture (stocks) and illiquidity budget (private capital) as is prudently acceptable for their unique portfolio objectives. From that starting point, one can then tactically adjust to what the market offers up within Investment Policy Statement (IPS) parameters. Following numerous portfolio shifts in 2023 to emphasize an increase in overall portfolio quality, FEG is not making any significant top-down moves at present. The name of the game in diversifying strategies and private capital is manager selection. The investment team is not willing to sacrifice quality when high conviction managers cannot be found, but are quick to invest when such managers are accepting capital.
Haters will accurately point out that the risks—including valuations, geopolitics, and interest rates—are not abating quickly. Players, on the other hand, can point to earnings growth, profit margin expansion, and the AI revolution. Most of the time, the truth lies somewhere in the middle. That is how FEG is positioned today, and the team stands ready to pivot in either direction as the facts change. Investors should enjoy the strong start to the year. FEG will keep an eye out for top-down moves or bottom-up managers or niches to access and drive risk-adjusted returns with the goal of being ready to move when opportunities present themselves and being patient in the near term if they do not. Thank you for your continued confidence in and support of FEG.
DISCLOSURES
This report was prepared by FEG (also known as Fund Evaluation Group, LLC), a federally registered investment adviser under the Investment Advisers Act of 1940, as amended, providing non-discretionary and discretionary investment advice to its clients on an individual basis. Registration as an investment adviser does not imply a certain level of skill or training. The oral and written communications of an adviser provide you with information about which you determine to hire or retain an adviser. Fund Evaluation Group, LLC, Form ADV Part 2A & 2B can be obtained by written request directly to: Fund Evaluation Group, LLC, 201 East Fifth Street, Suite 1600, Cincinnati, OH 45202, Attention: Compliance Department.
The information herein was obtained from various sources. FEG does not guarantee the accuracy or completeness of such information provided by third parties. The information in this report is given as of the date indicated and believed to be reliable. FEG assumes no obligation to update this information, or to advise on further developments relating to it. FEG, its affiliates, directors, officers, employees, employee benefit programs and client accounts may have a long position in any securities of issuers discussed in this report.
Bloomberg Index Services Limited. BLOOMBERG® is a trademark and service mark of Bloomberg Finance L.P. and its affiliates (collectively “Bloomberg”). Bloomberg or Bloomberg’s licensors own all proprietary rights in the Bloomberg Indices. Bloomberg does not approve or endorse this material or guarantee the accuracy or completeness of any information herein, nor does Bloomberg make any warranty, express or implied, as to the results to be obtained therefrom, and, to the maximum extent allowed by law, Bloomberg shall not have any liability or responsibility for injury or damages arising in connection therewith.
Index performance results do not represent any managed portfolio returns. An investor cannot invest directly in a presented index, as an investment vehicle replicating an index would be required. An index does not charge management fees or brokerage expenses, and no such fees or expenses were deducted from the performance shown.
The Chartered Financial Analyst® (CFA) designation is a professional certification issued by the CFA Institute to qualified financial analysts who: (i) have a bachelor’s degree and four years of professional experience involving investment decision making or four years of qualified work experience[full time, but not necessarily investment related]; (ii) complete a self‐study program (250 hours of study for each of the three levels); (iii) successfully complete a series of three six‐hour exams; and (iv) pledge to adhere to the CFA Institute Code of Ethics and Standards of Professional Conduct.
The Chartered Alternative Investment Analyst Association® is an independent, not‐for‐profit global organization committed to education and professionalism in the field of alternative investments. Founded in 2002, the CAIA Association is the sponsoring body for the CAIA designation. Recognized globally, the designation certifies one's mastery of the concepts, tools and practices essential for understanding alternative investments and promotes adherence to high standards of professional conduct.
Neither the information nor any opinion expressed in this report constitutes an offer, or an invitation to make an offer, to buy or sell any securities.
Any return expectations provided are not intended as, and must not be regarded as, a representation, warranty or predication that the investment will achieve any particular rate of return over any particular time period or that investors will not incur losses.
Diversification or Asset Allocation does not assure or guarantee better performance and cannot eliminate the risk of investment loss.
Past performance is not indicative of future results.
This blog is prepared for informational purposes only. It does not address specific investment objectives, or the financial situation and the particular needs of any person who may receive this report.
INDICES
The Alerian MLP Index is a composite of the 50 most prominent energy Master Limited Partnerships that provides investors with an unbiased, comprehensive benchmark for this emerging asset class.
The HFRI Monthly Indices (HFRI) are equally weighted performance indexes, compiled by Hedge Fund Research Inc., and are utilized by numerous hedge fund managers as a benchmark for their own hedge funds. The HFRI are broken down into 37 different categories by strategy, including the HFRI Fund Weighted Composite, which accounts for over 2000 funds listed on the internal HFR Database. The HFRI Fund of Funds Composite Index is an equal weighted, net of fee, index composed of approximately 800 fund of funds which report to HFR. See www.hedgefundresearch.com for more information on index construction.
The MSCI ACWI (All Country World Index) Index is a free float-adjusted market capitalization weighted index that is designed to measure the equity market performance of developed and emerging markets. The MSCI ACWI consists of 47 country indexes comprising 23 developed and 24 emerging market country indexes. The developed market country indexes included are: Australia, Austria, Belgium, Canada, Denmark, Finland, France, Germany, Hong Kong, Ireland, Israel, Italy, Japan, Netherlands, New Zealand, Norway, Portugal, Singapore, Spain, Sweden, Switzerland, the United Kingdom and the United States. The emerging market country indexes included are: Brazil, Chile, China, Colombia, Czech Republic, Egypt, Greece, Hungary, India, Indonesia, Korea, Kuwait, Malaysia, Mexico, Peru, Philippines, Poland, Qatar,Saudi Arabia, South Africa, Taiwan, Thailand, Turkey, and United Arab Emirates.
The S&P 500 Index is a capitalization-weighted index of 500 stocks. The S&P 500 Index is designed to measure performance of the broad domestic economy through changes in the aggregate market value of 500 stocks representing all major industries.
Information on any indices mentioned can be obtained either through your advisor or by written request to information@feg.com.
Authors
Nolan Bean
Disclosures
This information is prepared for informational purposes only. It does not address specific investment objectives, or the financial situation and the particular needs of any person who may receive this presentation. Neither the information nor any opinion expressed in this report constitutes an offer, or an invitation to make an offer, to buy or sell any securities.
The information herein was obtained from various sources. FEG does not guarantee the accuracy or completeness of such information provided by third parties. The information in this presentation is given as of the date indicated and believed to be reliable. FEG assumes no obligation to update this information, or to advise on further developments relating to it.