The final quarter of 2022 brought relief to global investors, as most major asset classes and categories witnessed positive returns, a stark contrast to the full calendar year experience. Evidence of a potential peak in multi-decade high inflation surfaced in the fourth quarter, with reported figures slightly lower than consensus estimates in both October and November, as well as growing fundamental signs the “ingredients” of inflation have turned down. Related market reactions, including a slight reduction in the implied Federal Reserve (Fed) policy path, moderating interest rates, a cooling U.S. dollar (USD), and relative outperformance from international equities helped support risk-taking sentiment during the quarter. Moreover, growing sentiment surrounding a potential relaxation of China’s zero-COVID policies and associated expectations for a revival of economic activity within the region buoyed investor risk appetites during the quarter.
Global equity performance in the fourth quarter was broadly positive, with the strongest returns experienced in international developed markets, the rally of which helped pull returns within this space above those garnered by domestic equities on the year. Growth stocks—which often exhibit longer duration cash flow profiles and thus are relatively more susceptible to adverse changes in interest rates—suffered immensely in 2022, with relative outperformance on behalf of value stocks dominating the thematic backdrop for the year, supported by the energy sector’s gain of over 60% for the calendar year. Emerging market stocks lagged their domestic counterparts throughout most of 2022 but rebounded in the fourth quarter amid China’s long-awaited re-opening and a pronounced move lower in the USD.
Fixed income markets were upended in 2022, with core bonds suffering their worst calendar year in the history of the Bloomberg U.S. Aggregate Bond Index at -13%, a loss more than 4 times greater than the previous worst calendar year on record, 1994, in which bonds posted a 2.9% loss. Key headwinds to the asset class included the most vigorous inflationary backdrop since the early 1980s and the Fed’s aggressive tightening response. While rate-sensitive sectors faced the most meaningful performance challenges throughout the year, below investment-grade credit markets declined by nearly a similar margin, resulting in only a modest increase in credit risk premiums on the year. The combination of Fed tightening and a gradual weakening of economic fundamentals helped send the slope of the Treasury yield curve to its most inverted posture since the last time the Fed was battling the grips of inflation during the 1970s and early-1980s.
In general, real assets—particularly energy—was one of the few bright spots in 2022, with the asset class at the forefront of the inflationary impulse that dominated the landscape during the year. Commodities were a standout performer in 2022, especially for indices with meaningful representation in the energy sectors, as the Bloomberg Commodity Index generated a 16.1% total return on the year on the back of a 27.1% gain in 2021. Conversely, the rate-sensitive real estate investment trust (REIT) category was one of the worst performers in 2022, as sharply rising interest rates and heightened economic uncertainty weighed on performance.
KEY MARKET THEMES AND DEVELOPMENTS
FEDERAL RESERVE EMBARKS ON 180 - DEGREE POLICY REVERSAL AS INFLATION ACCELERATES TO 40-YEAR HIGH
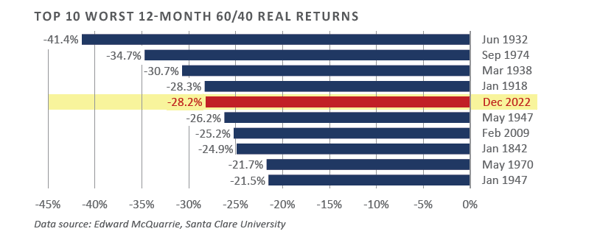
As the dust settled across the global financial markets at the end of 2022, global investors were left reeling, particularly allocators that traffic predominantly among traditional asset classes and categories. The commonly referenced 60/40 portfolio, often used as a proxy for the asset allocation mix for a traditional portfolio, suffered its fifth worst calendar year since the Great Depression, with a real return (inflation-adjusted) of -28.2% in 2022.
Central to the outsized negative performance—both in nominal and real terms—across stocks and bonds in 2022 included the most severe cost of living crisis the U.S. has experienced since the 1970s and 1980s. Faced with an inflation rate that reached 9.1% at the headline level in June and 6.6% at the core level in September, the Fed took drastic measures throughout 2022 to help restore price stability and return inflation closer to their target.
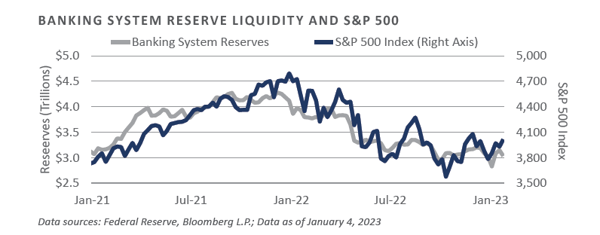
In addition to the 425 basis point increase in the policy rate in 2022, which reset the upper bound on the federal funds rate to 4.50%—the highest level since 2008—the Fed also carried out the plan they announced in late 2021 to taper and ultimately conclude the pace of asset purchases. Following a peak in their balance sheet of nearly $9 trillion in April, the Fed’s quantitative tightening measures led to a peak-to-trough decline of $414 billion by the end of 2022. In conjunction with rate hikes, this helped drive a greater than $1 trillion decline in banking system reserve liquidity, a key headwind to financial assets throughout 2022.
Tighter domestic monetary conditions have not only served as a headwind to risk assets, they have also transmitted into the broader financial markets through higher market interest rates, increasing credit risk premiums, and a sharp rise in the exchange rate value of the US.
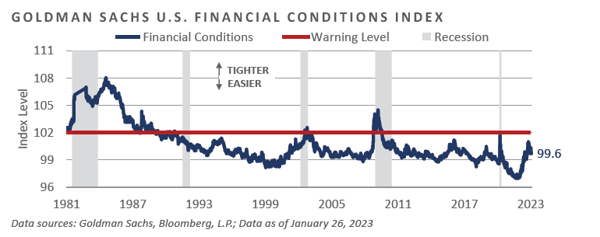
The commonly-refenced Goldman Sachs U.S. Financial Conditions Index helps highlight this linkage, as the abrupt pivot from an ultra-accommodative policy stance to one of incremental tightening over the trailing year has coincided with a meaningful tightening in financial conditions. Importantly, Goldman Sachs’ gauge remains modestly below levels that have historically signaled cyclical slowdown pressures, implying further Fed tightening is likely in order to slow the economy and tamp inflation.
Current bond market positioning suggests the Fed will tighten monetary conditions further in the coming months, with fed funds futures pointing to an elevated likelihood the Fed carries out a further 50 basis point increase to the policy rate over their next two meetings, followed by a pause in tightening through the summer months and an eventual “pivot” later in the year, a move which is expected to bring a modest reduction in the federal funds rate. The near-term implied policy path potentially points to further downside volatility across risk assets, while the anticipated late-2023 policy reversal provides counter-balancing hope for a more fertile risk-taking market environment.
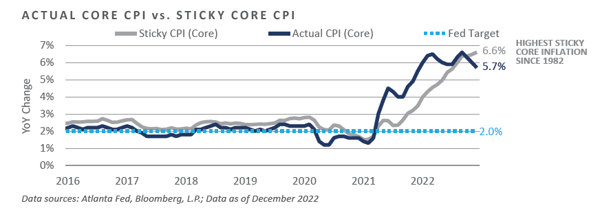
The trajectory of inflation in the coming months remains a top concern for policy officials, investors, and consumers, with softer-than-expected inflationary data likely accelerating the Fed’s anticipated pivot in policy posture and hotter-than-anticipated inflation expected to have the reverse effect. While the narrative of a looming Fed pause in tightening appeared supported by a cooling in reported measures of inflation in the fourth quarter of 2022, some gauges that estimate the persistence or “stickiness” of inflation continued to push to multi-decade highs by the end of the year. The Atlanta Fed’s measure of “Sticky” Core CPI, for example, showed core consumer price inflation at its stickiest in 40 years through December, despite reported inflation data witnessing a modest move lower in late 2022.
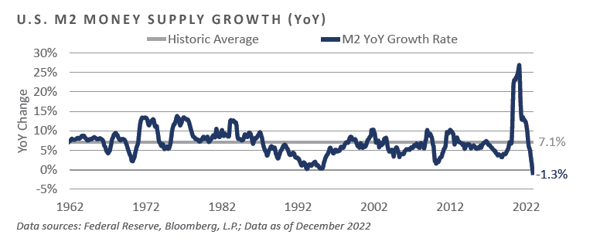
Persistent inflationary pressures aside, some good news for inflation hawks has surfaced in recent quarters. Broad money supply growth, which witnessed the most significant increase in at least 60 years throughout 2020 and 2021, has sharply reversed course amid Fed tightening and a narrowing in the federal budget deficit. By the end of 2022, M2 money supply annual growth had fallen 1.3% year-over-year, representing not only the lowest growth rate in the history of available data, but also the only negative print in the data series.
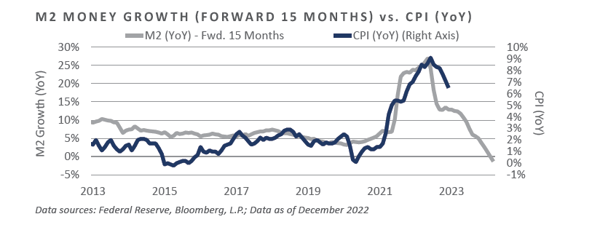
Since monetary policy—and its related impact on the trajectory of money growth—is widely assumed to operate with a long and variable lag, the recent significant drop- off in money growth potentially suggests an inflation surprise to the downside in the near to intermediate term, which would provide a welcomed surprise for many risk- seeking allocators. Should these downward moves also coincide with similar downward momentum across economic fundamentals, however, the specter of economic contraction would presumably be on the table.
U.S. ECONOMY REGAINS FOOTING IN SECOND HALF OF 2022, BUT NEAR-TERM CHALLENGES REMAIN
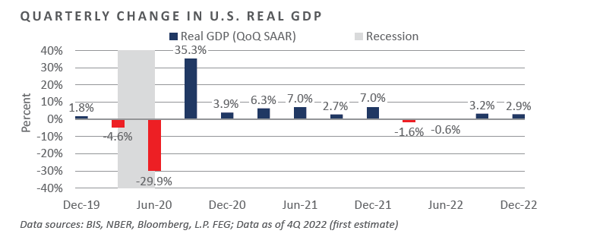
The U.S. economy contracted in the first half of 2022, with back-to-back quarterly declines in real GDP growth through the first two quarters of the year, meeting the traditional criteria of an economic contraction or recession. The second half of the year, however, brought a modest revival in economic activity, with quarterly real GDP growth averaging an approximate annual clip of 3%.
On the surface, the rebound across economic activity and financial market returns in the latter portion of 2022 reflects the potential for the soft-landing scenario the Fed has sought to produce since the initiation of tightening measures in early 2022.
The Fed’s goal of transmitting incrementally tighter monetary conditions through rate hikes, quantitative tightening, and hawkish forward guidance into tighter broader financial conditions—e.g., credit spreads, equity valuations, riskless interest rates—met resistance in the fourth quarter, with Goldman Sachs’s U.S. Financial Conditions Index easing 0.6% quarter-over-quarter, the first quarterly easing in financial conditions since fourth quarter 2021.
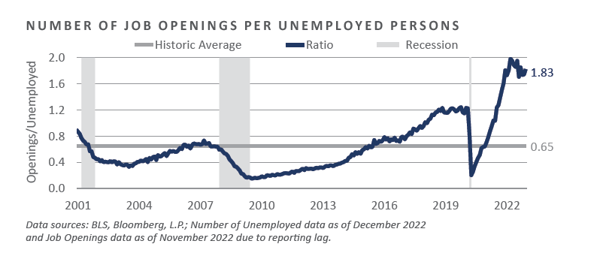
A likely driver of the resilient U.S. economic situation in the wake of material Fed tightening in 2022 includes one of the tightest labor market situations in recent memory, the strength of which is also a likely culprit behind the stickiness of the current inflationary regime. Through 2022, the rate of headline unemployment stood at 3.5%, a level that matched the lowest level of unemployment since a handful of readings observed throughout 2022 and the pre-COVID lockdown period as the lowest level of unemployment since December 1969.
In addition to historically low levels of unemployment the quarter saw one of the widest gaps between the number of job openings and the supply of available labor capital—i.e., unemployed persons. Through the most recently published data, there were nearly two job openings for every unemployed individual in the U.S., a ratio almost three times the long-run average and a gap the Fed has pointed to as confirming evidence of an unusually tight and resilient labor situation that appears to be a tailwind behind ongoing elevated inflationary pressures but clearly out of balance.
Central to the Fed’s goal of reducing inflation is softening the strength of the labor market to avoid wage growth that further exacerbates price pressures. Many heavily watched measures outside of the labor market that typically coincide with recessions have been signaling developing weakness throughout the economy since last year, and some signs of peak labor market strength have finally been forming.
Forward measures of the likely near-term course of U.S. economic performance soured further into year-end 2022, corroborating the early warning signals that had begun to flash last spring, such as immense downward pressure on the shape of the Treasury yield curve, which continues to remain deeply inverted. For the trailing six-month period that ended December 2022, the Conference Board’s set of leading economic indicators slumped at an annualized 8.2% pace and registered a 7.4% decline over the trailing one- year period, a rate that has historically confirmed the beginning stages of economic contraction.
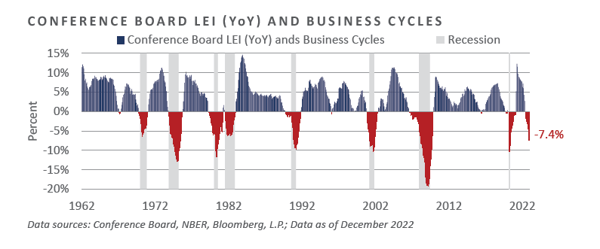
In the Conference Board report released January 23, 2023, Conference Board economist Ataman Ozyildirim, Senior Director, Economics, remarked, “The US LEI fell sharply again in December—continuing to signal recession for the US economy in the near term.” Ozyildirim further noted, “There was widespread weakness among leading indicators in December, indicating deteriorating conditions for labor markets, manufacturing, housing construction, and financial markets in the months ahead. Meanwhile, the coincident economic index (CEI) has not weakened in the same fashion as the LEI because labor market related indicators (employment and personal income) remain robust. Nonetheless, industrial production—also a component of the CEI—fell for the third straight month. Overall economic activity is likely to turn negative in the coming quarters before picking up again in the final quarter of 2023.”
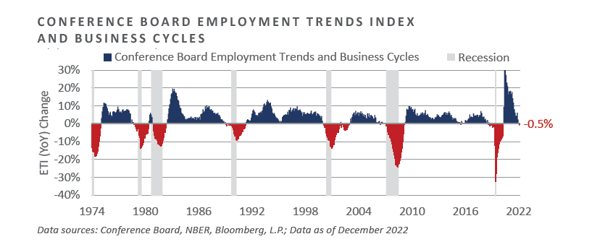
As the report notes, evidence of labor market deterioration has started to percolate, a trend which seems to be reflected in the Employment Trends Index, an alternative Conference Board data set which seeks to capture a broad array of labor market fundamental factors. Through 2022, the annual rate of change among this broad labor market gauge turned negative for the first time since the U.S. ended the COVID-19 lockdown measures of early 2020.
The recent sharp downturn in the rate of change across the U.S. labor situation could potentially prove to be the last shoe to drop in the gradual deceleration of the U.S. economic engine, the evolution of which is expected to bring further financial market volatility and thus a more fruitful opportunity set for opportunistic portfolio changes in the coming quarters. This is an outcome the Fed has seemingly sought to achieve since embarking on its tightening campaign in early 2022; however, the job appears only partially completed at present.
REFLECTIONS AND NEAR-TERM OUTLOOK
Global investors were taken on a wild ride in 2022, as global policymakers took measures to recalibrate monetary conditions in an attempt to stave off a further rise in already elevated inflation rates without a meaningful drop-off in economic activity. While some evidence began to surface in the final quarter of 2022 pointing to a potential cooling in persistent cost pressures, the costs of restoring price stability grew similarly evident, with some leading measures of the business cycle reflecting recessionary conditions, despite a labor market that has yet to register a meaningful downturn.
While many global asset allocators have ratcheted higher their long-term capital market assumptions across many key asset classes and categories—providing optimism for return potential over the secular horizon—additional near-term downside volatility, and thus upward pressure on risk premia, may be in order, as the growing pockets of weakness across the global economy become more broad-based, and previous offsetting contributors to economic activity, such as the resilient labor market, begin to succumb to the tightening grips of growing monetary restraint, which has historically transmitted a material lag on economic activity.
DISCLOSURES
Bloomberg Data Disclosure: Source- Bloomberg Index Services Limited. BLOOMBERG® is a trademark and service mark of Bloomberg Finance L.P. and its affiliates (collectively “Bloomberg”). Bloomberg or Bloomberg’s licensors own all proprietary rights in the Bloomberg Indices. Bloomberg does not approve or endorse this material or guarantee the accuracy or completeness of any information herein, nor does Bloomberg make any warranty, express or implied, as to the results to be obtained therefrom, and, to the maximum extent allowed by law, Bloomberg shall not have any liability or responsibility for injury or damages arising in connection therewith.
This report was prepared by Fund Evaluation Group, LLC (FEG), a federally registered investment adviser under the Investment Advisers Act of 1940, as amended, providing non-discretionary and discretionary investment advice to its clients on an individual basis. Registration as an investment adviser does not imply a certain level of skill or training. The oral and written communications of an adviser provide you with information about which you determine to hire or retain an adviser. Fund Evaluation Group, LLC, Form ADV Part 2A & 2B can be obtained by written request directed to: Fund Evaluation Group, LLC, 201 East Fifth Street, Suite 1600, Cincinnati, OH 45202 Attention: Compliance Department.
The information herein was obtained from various sources. FEG does not guarantee the accuracy or completeness of such information provided by third parties. The information in this report is given as of the date indicated and believed to be reliable. FEG assumes no obligation to update this information, or to advise on further developments relating to it. FEG, its affiliates, directors, officers, employees, employee benefit programs and client accounts may have a long position in any securities of issuers discussed in this report.
Diversification or Asset Allocation does not assure or guarantee better performance and cannot eliminate the risk of investment loss.
Index performance results do not represent any managed portfolio returns. An investor cannot invest directly in a presented index, as an investment vehicle replicating an index would be required. An index does not charge management fees or brokerage expenses, and no such fees or expenses were deducted from the performance shown.
Neither the information nor any opinion expressed in this report constitutes an offer, or an invitation to make an offer, to buy or sell any securities.
Any return expectations provided are not intended as, and must not be regarded as, a representation, warranty or predication that the investment will achieve any particular rate of return over any particular time period or that investors will not incur losses.
Past performance is not indicative of future results.
This report is intended for informational purposes only. It does not address specific investment objectives, or the financial situation and the particular needs of any person who may receive this report.
Published February 2023
INDICES
The Alerian MLP Index is a composite of the 50 most prominent energy Master Limited Partnerships that provides investors with an unbiased, comprehensive benchmark for this emerging asset class.
The HFRI Monthly Indices (HFRI) are equally weighted performance indexes, compiled by Hedge Fund Research Inc., and are utilized by numerous hedge fund managers as a benchmark for their own hedge funds. The HFRI are broken down into 37 different categories by strategy, including the HFRI Fund Weighted Composite, which accounts for over 2000 funds listed on the internal HFR Database. The HFRI Fund of Funds Composite Index is an equal weighted, net of fee, index composed of approximately 800 fund of funds which report to HFR. See www.hedgefundresearch.com for more information on index construction.
The MSCI ACWI (All Country World Index) Index is a free float-adjusted market capitalization weighted index that is designed to measure the equity market performance of developed and emerging markets. The MSCI ACWI consists of 46 country indexes comprising 23 developed and 24 emerging market country indexes. The developed market country indexes included are: Australia, Austria, Belgium, Canada, Denmark, Finland, France, Germany, Hong Kong, Ireland, Israel, Italy, Japan, Netherlands, New Zealand, Norway, Portugal, Singapore, Spain, Sweden, Switzerland, the United Kingdom and the United States. The emerging market country indexes included are: Brazil, Chile, China, Colombia, Czech Republic, Egypt, Greece, Hungary, India, Indonesia, Korea, Malaysia, Mexico, Peru, Philippines, Poland, Qatar, Saudi Arabia, South Africa, Taiwan, Thailand, Turkey, and United Arab Emirates.
The S&P 500 Index is a capitalization-weighted index of 500 stocks. The S&P 500 Index is designed to measure performance of the broad domestic economy through changes in the aggregate market value of 500 stocks representing all major industries.
Information on any indices mentioned can be obtained either through your advisor or by written request to information@feg.com.
Market Insight
Market Commentary: Fourth Quarter 2022
The final quarter of 2022 brought relief to global investors, as most major asset classes and categories witnessed positive returns, a stark contrast to the full calendar year experience. Evidence of a potential peak in multi-decade high inflation surfaced in the fourth quarter, with reported figures slightly lower than consensus estimates in both October and November, as well as growing fundamental signs the “ingredients” of inflation have turned down. Related market reactions, including a slight reduction in the implied Federal Reserve (Fed) policy path, moderating interest rates, a cooling U.S. dollar (USD), and relative outperformance from international equities helped support risk-taking sentiment during the quarter. Moreover, growing sentiment surrounding a potential relaxation of China’s zero-COVID policies and associated expectations for a revival of economic activity within the region buoyed investor risk appetites during the quarter.
Global equity performance in the fourth quarter was broadly positive, with the strongest returns experienced in international developed markets, the rally of which helped pull returns within this space above those garnered by domestic equities on the year. Growth stocks—which often exhibit longer duration cash flow profiles and thus are relatively more susceptible to adverse changes in interest rates—suffered immensely in 2022, with relative outperformance on behalf of value stocks dominating the thematic backdrop for the year, supported by the energy sector’s gain of over 60% for the calendar year. Emerging market stocks lagged their domestic counterparts throughout most of 2022 but rebounded in the fourth quarter amid China’s long-awaited re-opening and a pronounced move lower in the USD.
Fixed income markets were upended in 2022, with core bonds suffering their worst calendar year in the history of the Bloomberg U.S. Aggregate Bond Index at -13%, a loss more than 4 times greater than the previous worst calendar year on record, 1994, in which bonds posted a 2.9% loss. Key headwinds to the asset class included the most vigorous inflationary backdrop since the early 1980s and the Fed’s aggressive tightening response. While rate-sensitive sectors faced the most meaningful performance challenges throughout the year, below investment-grade credit markets declined by nearly a similar margin, resulting in only a modest increase in credit risk premiums on the year. The combination of Fed tightening and a gradual weakening of economic fundamentals helped send the slope of the Treasury yield curve to its most inverted posture since the last time the Fed was battling the grips of inflation during the 1970s and early-1980s.
In general, real assets—particularly energy—was one of the few bright spots in 2022, with the asset class at the forefront of the inflationary impulse that dominated the landscape during the year. Commodities were a standout performer in 2022, especially for indices with meaningful representation in the energy sectors, as the Bloomberg Commodity Index generated a 16.1% total return on the year on the back of a 27.1% gain in 2021. Conversely, the rate-sensitive real estate investment trust (REIT) category was one of the worst performers in 2022, as sharply rising interest rates and heightened economic uncertainty weighed on performance.
KEY MARKET THEMES AND DEVELOPMENTS
FEDERAL RESERVE EMBARKS ON 180 - DEGREE POLICY REVERSAL AS INFLATION ACCELERATES TO 40-YEAR HIGH
As the dust settled across the global financial markets at the end of 2022, global investors were left reeling, particularly allocators that traffic predominantly among traditional asset classes and categories. The commonly referenced 60/40 portfolio, often used as a proxy for the asset allocation mix for a traditional portfolio, suffered its fifth worst calendar year since the Great Depression, with a real return (inflation-adjusted) of -28.2% in 2022.
Central to the outsized negative performance—both in nominal and real terms—across stocks and bonds in 2022 included the most severe cost of living crisis the U.S. has experienced since the 1970s and 1980s. Faced with an inflation rate that reached 9.1% at the headline level in June and 6.6% at the core level in September, the Fed took drastic measures throughout 2022 to help restore price stability and return inflation closer to their target.
In addition to the 425 basis point increase in the policy rate in 2022, which reset the upper bound on the federal funds rate to 4.50%—the highest level since 2008—the Fed also carried out the plan they announced in late 2021 to taper and ultimately conclude the pace of asset purchases. Following a peak in their balance sheet of nearly $9 trillion in April, the Fed’s quantitative tightening measures led to a peak-to-trough decline of $414 billion by the end of 2022. In conjunction with rate hikes, this helped drive a greater than $1 trillion decline in banking system reserve liquidity, a key headwind to financial assets throughout 2022.
Tighter domestic monetary conditions have not only served as a headwind to risk assets, they have also transmitted into the broader financial markets through higher market interest rates, increasing credit risk premiums, and a sharp rise in the exchange rate value of the US.
The commonly-refenced Goldman Sachs U.S. Financial Conditions Index helps highlight this linkage, as the abrupt pivot from an ultra-accommodative policy stance to one of incremental tightening over the trailing year has coincided with a meaningful tightening in financial conditions. Importantly, Goldman Sachs’ gauge remains modestly below levels that have historically signaled cyclical slowdown pressures, implying further Fed tightening is likely in order to slow the economy and tamp inflation.
Current bond market positioning suggests the Fed will tighten monetary conditions further in the coming months, with fed funds futures pointing to an elevated likelihood the Fed carries out a further 50 basis point increase to the policy rate over their next two meetings, followed by a pause in tightening through the summer months and an eventual “pivot” later in the year, a move which is expected to bring a modest reduction in the federal funds rate. The near-term implied policy path potentially points to further downside volatility across risk assets, while the anticipated late-2023 policy reversal provides counter-balancing hope for a more fertile risk-taking market environment.
The trajectory of inflation in the coming months remains a top concern for policy officials, investors, and consumers, with softer-than-expected inflationary data likely accelerating the Fed’s anticipated pivot in policy posture and hotter-than-anticipated inflation expected to have the reverse effect. While the narrative of a looming Fed pause in tightening appeared supported by a cooling in reported measures of inflation in the fourth quarter of 2022, some gauges that estimate the persistence or “stickiness” of inflation continued to push to multi-decade highs by the end of the year. The Atlanta Fed’s measure of “Sticky” Core CPI, for example, showed core consumer price inflation at its stickiest in 40 years through December, despite reported inflation data witnessing a modest move lower in late 2022.
Persistent inflationary pressures aside, some good news for inflation hawks has surfaced in recent quarters. Broad money supply growth, which witnessed the most significant increase in at least 60 years throughout 2020 and 2021, has sharply reversed course amid Fed tightening and a narrowing in the federal budget deficit. By the end of 2022, M2 money supply annual growth had fallen 1.3% year-over-year, representing not only the lowest growth rate in the history of available data, but also the only negative print in the data series.
Since monetary policy—and its related impact on the trajectory of money growth—is widely assumed to operate with a long and variable lag, the recent significant drop- off in money growth potentially suggests an inflation surprise to the downside in the near to intermediate term, which would provide a welcomed surprise for many risk- seeking allocators. Should these downward moves also coincide with similar downward momentum across economic fundamentals, however, the specter of economic contraction would presumably be on the table.
U.S. ECONOMY REGAINS FOOTING IN SECOND HALF OF 2022, BUT NEAR-TERM CHALLENGES REMAIN
The U.S. economy contracted in the first half of 2022, with back-to-back quarterly declines in real GDP growth through the first two quarters of the year, meeting the traditional criteria of an economic contraction or recession. The second half of the year, however, brought a modest revival in economic activity, with quarterly real GDP growth averaging an approximate annual clip of 3%.
On the surface, the rebound across economic activity and financial market returns in the latter portion of 2022 reflects the potential for the soft-landing scenario the Fed has sought to produce since the initiation of tightening measures in early 2022.
The Fed’s goal of transmitting incrementally tighter monetary conditions through rate hikes, quantitative tightening, and hawkish forward guidance into tighter broader financial conditions—e.g., credit spreads, equity valuations, riskless interest rates—met resistance in the fourth quarter, with Goldman Sachs’s U.S. Financial Conditions Index easing 0.6% quarter-over-quarter, the first quarterly easing in financial conditions since fourth quarter 2021.
A likely driver of the resilient U.S. economic situation in the wake of material Fed tightening in 2022 includes one of the tightest labor market situations in recent memory, the strength of which is also a likely culprit behind the stickiness of the current inflationary regime. Through 2022, the rate of headline unemployment stood at 3.5%, a level that matched the lowest level of unemployment since a handful of readings observed throughout 2022 and the pre-COVID lockdown period as the lowest level of unemployment since December 1969.
In addition to historically low levels of unemployment the quarter saw one of the widest gaps between the number of job openings and the supply of available labor capital—i.e., unemployed persons. Through the most recently published data, there were nearly two job openings for every unemployed individual in the U.S., a ratio almost three times the long-run average and a gap the Fed has pointed to as confirming evidence of an unusually tight and resilient labor situation that appears to be a tailwind behind ongoing elevated inflationary pressures but clearly out of balance.
Central to the Fed’s goal of reducing inflation is softening the strength of the labor market to avoid wage growth that further exacerbates price pressures. Many heavily watched measures outside of the labor market that typically coincide with recessions have been signaling developing weakness throughout the economy since last year, and some signs of peak labor market strength have finally been forming.
Forward measures of the likely near-term course of U.S. economic performance soured further into year-end 2022, corroborating the early warning signals that had begun to flash last spring, such as immense downward pressure on the shape of the Treasury yield curve, which continues to remain deeply inverted. For the trailing six-month period that ended December 2022, the Conference Board’s set of leading economic indicators slumped at an annualized 8.2% pace and registered a 7.4% decline over the trailing one- year period, a rate that has historically confirmed the beginning stages of economic contraction.
In the Conference Board report released January 23, 2023, Conference Board economist Ataman Ozyildirim, Senior Director, Economics, remarked, “The US LEI fell sharply again in December—continuing to signal recession for the US economy in the near term.” Ozyildirim further noted, “There was widespread weakness among leading indicators in December, indicating deteriorating conditions for labor markets, manufacturing, housing construction, and financial markets in the months ahead. Meanwhile, the coincident economic index (CEI) has not weakened in the same fashion as the LEI because labor market related indicators (employment and personal income) remain robust. Nonetheless, industrial production—also a component of the CEI—fell for the third straight month. Overall economic activity is likely to turn negative in the coming quarters before picking up again in the final quarter of 2023.”
As the report notes, evidence of labor market deterioration has started to percolate, a trend which seems to be reflected in the Employment Trends Index, an alternative Conference Board data set which seeks to capture a broad array of labor market fundamental factors. Through 2022, the annual rate of change among this broad labor market gauge turned negative for the first time since the U.S. ended the COVID-19 lockdown measures of early 2020.
The recent sharp downturn in the rate of change across the U.S. labor situation could potentially prove to be the last shoe to drop in the gradual deceleration of the U.S. economic engine, the evolution of which is expected to bring further financial market volatility and thus a more fruitful opportunity set for opportunistic portfolio changes in the coming quarters. This is an outcome the Fed has seemingly sought to achieve since embarking on its tightening campaign in early 2022; however, the job appears only partially completed at present.
REFLECTIONS AND NEAR-TERM OUTLOOK
Global investors were taken on a wild ride in 2022, as global policymakers took measures to recalibrate monetary conditions in an attempt to stave off a further rise in already elevated inflation rates without a meaningful drop-off in economic activity. While some evidence began to surface in the final quarter of 2022 pointing to a potential cooling in persistent cost pressures, the costs of restoring price stability grew similarly evident, with some leading measures of the business cycle reflecting recessionary conditions, despite a labor market that has yet to register a meaningful downturn.
While many global asset allocators have ratcheted higher their long-term capital market assumptions across many key asset classes and categories—providing optimism for return potential over the secular horizon—additional near-term downside volatility, and thus upward pressure on risk premia, may be in order, as the growing pockets of weakness across the global economy become more broad-based, and previous offsetting contributors to economic activity, such as the resilient labor market, begin to succumb to the tightening grips of growing monetary restraint, which has historically transmitted a material lag on economic activity.
DISCLOSURES
Bloomberg Data Disclosure: Source- Bloomberg Index Services Limited. BLOOMBERG® is a trademark and service mark of Bloomberg Finance L.P. and its affiliates (collectively “Bloomberg”). Bloomberg or Bloomberg’s licensors own all proprietary rights in the Bloomberg Indices. Bloomberg does not approve or endorse this material or guarantee the accuracy or completeness of any information herein, nor does Bloomberg make any warranty, express or implied, as to the results to be obtained therefrom, and, to the maximum extent allowed by law, Bloomberg shall not have any liability or responsibility for injury or damages arising in connection therewith.
This report was prepared by Fund Evaluation Group, LLC (FEG), a federally registered investment adviser under the Investment Advisers Act of 1940, as amended, providing non-discretionary and discretionary investment advice to its clients on an individual basis. Registration as an investment adviser does not imply a certain level of skill or training. The oral and written communications of an adviser provide you with information about which you determine to hire or retain an adviser. Fund Evaluation Group, LLC, Form ADV Part 2A & 2B can be obtained by written request directed to: Fund Evaluation Group, LLC, 201 East Fifth Street, Suite 1600, Cincinnati, OH 45202 Attention: Compliance Department.
The information herein was obtained from various sources. FEG does not guarantee the accuracy or completeness of such information provided by third parties. The information in this report is given as of the date indicated and believed to be reliable. FEG assumes no obligation to update this information, or to advise on further developments relating to it. FEG, its affiliates, directors, officers, employees, employee benefit programs and client accounts may have a long position in any securities of issuers discussed in this report.
Diversification or Asset Allocation does not assure or guarantee better performance and cannot eliminate the risk of investment loss.
Index performance results do not represent any managed portfolio returns. An investor cannot invest directly in a presented index, as an investment vehicle replicating an index would be required. An index does not charge management fees or brokerage expenses, and no such fees or expenses were deducted from the performance shown.
Neither the information nor any opinion expressed in this report constitutes an offer, or an invitation to make an offer, to buy or sell any securities.
Any return expectations provided are not intended as, and must not be regarded as, a representation, warranty or predication that the investment will achieve any particular rate of return over any particular time period or that investors will not incur losses.
Past performance is not indicative of future results.
This report is intended for informational purposes only. It does not address specific investment objectives, or the financial situation and the particular needs of any person who may receive this report.
Published February 2023
INDICES
The Alerian MLP Index is a composite of the 50 most prominent energy Master Limited Partnerships that provides investors with an unbiased, comprehensive benchmark for this emerging asset class.
The HFRI Monthly Indices (HFRI) are equally weighted performance indexes, compiled by Hedge Fund Research Inc., and are utilized by numerous hedge fund managers as a benchmark for their own hedge funds. The HFRI are broken down into 37 different categories by strategy, including the HFRI Fund Weighted Composite, which accounts for over 2000 funds listed on the internal HFR Database. The HFRI Fund of Funds Composite Index is an equal weighted, net of fee, index composed of approximately 800 fund of funds which report to HFR. See www.hedgefundresearch.com for more information on index construction.
The MSCI ACWI (All Country World Index) Index is a free float-adjusted market capitalization weighted index that is designed to measure the equity market performance of developed and emerging markets. The MSCI ACWI consists of 46 country indexes comprising 23 developed and 24 emerging market country indexes. The developed market country indexes included are: Australia, Austria, Belgium, Canada, Denmark, Finland, France, Germany, Hong Kong, Ireland, Israel, Italy, Japan, Netherlands, New Zealand, Norway, Portugal, Singapore, Spain, Sweden, Switzerland, the United Kingdom and the United States. The emerging market country indexes included are: Brazil, Chile, China, Colombia, Czech Republic, Egypt, Greece, Hungary, India, Indonesia, Korea, Malaysia, Mexico, Peru, Philippines, Poland, Qatar, Saudi Arabia, South Africa, Taiwan, Thailand, Turkey, and United Arab Emirates.
The S&P 500 Index is a capitalization-weighted index of 500 stocks. The S&P 500 Index is designed to measure performance of the broad domestic economy through changes in the aggregate market value of 500 stocks representing all major industries.
Information on any indices mentioned can be obtained either through your advisor or by written request to information@feg.com.
Recent posts
Subscribe to blog