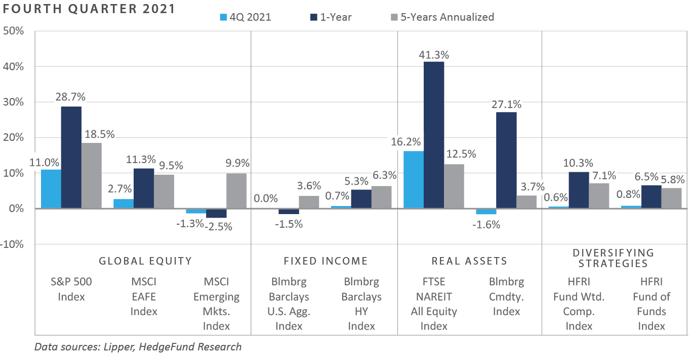
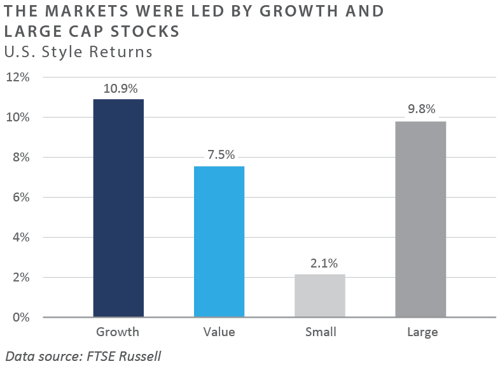
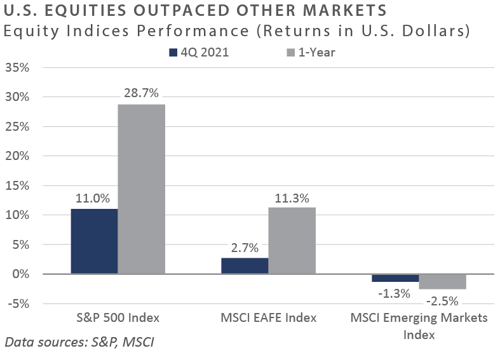
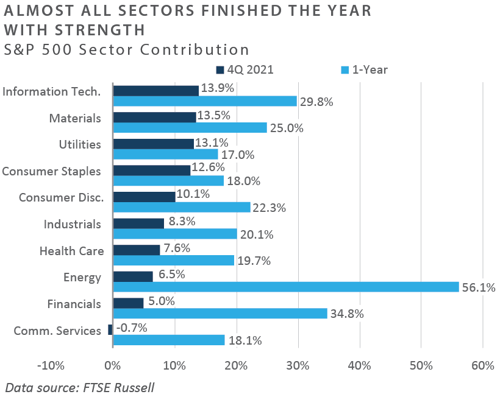
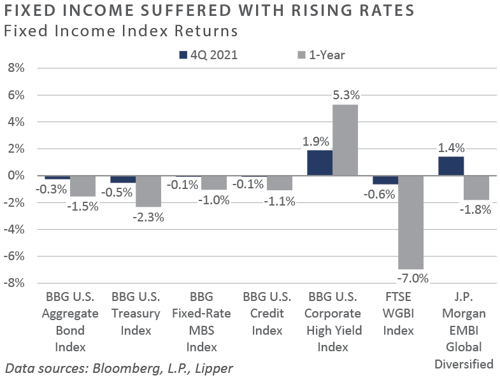
The ongoing global economic recovery that occurred throughout 2021 was accompanied by historically elevated returns across most risk-oriented corners of the market, particularly domestic sectors. The concluding quarter of the year presented risk-seeking investors with notably strong returns, despite the initiation of quantitative easing (QE) tapering by the Federal Reserve (Fed) in November. Global equity performance for both the fourth quarter and calendar year strongly favored domestic large cap, while smaller cap and internationally based indices lagged. Emerging market equities, as reflected by the MSCI Emerging Markets Index, underperformed domestic (S&P 500 Index) by more than 30 percentage points in 2021, representing the second sharpest calendar year underperformance, behind 2013, in at least two decades. Fixed income performance for both the fourth quarter and calendar year overwhelmingly favored credit-based sectors versus those of a more rate-sensitive nature, as rising inflationary pressures helped drive nominal interest rates higher. Real asset performance, in aggregate, was robust throughout the year, buoyed by a continued global expansionary bias, inflation rates at a multi-decade high, and expectations for a continuation of these tailwinds to performance over the near term.
Economic Update
Risk Assets Shrug off Elevated Inflation, Fed Tapering, with Strong 2021 Performance
Against a complex backdrop of an overall expansionary bias and continued historically accommodative monetary and fiscal policy on one hand and sharply rising inflation rates pressing policymakers to rein in the pace of accommodation on the other, risk-based asset classes and categories generated elevated total returns in 2021.
The multi-year theme of domestic assets broadly outperforming their international peers remained firmly in place throughout most of the year, particularly when viewed through the lens of domestic versus emerging market equity relative performance. Relatedly, the U.S. dollar (USD) appreciated meaningfully against a broad basket of liquid emerging market currencies in 2021, placing some commonly referenced emerging market currency index gauges at multi-decade lows versus the USD.
In the second half of the year, a relatively robust domestic economic recovery called into question the continued need for near-zero policy rates and the previous COVID-era pace of monthly Fed asset purchases, which stood at $120 billion per month before the initiation of Fed QE tapering in November.
Throughout 2021, the Fed was presented with ample evidence pointing to the need for a less accommodative posture. Their preferred inflationary gauge, for example, accelerated to a more than 30-year high through November, to a rate nearly 300 basis points ahead of their stated 2.0% targeted level.
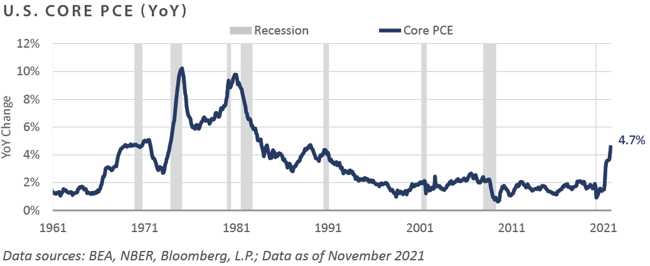
With realized inflation running at a multi-decade-high pace, combined with significant improvement across headline measures of unemployment that have coincided with strong upward pressure on risky asset valuations, the Fed shifted gears to reflect a less accommodative stance in late 2021. In a widely telegraphed move, the Fed initiated the tapering of asset purchases in November by announcing a $15 billion monthly reduction in their monthly pace of asset purchases, which pre-taper stood at $120 billion per month in purchases.
With more timely employment and inflationary data available for their mid-December meeting, the Fed acknowledged the need for an even quicker pace of marginal policy accommodation removal and announced the doubling of the pace of QE tapering to $30 billion, in addition to making upward revisions to the Fed’s “dot plot” estimate of where committee members expect the policy rate to be in the coming years.
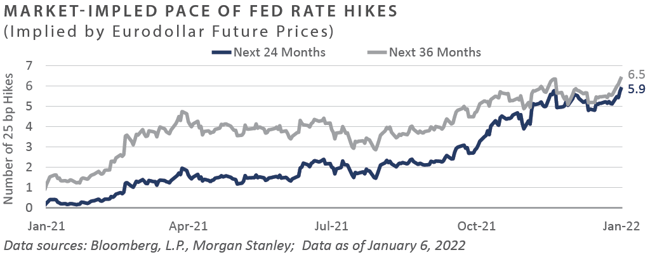
Market participants reflect comparable sentiment for tighter monetary conditions, with current market implied measures continuing to point to at least six 25 basis point Fed rate hikes in the coming 24-36 months, based on early 2022 data.
In the absence of wage growth on pace with the inflation rate, consumer sentiment may continue to decline, the potentiality of which would presumably serve as a headwind to economic growth fundamentals in the coming quarters without a reversal of the current inflationary trend.
To conclude, market performance in November was broadly negative, with positive returns generally witnessed among the highest-quality sectors of the bond market and within the domestic large cap growth equity space. Despite being only 18 months into the ongoing economic expansion, realized inflation rates meaningfully above trend have pulled forward the bond market’s expectation for increases to the Fed’s primary policy rate, which has been discounted to occur in mid-2022. Moreover, nominal employee wage growth stood below the inflation rate through November, resulting in eight consecutive months of negative employee wage growth in real terms, the recent trend of which has likely dented U.S. consumer sentiment, which deteriorated to a 10-year low on the month.
Market Returns
Global Equity
-
Global equity markets rose during the fourth quarter of 2021 due in part to strong earnings. Volatility increased in November as the highly infectious COVID-19 Omicron variant began spreading globally. Volatility quickly subsided, however, as emerging data suggested the new variant was less severe than previous COVID-19 strains.
-
Small cap stocks underperformed large cap stocks during the quarter due to a fear of weaker future growth prospects in the small cap universe. The Fed’s signaling of rising rates concerned investors who worried increased rates could adversely affect small cap companies that do not have strong balance sheets and need access to cheap lines of capital for growth.
-
Although high beta was the best-performing factor within the S&P 500 Index in 2021, its opposite factor, low volatility, was the best-performing factor for the quarter, which returned just below 10% for December.
-
Europe faced an energy crisis during the quarter as the limited supply of Russian gas began to dwindle. As a result, gas and electricity prices rose sharply across the continent, coupled with falling investments in thermal energy and maintenance work on nuclear power plants.
-
Chinese equities significantly under-performed global equities due in part to the continued growth of COVID-19 resurgence concerns, as well as market participants digesting the ramifications of China’s regulatory push. Renewed geopolitical tensions also weighed heavily on the country’s market. In turn, given China’s significant weight within the index, the Chinese market’s underperformance weighed on the overall emerging market index.
Fixed Income
-
Heightened interest rate volatility led to opposing movements along the yield curve. The 10-year U.S. Treasury yield remained unchanged for the fourth quarter at 1.52%. However, the 10-year/2-year Treasury spread decreased 45 bps to 0.79%. Movement on the front end of the curve was driven by hawkish Fed policy—specifically the Fed increasing the pace of the taper from $30 billion per month to $60 billion per month and hot inflation prints. This accelerated timeline will allow the Fed to raise rates as early as March 2022. Chair Powell has communicated that the Fed will not raise interest rates until the taper is complete. Long rates decreased for the quarter as the onset of the COVID-19 Omicron variant increased doubts over long-term growth.
-
Economic data releases gave reason for concern for those with dovish sentiment during December. November’s read of the Consumer Price Index (CPI) rose 0.8% on a month-over-month basis and 6.8% for the trailing 12 months, the fastest pace in nearly 40 years. Although November’s non-farm payroll reading of 210,000 printed below expectations, the unemployment rate fell from 4.6% to 4.2% as the labor force participation rate ticked up 0.2% to 61.8%. The JOLTS survey identified more than 11 million job openings. Both inflation and labor readings suggest hawkish monetary policy should be a central theme in 2022.
-
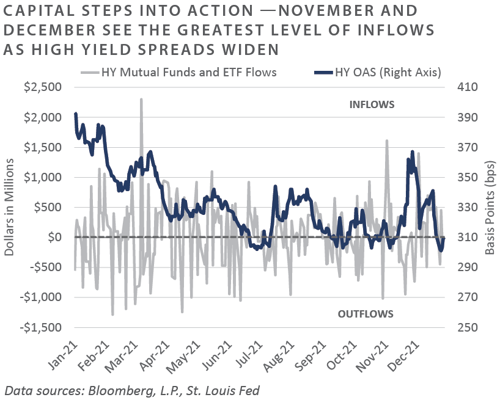
Despite spread volatility, below investment grade corporate bonds outperformed their investment grade counterparts. December’s return of 1.9% was the strongest monthly return of 2021. Technical factors contributed to performance. Since mid-December, a lack of new issue supply led to a supply-demand imbalance as investors looked to take advantage of Omicron-induced spread widening. December saw only $8.8 billion in new issues, significantly lower than November’s $29 billion.
-
For the first time, 2021 CMBS sales were dominated by single-asset single-borrower (SASB) loans, as investors were willing to buy single-name single assets due to relatively more straightforward underwriting versus conduit securities. Full-year SASB issuance totaled $77.8 billion, compared to $31.2 billion for diversified conduits. Due to these factors, the maturity wall for SASB securities has been extended past that of conduits. The market’s appetite for SASB relative to conduit new issue will likely be a key theme in the future. Furthermore, CRE CLOs saw a staggering 371% increase in issuance versus 2020, with over $45 billion of supply.
Real Assets
REAL ESTATE
-
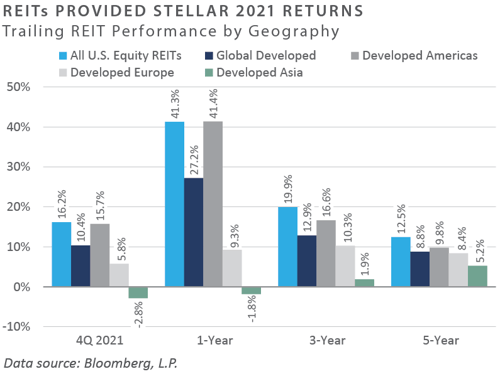
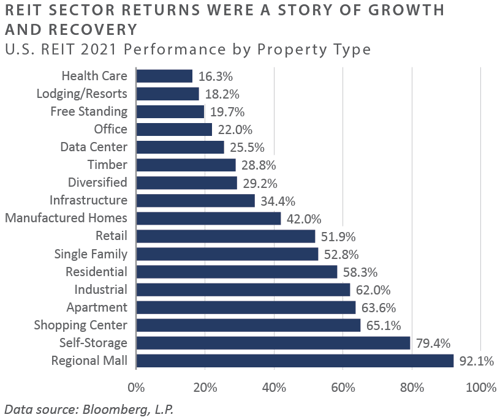
Despite concerns around the COVID-19 Omicron variant which emerged late in the year, U.S. REITs ended fourth quarter 2021 up 16.2% and finished the year with a gain of over 40%. Property sector trends remained consistent relative to previous quarters, while sectors tied to the “re-opening trade” (e.g., lodging, healthcare, and office) underperformed. In contrast, sectors considered defensive or experiencing supply-demand imbalances, such as industrial and single-family rentals, continued to have strong performance into year-end 2021.
-
Self-storage continues to attract capital, returning almost 80% for the year. The sector is viewed as a hedge against inflation because of its lower operational costs compared with property types that are more capital and labor-intensive. Month-to-month leases offer owners the ability to raise rents more frequently than properties with multi-year leases. Finally, the continued improvement in domestic employment has resulted in worker migration, driving demand for storage. As such, self-storage REITs have experienced attractive supply-demand dynamics, resulting in increased pricing power across the U.S.
NATURAL RESOURCES
-
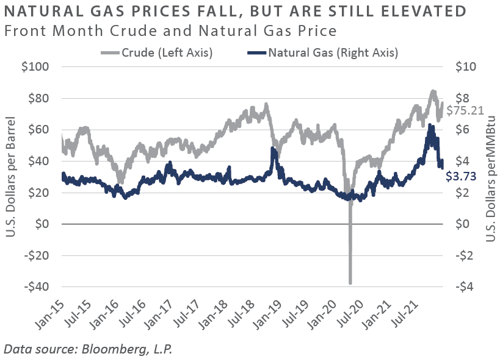
Although oil markets experienced significant volatility during the fourth quarter, prices finished the period relatively unchanged at approximately $75/bbl from the third quarter. Following a shock in late November, oil markets showed positive momentum into year-end, recovering to end the year with a gain of approximately 55% for 2021.
-
During the fourth quarter, natural gas prices moderated with an approximately 36% decrease from the previous high. However, relative to year-end 2020, natural gas prices have increased roughly 46%. Forward price fundamentals remain attractive as the world decarbonizes, emphasizing low-carbon power sources such as natural gas to help bridge traditional energy production to renewables. The U.S. recently became the largest exporter of liquid natural gas, overtaking Russia, and now supplies much of the demand from Asia and Europe, regions rapidly becoming more dependent on natural gas for heating and power generation.
-
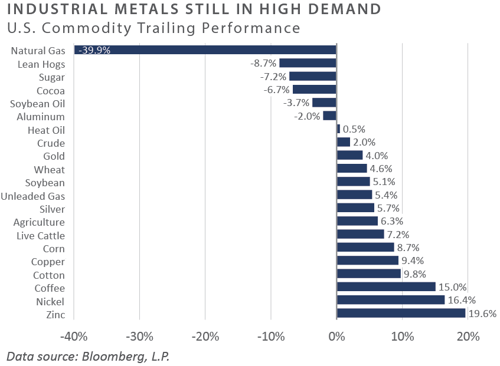
As measured by the Bloomberg Commodity Index (BCOM), commodity prices ended the quarter down 1.6%. Negative performance was primarily driven by natural gas and agricultural commodities such as lean hogs, sugar, and cocoa. Input metals such as zinc, nickel, and copper outperformed during the quarter. However, the index rose 27.1% for the whole year, as pent-up consumer demand, supply chain disruptions, and short labor supply resulted in increased demand for input materials and decreased available production and supply of commodities.
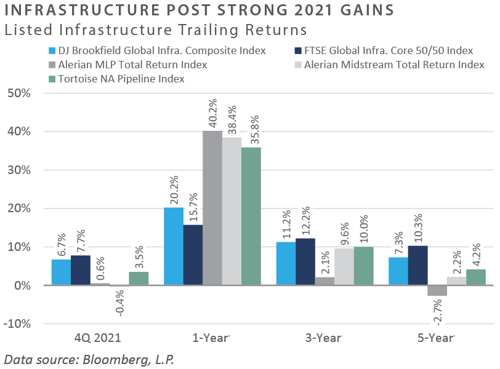
INFRASTRUCTURE
-
Midstream energy infrastructure, as measured by the Alerian MLP Index, remained relatively flat on the back of moderating energy prices, ending the quarter up 0.6%. Continued uncertainty regarding domestic oil demand, inflationary concerns, moderating energy prices, and unclear future domestic upstream production contributed to the flat performance of the quarter.
-
Listed infrastructure stocks, as measured by the FTSE Global Core Infrastructure 50/50 Index, ended the fourth quarter up 7.7%. Performance for the quarter was primarily driven by railroads and water and electric utilities. Infrastructure names exhibited volatility on the quarter as investors grappled with concerns around COVID variants; however, previously beaten-down sectors benefitted from alleviating variant concerns.
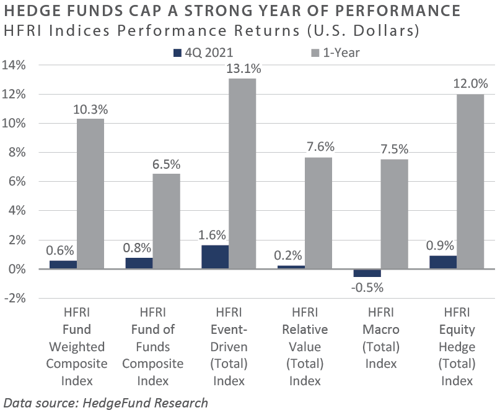
Diversifying Strategies
-
Hedge funds finished the year with solid performance across most of the strategies for the quarter. Event-driven and hedged equity strategies led performance to add to solid returns for 2021.
-
Within event-driven, activist managers enjoyed the most significant success rising over 5% in December. Special situations manager returns were also largely positive, as equity markets provided a tailwind to equity-oriented hedge fund strategies.
-
Hedged equity strategies witnessed significant gains in the healthcare and technology/healthcare sectors, which faced substantial price volatility to end the year. The largest detractor was the dedicated technology sector which faced pressures to end the year.
-
Within the global macro space, discretionary trading fared better than their systematic counterparts. Although, both strategies generated positive performance at the index level.
INDICES
The Alerian MLP Index is a composite of the 50 most prominent energy Master Limited Partnerships that provides investors with an unbiased, comprehensive benchmark for this emerging asset class.
Barclays Capital Fixed Income Indices is an index family comprised of the Barclays Capital Aggregate Index, Government/Corporate Bond Index, Mortgage-Backed Securities Index, and Asset-Backed Securities Index, Municipal Index, High-Yield Index, and others designed to represent the broad fixed income markets and sectors within constraints of maturity and minimum outstanding par value. See https://ecommerce.barcap.com/indices/index.dxml for more information.
The CBOE Volatility Index (VIX) is an up-to-the-minute market estimate of expected volatility that is calculated by using real-time S&P 500 Index option bid/ask quotes. The Index uses nearby and second nearby options with at least 8 days left to expiration and then weights them to yield a constant, 30-day measure of the expected volatility of the S&P 500 Index. FTSE Real Estate Indices (NAREIT Index and EPRA/NAREIT Index) includes only those companies that meet minimum size, liquidity and free float criteria as set forth by FTSE and is meant as a broad representation of publicly traded real estate securities. Relevant real estate activities are defined as the ownership,
HFRI Monthly Indices (HFRI) are equally weighted performance indexes, compiled by Hedge Fund Research Inc. (HFX), and are used by numerous hedge fund managers as a benchmark for their own hedge funds. The HFRI are broken down into 37 different categories by strategy, including the HFRI Fund Weighted Composite, which accounts for over 2000 funds listed on the internal HFR Database. The HFRI Fund of Funds Composite Index is an equal weighted, net of
J.P. Morgan’s Global Index Research group produces proprietary index products that track emerging markets, government debt, and corporate debt asset classes. Some of these indices include the JPMorgan Emerging Market Bond Plus Index, JPMorgan Emerging Market Local Plus Index, JPMorgan Global Bond Non-US
Merrill Lynch high yield indices measure the performance of securities that pay interest in cash and have a credit rating of below investment grade. Merrill Lynch uses a composite of Fitch Ratings, Moody’s and Standard and Poor’s credit ratings in selecting bonds for these indices. These ratings measure the risk that the bond issuer will fail to pay interest or to repay principal in full. See www.ml.com for more information.
Morgan Stanley Capital International – MSCI is a series of indices constructed by Morgan Stanley to help institutional investors benchmark their returns. There
Russell Investments
S&P 500 Index consists of 500 stocks chosen for market size, liquidity and industry group representation, among other factors by the S&P Index Committee, which is a team of analysts and economists at Standard and Poor's. The S&P 500 is a market-value weighted index, which means each stock’s weight in the index is proportionate to its market value and is designed to be a leading indicator of U.S. equities, and meant to reflect the risk/return characteristics of the
Information on any indices mentioned can be obtained either through your advisor or by written request to information@feg.com.
DISCLOSURES
This report was prepared by FEG (also known as Fund Evaluation Group, LLC), a federally registered investment adviser under the Investment Advisers Act of 1940, as amended, providing non-discretionary and discretionary investment advice to its clients on an individual basis. Registration as an investment adviser does not imply a certain level of skill or training. The oral and written communications of an adviser provide you with information about which you determine to hire or retain an adviser. Fund Evaluation Group, LLC, Form ADV Part 2A & 2B can be obtained by written request directly to: Fund Evaluation Group, LLC, 201 East Fifth Street, Suite 1600, Cincinnati, OH 45202, Attention: Compliance Department.
The information herein was obtained from various sources. FEG does not guarantee the accuracy or completeness of such information provided by third parties. The information in this report is given as of the date indicated and believed to be reliable. FEG assumes no obligation to update this information, or to advise on further developments relating to it. FEG, its affiliates, directors, officers, employees, employee benefit programs and client accounts may have a long position in any securities of issuers discussed in this report.
Index performance results do not represent any managed portfolio returns. An investor cannot invest directly in a presented index, as an investment vehicle replicating an index would be required. An index does not charge management fees or brokerage expenses, and no such fees or expenses were deducted from the performance shown.
Neither the information nor any opinion expressed in this report constitutes an offer, or an invitation to make an offer, to buy or sell any securities.
Any return expectations provided are not intended as, and must not be regarded as, a representation, warranty or predication that the investment will achieve any particular rate of return over any particular time period or that investors will not incur losses.
Past performance is not indicative of future results.
Investments in private funds are speculative, involve a high degree of risk, and are designed for sophisticated investors.
All data is as of December 31, 2021 unless otherwise noted.