Hold The Line
FEG’s 2022 Fixed Income Market Outlook took readers on a stroll down memory lane. Specifically, it highlighted the bond kings and distressed queens of past and present and the duration tailwind that began in the 1980s. The outlook recapped the distressed opportunity created by the Great Financial Crisis (GFC) of 2008-2009 and the bloated Federal Reserve balance sheet left in its wake. It concluded that heading into 2022, only “pork and beans” returns would be available to fixed income investors, with core bonds yielding less than 2% and the effective duration—i.e., interest rate sensitivity—increasing to nearly seven years. In other words, not enough yield to compensate investors for the rate risk involved.
A Year to Forget
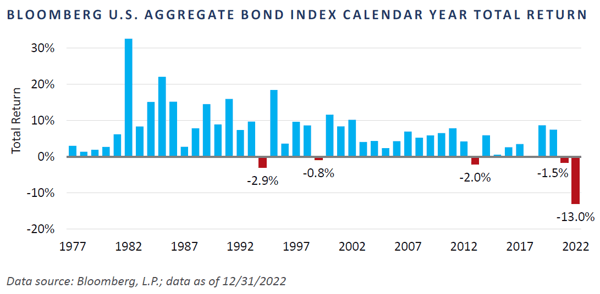
The suppositions presented in the outlook proved reasonable enough, although fixed income investors would have gladly accepted a steaming bowl of pork and beans, instead of what transpired. In what ultimately became the worst year for bonds since the Great Bond Massacre of 1994 (-2.9%), the Bloomberg U.S. Aggregate Bond Index (BAGG) lost an astonishing 13% in 2022, almost five times worse than 1994’s decline. Adding insult to injury, the decline in 2022 followed a 1.5% loss in 2021, marking the first-ever back-to-back calendar year decline, and the fifth calendar year loss since the BAGG’s inception in 1976.
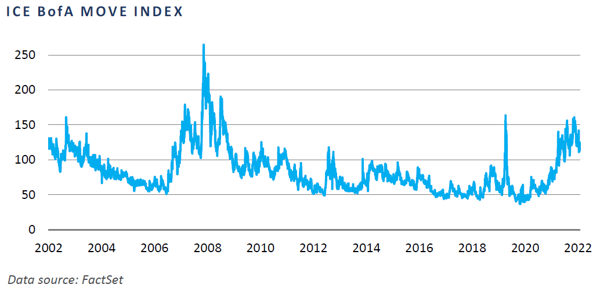
Interest rate volatility ruled 2022, as shown by the ICE BofA MOVE Index. In fact, the level of interest rate volatility witnessed throughout the year has not been seen since the lead-up to the GFC and the sharp spike following the collapse of Lehman Brothers in 2008. The 10-year U.S. Treasury yield peaked at 4.3% on October 20, 2022, an astounding 276 basis point increase from its 1.54% yield at the end of 2021. From October 20 to the end of the year, the 10-year Treasury yield dipped to 3.42% on December 7 before reversing course and ending the year at 3.88%.
Silver Lining of the Great Reset
The silver lining of the Great Reset of 2022 was the resetting of investment-grade bond yields at higher levels—and prices at lower levels—which has created one of the most attractive price opportunities in quite some time for the BAGG and its primary sub-sectors of agency residential mortgage-backed securities (RMBS), corporate bonds, and U.S. Treasuries. However, when considering buying a “used car” like the BAGG—or a strategy benchmarked to it like core fixed income—it is worth raising the hood before making the purchase.
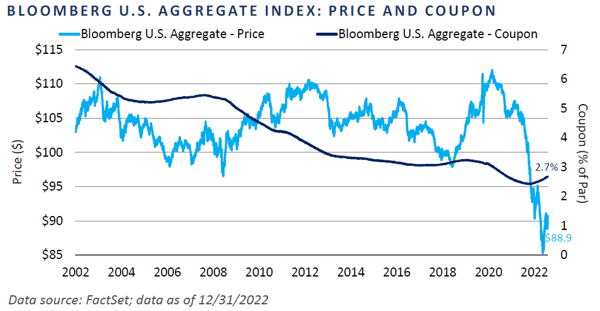
In 2022, the BAGG price reached the low $90s, and its yield exceeded 5% for the first time since 2008. That sounds wonderful on the surface, and fixed income managers are pounding the table highlighting the opportunity, but before driving off into the sunset in that souped-up old jalopy, consider the slow and steady decline in coupons over the past 14 to 15 years. After all, coupons temper the impact of price declines by providing interest income as bonds approach maturity.
When yields last exceeded 5% in 2008, coupons were also a bit higher than 5%. In 2023, coupons are less than 3%, which means the price of the BAGG must decline further in order to coerce new investors into accepting the low coupons of today. Yields have been historically low for some time, primarily due to the extended zero-interest rate policy (ZIRP) utilized by the Federal Reserve for nearly a decade following the GFC and rekindled with aplomb during the COVID years. Coupons followed a slow and steady decline that took more than a decade to settle at historically low levels. With a weighted average maturity of 8.4 years for the BAGG, it will take years of new issuance at higher levels for investment-grade bond coupons to meaningfully increase and catch up to yields.
Should Investors Increase the Duration of Their Fixed Income Portfolios?
The uptick in interest rate volatility witnessed throughout 2022 suggests ambiguity in consensus among market participants. On one hand, the 2-year/10-year Treasury curve moved deeply into inverted territory in mid-2022, indicating the bond market believes the Federal Reserve has already overextended its interest rate hiking cycle and should reverse course. On the other hand, the Federal Reserve is ignoring the yield curve inversion and has pushed forward with its hawkish rhetoric. Various Federal Reserve presidents consistently comment about taking the overnight federal funds rate above 5% and holding it there until inflation adjusts lower. FEG believes the Federal Reserve is trying to avoid a repeat of its stop-and-go monetary policy of the 1970s, which alternated between fighting high unemployment and high inflation. We believe this tug of war is the primary narrative in play for fixed income investors heading into 2023.
Going back to the used car analogy, fixed income investors are trying to determine if interest rates have peaked and whether they should increase their duration profile. If so, they would be seeking to benefit from a potential return to the low-rate environment they had become accustomed to since the post-GFC period and leading up to 2022’s inflation flare-up.
FEG’s 2022 outlook discussed the extended duration of the BAGG as it approached 7 years—well above its historical average of 4.5 years—suggesting that investors consider moving the duration of their fixed income portfolio closer to that of the Bloomberg Intermediate Aggregate Index (BIAGG), which was in line with the historical average duration of the BAGG (4.5 years). While this situation has come up in prior fixed income outlooks, it is FEG’s view that a shift in duration that is more in line with the BIAGG merely reflects a rebalancing of interest rate risk back to the historical average of the BAGG, since the index duration has increased stealthily right under the noses of most fixed income investors. Additionally, the coupon situation for the BIAGG will likely be resolved faster than for BAGG investors, as the weighted average maturity for the index at the end of 2022 was 3 years shorter than for the BAGG, at 5.4 years and 8.4 years, respectively.
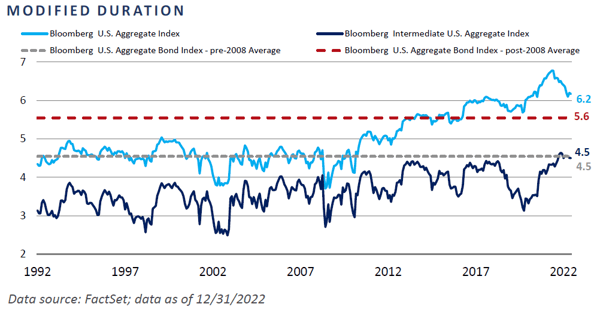
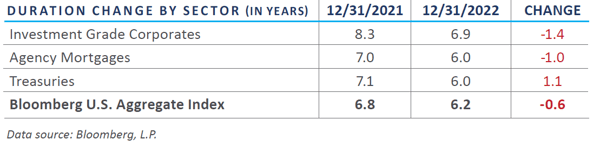
Rising yields in 2022 helped bring the duration of the BAGG back down to 6.2 years, which remains elevated versus its historical average of 4.5 years since the measure’s inception in 1976.1 Breaking out the key sectors of the BAGG shows that higher interest rates had the most meaningful impact on declining durations for investment-grade corporates and agency RMBS. The U.S. Treasury component of the BAGG saw its duration decline by approximately a year, moving from 7.1 years to 6.0 years. Interestingly, because the BIAGG holds 6% more in agency RMBS versus the BAGG, its duration has increased.
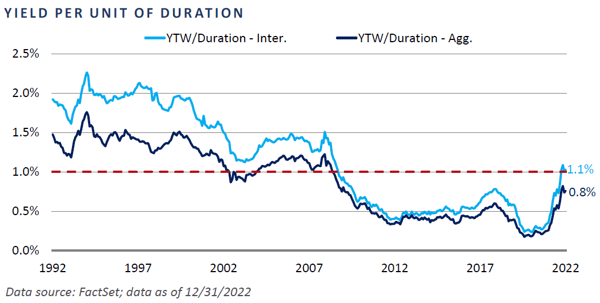
Despite the recent decline in the duration of the BAGG, there has not been enough convergence between the two indices for FEG to recommend adjusting fixed income portfolios back to the duration profile of the BAGG. Importantly, the BAGG retained only a 0.1% yield advantage versus the BIAGG—4.7% versus 4.6%—by the end of 2022. As a result, on a yield per unit of duration basis, investors using the BIAGG duration profile retain an advantage of 1.1% versus 0.8% for the BAGG.
In the event interest rates decline meaningfully in 2023, the BAGG would outperform the BIAGG. Interestingly, the 10-year U.S. Treasury has already declined ~50 basis points in the first month of 2023, and the return differential between the BAGG and the BIAGG has been ~80 basis points in favor of the BAGG due to its longer duration Nevertheless, FEG believes investors who view their core bond allocations as a portfolio stabilizer should maintain a duration profile similar to the BIAGG and hold the line, knowing that interest rate volatility cuts both ways and will impact the BAGG to a greater degree than the BIAGG in either direction.
The Great Reset Impact on Below-Investment-Grade Securities
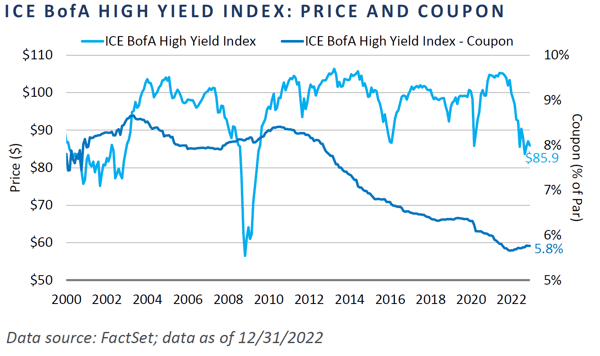
Prices, spreads, and yields look reasonably valued following the Great Reset, yet high-yield bonds have the same coupon problem plaguing the BAGG and its constituents. There is a “good news/bad news” element to lower coupons for high-yield bonds. The good news for corporate issuers is that many termed out their debt maturities during the COVID years to take advantage of exceptionally low borrowing costs, making it easier for them to service their debt through a potential downturn. The bad news for high-yield investors is that interest income from coupons—the necessary elixir to help offset a further decline in prices—is coming off its lows of the past 25 years or so at 5.8%.
This marks a meaningful difference versus prior price declines in 2015 and 2020, when coupons were well above 6%, and significantly lower than the GFC drawdown when coupons were more than 8%. As in the scenario for the BAGG, it will also take time for coupons to reset higher for high-yield bonds. This is not meant to suggest fixed income is not currently an attractive asset class, as it is relatively more attractive than last year, but modest coupons curb our enthusiasm.
We believe the 5.8% high-yield coupon should act as reasonable support to additional price declines, suggesting investors who currently maintain an allocation to the space should continue to hold the line. Higher debt service costs due to the Federal Reserve’s rate-hiking efforts will create challenges for companies—particularly for issuers using floating rate bank loans in their capital structures. This situation is likely to negatively impact profit margins to the extent that companies have been or will be unable to pass on price increases to customers.
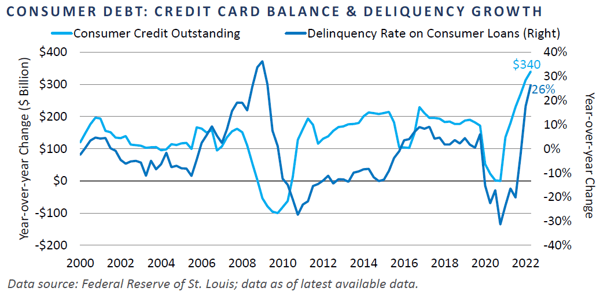
Indeed, consumers have been increasing their use of credit card debt to maintain their standard of living, and delinquency rates appear to be in the early stages of going parabolic as they begin to approach GFC levels. Something must ultimately give in this situation, and with the Federal Reserve focused on increasing pain to households through further rate hikes in 2023, FEG anticipates an increase in corporate downgrades and higher default rates, which is likely to have a further negative impact on prices at some point in 2023 or perhaps 2024.
Timeframe for Distressed Investments
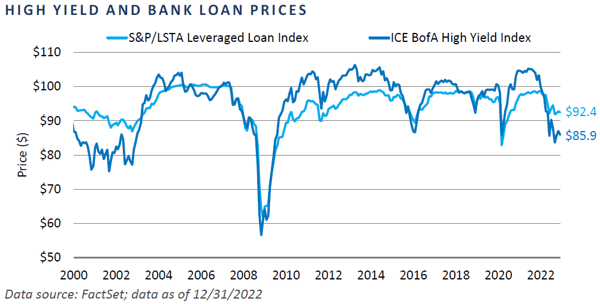
Distressed debt strategies tend to invest in bank loans and high-yield bonds as their primary entry point, with the goal of either selling at higher valuations or restructuring their debt for equity interests they hope to sell later at great profit. Following the Great Reset of 2022, roughly 50% of the high-yield bond market was priced below $90—on par $100—by year-end and ~13% was priced below $80. While fixed income investors love their coupons, distressed debt investors love their discounted dollar prices on bonds and loans. At the end of the year, bank loans traded at $92.4 on average, while high-yield bonds were priced at $85.9.
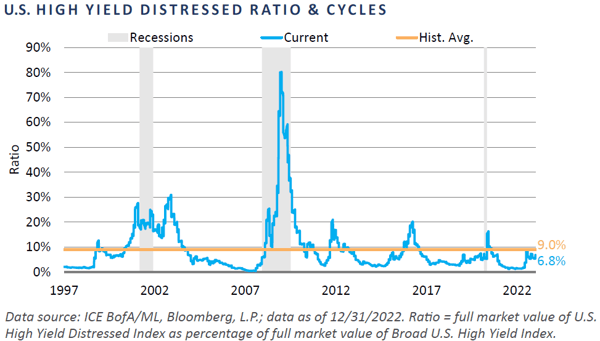
Due primarily to higher Treasury rates, material spread widening did not take place during the year, as option-adjusted spreads for the Bloomberg High Yield Index ended the year at 4.7%, 60 basis points within the historical average of 5.3%. Furthermore, on a yield-to-worst basis, the Bloomberg High Yield Index was 9%—interesting, but a far cry from the nearly 12% high in March 2020 and well below the 11% to 14.5% range witnessed during the 2001 recession, which some are comparing to the current environment. With spreads well below distressed levels—typically considered to be 1000 basis points or higher versus Treasuries—the distressed ratio at the end of the year was only slightly elevated.
Despite the lack of broad-based distressed opportunities, distressed investment managers smell blood in the water. A continuation of asset and interest rate volatility led by a still-hawkish Federal Reserve sets the stage for 2023. Macro uncertainty lingers regarding global recessionary risks, inflation, and China’s reopening. Market sentiment is decidedly bearish, leading some to question how much recessionary risk has been priced into the credit and equity markets.
Unsurprisingly, these issues have led managers to come to the market in 2022 and 2023 with new distressed funds on top of existing distressed funds that are yet to be fully deployed. Preqin places existing distressed dry powder at ~$70 billion. This number includes both new funds being raised and undeployed capital raised for distressed opportunities in 2020 and 2021. While $70 billion is a large number, within the context of a ~$3 trillion market for bank loans and high-yield bonds, this sum could easily be overwhelmed by another repricing of risk assets. FEG has relationships with a number of managers experienced in the credit markets offering drawdown vehicles to take advantage of what appears to be an interesting environment for distressed.
Conclusion
Heading into 2023, FEG sees the themes of 2022 gradually moving to the background, as much of the Great Reset of higher interest rates and risk assets at lower prices reflect the early stages of a regime shift. This regime shift includes a hawkish Federal Reserve focused on reducing its balance sheet through quantitative tightening. It also includes a backdrop that marks the complete opposite construct of its easy ZIRP ways of the past decade and one that is likely less positive for risk assets overall. The markets remain volatile, as traditional fixed income managers point to the tremendous value created in the wake of the carnage of the Great Reset. Interestingly, most of these same managers were unable to steer clear of meaningful losses in 2022, due primarily to their benchmark-driven mandates.
FEG continues to see downside risk to the markets as economic conditions move toward recession. Credit downgrades are likely to increase due to higher debt service costs gradually impacting levered companies, making defaults likely to rise from their current low levels. FEG sees reasonably attractive price and yield opportunities for fixed income investors; however, given the relatively long-weighted average maturities for key fixed income indices, coupons will take time to reset higher. As such, fixed income investors are recommended to hold the line on interest-rate-sensitive portfolios and look for a better tactical opportunity to add credit risk if prices decline further. Distressed investment opportunities are likely to increase, so we believe investors should consider allocating to experienced credit investors offering drawdown investment vehicles.
Duration Example:
Time to maturity: The longer the maturity, the higher the duration and the greater the interest rate risk. Consider two bonds that yield 5% and cost $1,000 but have different maturities. The bond that matures faster would repay principal and interest faster than the bond that matures more slowly. Consequently, the shorter-maturity bond would have a lower duration and less interest rate risk.
Coupon rate: A bond’s coupon rate is a key factor in the duration calculation. If two bonds are identical except for their coupon rates, the bond with the higher coupon rate will pay back its original costs faster than the bond with a lower yield. The higher the coupon rate, the lower the duration and the lower the interest rate risk.
DISCLOSURES
Bloomberg Index Services Limited. BLOOMBERG® is a trademark and service mark of Bloomberg Finance L.P. and its affiliates (collectively “Bloomberg”). Bloomberg or Bloomberg’s licensors own all proprietary rights in the Bloomberg Indices. Bloomberg does not approve or endorse this material or guarantee the accuracy or completeness of any information herein, nor does Bloomberg make any warranty, express or implied, as to the results to be obtained therefrom, and, to the maximum extent allowed by law, Bloomberg shall not have any liability or responsibility for injury or damages arising in connection therewith
This report was prepared by Fund Evaluation Group, LLC (FEG), a federally registered investment adviser under the Investment Advisers Act of 1940, as amended, providing non-discretionary and discretionary investment advice to its clients on an individual basis. Registration as an investment adviser does not imply a certain level of skill or training. The oral and written communications of an adviser provide you with information about which you determine to hire or retain an adviser.
The information herein was obtained from various sources. FEG does not guarantee the accuracy or completeness of such information provided by third parties. The information in this report is given as of the date indicated and believed to be reliable. FEG assumes no obligation to update this information, or to advise on further developments relating to it.
Neither the information nor any opinion expressed in this report constitutes an offer, or an invitation to make an offer, to buy or sell any securities.
Any return expectations provided are not intended as, and must not be regarded as, a representation, warranty or predication that the investment will achieve any particular rate of return over any particular time period or that investors will not incur losses.
Past performance is not indicative of future results.
This report is prepared for informational purposes only. It does not address specific investment objectives, or the financial situation and the particular needs of any person who may receive this report.
Fund Evaluation Group, LLC, Form ADV Part 2A & 2B can be obtained by written request directed to: Fund Evaluation Group, LLC, 201 East Fifth Street, Suite 1600, Cincinnati, OH 45202 Attention: Compliance Department.