Reassessing Renewables: Investing Beyond the Hype
One would have difficulty overstating the frenzy around investment strategies under the broad labels of “clean energy, energy transition, environmental, social, and governance (ESG), climate tech, renewables, and sustainability” over the past several years. Indeed, investors have clamored to get exposure to all things “green,” often allocating capital to speculative securities, such as special purpose acquisition companies (SPAC) in the public market and private funds targeting renewable energy. As the energy transition investment environment matures beyond the frenzy of the past several years, investors should reassess the landscape and consider a broader opportunity set of strategies that encompass all aspects of the ongoing energy transition.
To illustrate the frenzy, there were 70 SPAC deals tied to renewable energy or sustainability between March 2020 and September 2021, according to the Wall Street Journal.1 The Wilder Hill Clean Energy index, a proxy for publicly traded companies in clean energy, rose over 200% in 2020 but declined 30% in 2021 and 46% in 2022, as demand from investors faded with the sharp decline in technology stocks in 2022.2
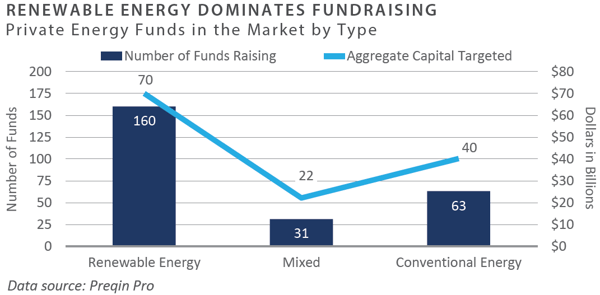
Further, private infrastructure funds targeting renewables comprised 69% of the private infrastructure funds raised in 2021. As shown below, the number of private funds targeting renewable energy in 2022 dwarfed those pursuing conventional energy.3 Brookfield, which raised $15 billion for its energy transition fund, now plans to raise $20 billion for its next fund. Investors seem to have an insatiable appetite for funds with a “green” label. A FundFire article in March titled An Energy Transition Free for All captured the essence of the hype, pointing to the massive sums of capital raised, stating, “Alternative firms of all stripes are pressing forward to stake out a corner in the market.” 4
After the Hype - Reality Check
In recent months, however, there have been emerging headwinds across the renewable energy/energy transition landscape, which indicate challenges associated with the widespread adoption of renewables. For example, JP Morgan’s Annual Energy Paper released in March, Growing Pains: The Renewable Transition in Adolescence, pointed out that “after $6.3 trillion spent on renewable energy and another $3.3 trillion spent on electricity networks since 2005, global energy use is still ~80% reliant on fossil fuels.”5
Competing pressures around climate issues and energy security are among the concerns facing the energy transition, along with procuring the materials for electrification and navigating the complexities around connecting to the power grid.
In this environment, it is prudent to step back and assess the obstacles and complexities in the energy transition. None of this is to say the energy transition is not progressing, with massive resources directed at cutting carbon emissions, but rather it means investors must be cognizant of fundamental challenges that will take years to resolve and manage.
- "Net-Zero By 2050": This is by far the most ubiquitous mantra adopted by governments and corporations to demonstrate their commitment to combating climate change, but how realistic are these targets? The Sierra Club stated:
"Reliable, quantifiable methods of carbon capture and sequestration do not exist yet at the scale necessary to help meet those targets. When countries promise that they can reach net zero without making sharp cuts to emissions in the next decade, those claims should not be taken at face value."6
It is also worth noting that CEOs and government leaders making Net-Zero by 2050 pledges today may likely be retired or out of office long before having to account for these commitments when 2050 rolls around.
-
Levelized Cost of Wind and Solar (LCOE): LCOE has long been a popular metric when describing the positive attributes of clean energy production from a cost standpoint. It is defined as the average minimum price at which the electricity generated by an asset is required to be sold to offset the total production costs over its lifetime. While the calculated LCOE for renewable energy is low (mainly because wind and solar are free resources), this metric measures the marginal cost but fails to account for the need for backup power. Further, it does not consider additional capital or operating costs. While on the surface wind and solar appear to be cost-competitive and sometimes cheaper than traditional energy sources, like natural gas or coal, this does not accurately capture all-in costs and can be misleading.
To quote Paul Joskow, former Director of the MIT Center for Energy and Environmental Policy Research,
"COE is inappropriate for comparing intermittent generating technologies like wind and solar with dispatchable generation...and also overvalues intermittent generating technologies compared to dispatchable baseload generation."7
-
Renewable Power and Connectivity: Building a wind or solar project is only one part of the lengthy, costly, and bureaucratic process of bringing renewable energy to the market. Ultimately, these projects must be connected to the grid, and gaining the needed approvals and permits can be a multi-year process. According to research from Lawrence Berkeley National Laboratory, nearly one terawatt of solar photovoltaic capacity was in U.S. interconnection queues at the end of 2022, with total renewables interconnection queues up 40% from last year. On average, it took a new power generation project 35 months to go from the interconnection request being filed with a grid operator to an agreement being reached. The result has been a major bottleneck for developing renewable energy projects, as they take longer to complete the interconnection study process and come online.8
Navigating the Evolving Landscape: Considerations for Investors
With literally hundreds of funds (public and private) targeting clean energy or energy transition across a range of risk/return profiles, investors face a dizzying array of options when looking to invest capital while at the same time looking to gauge the actual impact on climate change accurately. Adding to the challenge is the limited track record of many funds in the market raising capital. A highly-selective approach is necessary as investors seek to sift through the myriad offerings within the universe of energy transition strategies. While the projections around the required investment to decarbonize measure in the trillions of dollars, this does not necessarily mean all investments made will be profitable.
Adjacent Strategies in Renewables: Outside the Box
At first glance, some of the less obvious investments, may seem outside the scope of an allocation to renewables or clean energy. However, may offer attractive returns by accessing areas not widely pursued by the broader investment community, simultaneously incorporating a more expansive view of the energy transition. In other words, looking beyond traditional wind, solar, and battery projects can yield a range of compelling opportunities, as demonstrated through the following examples:
- Battery Metals: There is a growing recognition that to meet stated goals for clean energy adoption (electric vehicles, wind, and solar power), the energy transition will require massive amounts of basic materials, such as copper, nickel, lithium, and cobalt, among others. The average electric vehicle requires over two times the amount of copper as an internal combustion engine vehicle, and offshore wind projects use nine times the minerals of a natural gas-fired power plant.9 Copper is central to electrification, with few viable substitutes, and copper production is concentrated in a small number of regions, primarily South America. Investments in the global mining sector present potentially attractive opportunities that tie into the energy transition theme.
- Traditional Power Generation: The reality of wind and solar power is that it is intermittent by nature. Sunshine and wind do not always match up with consumer power demand, meaning there is a need for stable, baseload power that can be dispatched on demand to consumers. Sporadic (or intermittent) power will not be widely accepted. The sources of baseload power come from natural gas plants or, in some cases, nuclear power plants. Preqin’s 2023 Infrastructure Outlook noted, “the intermittency of renewables and insufficient energy storage currently leave grids exposed, threatening the reliability of supply."10
- "Picks and Shovels": Broadly defined, these strategies invest in companies that offer products or services used in various aspects of power generation, transportation, or servicing the power grid. Rather than building or owning wind farms, solar projects, or battery storage assets, businesses (often backed by growth equity funds) are engaged in energy efficiency, charging infrastructure, industrial and maintenance services tied to the clean energy infrastructure, and specific products driving energy efficiency.
One such example falls within nuclear energy, which currently comprises 18% of total electricity generation in the U.S. and contributes more than half of the country’s carbon-free electricity. Maintaining the stability of nuclear power infrastructure is important to achieving decarbonization regardless of whether any new nuclear power generation is added. Investing in businesses involved in maintaining and servicing the existing nuclear grid is one potential opportunity.
Rethinking the Role of Hydrocarbons
There is a growing recognition that fossil fuels will remain part of the energy mix for the foreseeable future. In its Annual Energy Paper, JP Morgan states:
"[We] remain totally unconvinced that starving the oil & gas industry of capital will make the transition go any faster, particularly since new pools of capital will step in as long as demand for fossil fuels exists. Such an approach could also expose countries to energy shortages that renewables are currently unable to fill.”11
Additionally, Preqin states:
“The idealism of recent years that drove a push toward renewables, and de-prioritized hydrocarbon generation, has met the reality of a world that still relies on conventional energy sources."
Recent events (i.e., the war in Ukraine) have demanded rethinking the energy transition, with many being forced to acknowledge that we cannot simply substitute carbon-intensive conventional energy with renewables.” 12 The massive investment in clean energy/renewable projects undertaken during the past decade has failed to impact oil demand. According to the International Energy Agency’s April report, these investments are expected to reach a record high in 2023 of 101.9 million barrels per day, with China accounting for 90 percent of growth.13 Thus, hydrocarbons and renewables are better viewed as complements, not substitutes.
Conclusion - The Rubber Meets the Road (or PowerPoint Meets Excel)
The broad energy transition investment backdrop has matured as the hype of the bubble years subsides, and the actual work of building companies and assets begins. As the idealism of the energy transition begins to meet the problematic physical realities of procuring materials and adding power to the grid, the industry faces tough decisions and investors must reconsider broader approaches to allocating capital.
Ultimately, sustainable investing must be combined with sustainable investment strategies with long- term staying power. With so many investment ideas being touted under the labels of “renewables" (transitions, green, etc.), many are still unproven and may or may not be viable longer-term. As investors evaluate the energy investment landscape, a holistic viewpoint incorporating all available sources will be necessary over the coming years.
1, 9, 10, 11 Amrith Ramkumar, 'SPAC Deals Shrink After Speculation Wanes', The Wall Street Journal, January 20, 2023
2 Invesco, Wilder Hill, March 31, 2023
3 Preqin, Global Listed Infrastructure Outlook – 2023
4 Colon, Shalya, “An Energy Transition Free-for-All: Buyout, Infra Managers Pile In,” FundFire, March 15, 2023
5 JP Morgan, Eye on the Market Annual Energy Paper, March 2023
6 Gerhardt, Tina, “The Problem with Net Zero”, The Sierra Club, November 10, 2021
7 JP Morgan, Eye on the Market Annual Energy Paper, March 2023
8 Berkeley National Labs, "Queued Up: Characteristics of Power Plants Seeking Transmission Interconnection”, April 2023
9 Preqin, Global Listed Infrastructure Outlook – 2023
10, 12, 13 IEA, April 2023
PRIVATE EQUITY
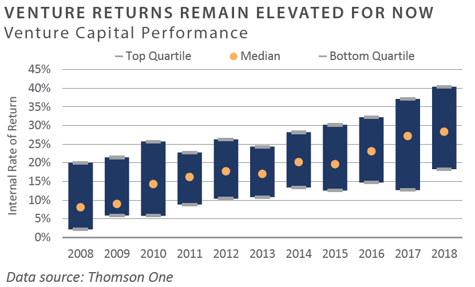
Venture Capital
- Venture capital fundraising and investment activity was muted for the quarter as participants continued to adjust to the post-COVID environment. Exit activity ground to a halt due to falling valuations and a more risk-averse sentiment. Anecdotally, venture capitalists indicate they are preparing companies for a very different economic environment in the coming years, with an emphasis on profitability rather than growth at all costs.
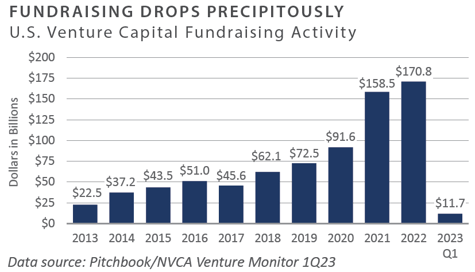
- U.S. venture funds raised $12 billion in the first quarter, reflecting a more normalized - albeit different - environment than the last several years. The first quarter pace would compare to the average annual fundraising amount from 2010-2019 which was $40 billion. Fundraising spiked significantly in the last several years as investors sought potential returns from the private markets.
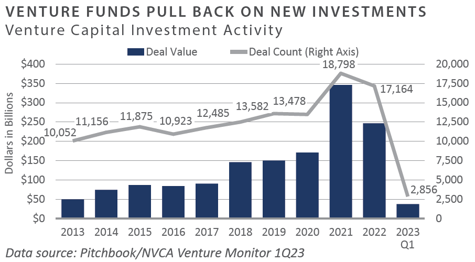
- Investment activity is also returning to pre-COVID levels. Venture funds invested $37 billion in the first quarter, continuing the trend that began in the second half of last year. On an annualized basis, 2023 may look more similar to 2018 and 2019 than the previous three years.
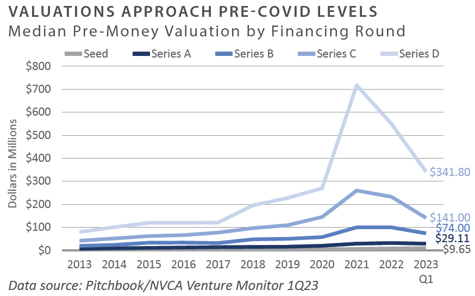
- Pre-money valuations continue to fall as they return to pre-COVID levels. Late-stage (Series D) valuations experienced a dramatic rise and subsequent fall through 2021 and 2022 as investor appetite for risk mitigated in the current environment.
- The pullback in the exit market over the quarter was swift and robust. Exit activity was the lowest in a decade as the initial public offering (IPO) window shut.
- Venture performance through the third quarter of 2022 - the most recent available - is off recent highs. Returns will be affected if the exit markets remain closed and hold periods extend.
INVESTOR IMPLICATIONS
We believe investors should be prepared for volatility due to high valuations and capital flows.
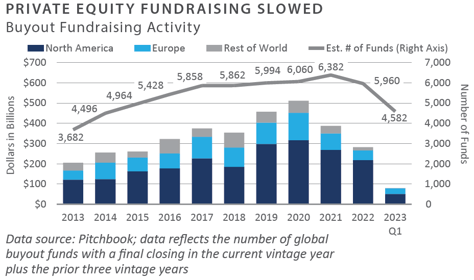
Leveraged Buyouts
- Globally, private equity (PE) raised more than $80 billion during the first quarter of 2023.1 Approximately 63% of funds were in North American and 36% in Europe.2 PE fundraising in Asia and the rest of the world struggled.
- U.S. private equity deal activity slipped slightly during the first quarter of 2023, with quarterly deal value and volume falling 4% and 1%, respectively, from the same time in the prior year.3 Trailing 12-month (TTM) value and volume decreased 21% and 4%, respectively.4 Add-on transactions represented nearly 80% of deal activity in the quarter.5
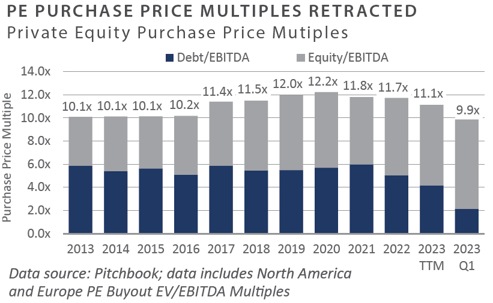
- During the first quarter of 2023, private equity purchase price multiples contracted marginally. As of March 31, 2023, the TTM median private equity buyout purchase price multiple was 11.1x earnings before interest, taxes, depreciation, and amortization (EBITDA).6 The TTM median Debt/EBITDA ratio was 4.2x EBITDA.7
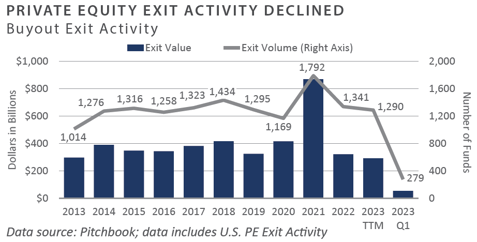
- U.S. exit activity was limited during the first quarter. Quarterly exit value and volume fell 34% and 15%, respectively, from the same time last year.8 TTM exit value and volume were also down 62% and 25%, respectively.9
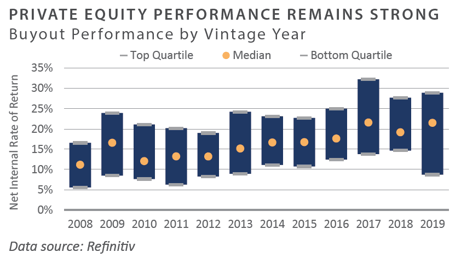
- PE performance was strong through the third quarter of 2022, the most recent period available. The spread between the top and bottom quartiles remained above 1,000 basis points.10 FEG expects performance to contract in the fourth quarter.
INVESTOR IMPLICATIONS
Economic headwinds, tighter credit conditions, and concerns about valuations stymied fund- raising, investment, and exit volumes. Clients are advised to remain cautious with new commitments in the current environment.
1, 2, 3, 4, 5, 6, 7, 8,9 Pitchbook; Data of March 31, 2023
10 Refinitiv; Data as of September 30, 2022 (Most recent available)
Private Debt
-
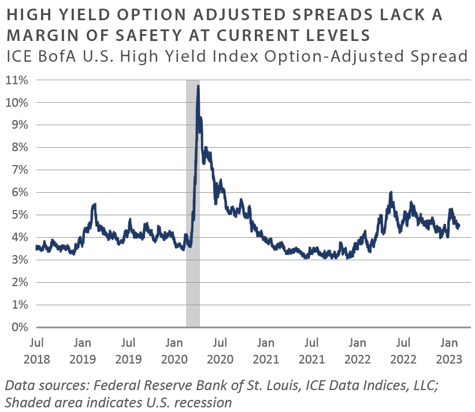
The first quarter of 2023 saw a rally in the public credit markets, with high yield bonds gaining 3.7% and bank loans gaining 3%. These moves were indicative of an oversold market heading into the fourth quarter, which improved investor demand for risky assets generally. High yield option-adjusted spreads lack a margin of safety at current levels.
-
The higher interest rate environment and concerns of a pending recession led to anemic new issuance in the first quarter. This has been particularly evident in the lack of activity in the mergers and acquisition space.1
-
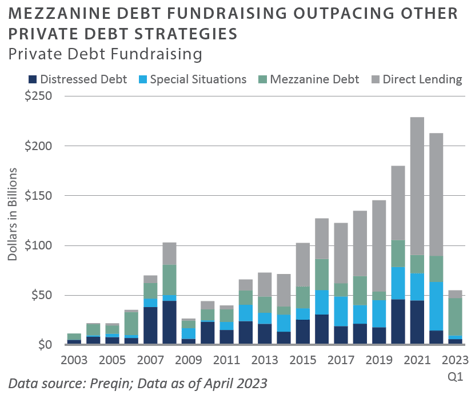
Mezzanine debt fundraising significantly outpaced other private lending strategies in the first quarter, bolstered by several large funds in the market. As of the end of the first quarter, Preqin showed $37.7 billion being raised for mezzanine debt versus $7.7 billion for direct lending, $5.6 billion for distressed, and $3.8 billion for special situations.2
-
Due in part to the failures of Signature Bank and Silicon Valley Bank and lingering pressures on other banks, private lenders are seeing increased demand for their capital. The continuation of bank pressures bodes well for this type of capital in the short-to-intermediate term.
INVESTOR IMPLICATIONS
Macroeconomic pressures, late-cycle credit characteristics, and stress on the banking system provide a meaningful opportunity for private debt as an asset class. Institutions with fresh balance sheets are well-positioned to benefit from increased investment opportunities.
1 Pitchbook/LCD Quarterly Review 1Q 2023
2 Preqin Global Report 1Q 2023
Private Real Estate
- The National Council of Real Estate Investment Fiduciaries (NCREIF) Property Index (NPI) declined 1.8% during the first quarter and fell 1.6% on a trailing 1-year basis. This followed a decline of 3.5% in the fourth quarter of 2022.
-
Hotel and retail properties outperformed for the quarter. Hotels continued to benefit from higher occupancy rates. All other property sectors declined, with the office sector declining 4.6% for the quarter and 8.8% on a trailing 1-year basis. The sector faced headwinds from remote working trends and high vacancy rates.
-
Market value-weighted cap rates based on appraisals for unsold properties in the index increased to 4.3%, compared to 4.0% in the prior quarter. However, the average cap rate for properties sold during the quarter was significantly higher, at 5.6%.1
- The disparity between the performance of public and private real estate markets narrowed as private real estate funds reported lower valuations at year-end, reflecting the impact of higher interest rates on property values. Compared to private real estate, real estate investment trust (REIT) valuations are more compelling on several metrics, including higher implied cap rates and lower debt levels.
-
Transaction volume declined 58% to $77 billion in the first quarter, the lowest since 2013. Multifamily and office volume showed the most substantial declines, each falling more than 60%. Multifamily is facing considerable headwinds, with approximately 450,000 new units expected to hit the market in 2023 and rent growth showing signs of slowing. Office volume dipped to $10.7 billion, the lowest first-quarter total since 2010.
- During the first quarter, 108 private equity real estate funds raised approximately $56 billion. The number of funds in the market remained at a record high, with 1,971 funds seeking to raise $538 billion as of April 2023.2 Notably, in April, Blackstone completed fundraising on its tenth flagship private real estate fund, with total commitments of $30.4 billion, making it the largest private real estate fund ever raised.
- Availability of credit for commercial real estate tightened significantly in the wake of the collapse of Silicon Valley Bank in the first quarter. Total Commercial Mortgage- Backed Security (CMBS) issuance fell to just under $6.0 billion during the first quarter, down 12% from the fourth quarter and more than 79% year-over-year.3 Two high-profile defaults on office properties in the first quarter illustrated the sector’s significant distress. Brookfield defaulted on a $784 million loan tied to two offices in Los Angeles, and Pacific Investment Management Company (PIMCO) defaulted on $1.7 billion in loans tied to office properties in multiple cities.4
INVESTOR IMPLICATIONS
The factors that drove the decade-plus bull market have reversed, and real estate faces multiple headwinds as valuations continue to reset lower. Higher interest rates and declining fundamentals—e.g., net operating income and occupancies—will continue to weigh on valuations in the coming quarters. The collapse of Silicon Valley Bank in the first quarter and First Republic Bank in the second quarter led to a focus on commercial banks’ exposure to real estate and may likely lead to tighter credit availability. Debt maturities will be a primary focus for investors in the coming year. Given the early stages of the downturn and ongoing uncertainty, it is premature for buyers to take advantage of distress in the market; however, we believe those with capital to deploy should be well-positioned in the coming quarters to acquire attractively valued assets.
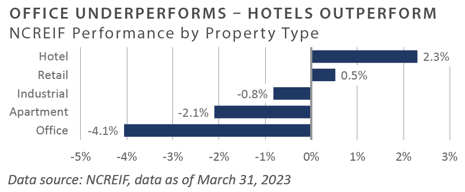
1 NCREIF; data of March 31, 2023
2 Preqin, data as of April 30, 2023
3 Trepp, data as of March 31, 2023
4 Grant, Peter, "Office Landlord Defaults Are Escalating as Lenders Brace for More Distress", The Wall Street Journal, February 23, 2023
NATURAL RESOURCES
-
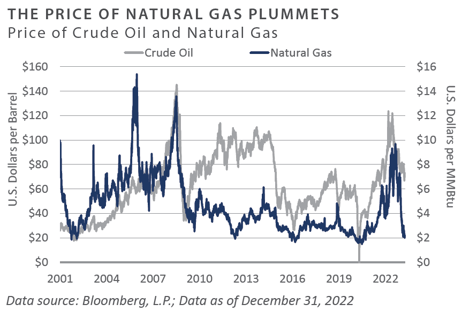
Oil prices fell 5.7% during the first quarter, closing the quarter at $75.67/barrel, compared to $80.26/barrel at year-end 2022. Concerns about slower global economic growth and a potential recession weighed on prices.1
-
In mid-March, prices had fallen below $70/barrel. In early April, however, OPEC+ announced a surprise production cut of 1.16 million barrels/per day, which sent prices back above $80/barrel.2
-
Also in April, the International Energy Agency (IEA) announced a forecast for global oil demand to reach a record high of nearly 102 million barrels/day in 2023, with most of the gain coming from non-OECD countries.3 U.S. oil and gas companies announced record profits for 2022 during the first quarter.
-
Natural gas prices fell 50% in the first quarter to close at $2.22/MMBtu compared to $4.48/ MMBtu at year-end. Warmer winter weather during the first quarter led to lower prices as production outstripped demand and the volume of gas in storage rose.4
-
The U.S. natural gas market remains over-supplied, and drillers are expected to cut back production in the coming months. Natural gas prices are expected to remain under pressure until next year when new export terminals begin to come online, which should boost U.S. export capacity.5
-
Private equity energy managers have returned to the market en masse, with over 20 firms actively raising capital for funds targeting upstream and midstream investments as of the first quarter of 2023. The ability of these managers to successfully raised new capital will be a key indicator of the appetite among institutional investors for upstream energy funds, which has been limited by fossil fuel divestment initiatives. Among the more prominent groups currently fundraising for upstream private energy are Natural Gas Partners, EnCap, Lime Rock Partners, Urban Oil and Gas, Merit Energy, Kayne Anderson, and Scout Energy Partners.
-
Mergers and acquisition activity in the upstream energy sector showed signs of improving after falling to its lowest level in over 15 years during 2022. In early April, EnCap announced the sale of multiple assets in the Permian basin to Ovintiv for $4.3 billion. Also in April, EnCap-backed Sabalo announced the sale of a mineral royalty package to Kimbell Royalty Partners. Finally, rumors emerged that ExxonMobil might acquire Pioneer Natural Resources on speculations that Exxon is looking to expand in the Permian basin and deploy its record cash balance.6
-
The U.S. rig count declined for the first time since 2020, as upstream energy companies remain cautious about capital spending. According to Baker Hughes, the total U.S. rig count for oil and gas declined 3% to 755 - compared to 779 rigs at the ends of 2022. As a frame of reference, the U.S. oil rig count peaked at 1,600 in the fall of 2014. Rig counts reflect the reluctance of energy companies to increase capital expenditures, despite higher commodity prices.7
INVESTOR IMPLICATIONS
While there are indications that some investors may be open to considering allocations to traditional upstream private energy into 2023, uncertainty remains. This is due in part to the “denominator effect,” in which the improvement in the performance of private energy has ironically led to some investors being overweight relative to their targets. Energy remains one of the only sectors in the private capital landscape that has not seen significant inflows. This is also the case in the public markets. Despite the S&P 500 Energy sector gaining 65% in 2022, fund flows from public equity investors have been limited relative to other sectors, such as information technology.
1,4 Energy Information Administration, www.eia.gov, March 31, 2023
2 Ahmed Rasheed, "OPEC+ announces surprise oil output cuts," Reuters, April 2, 2023
3 International Energy Agency April, 2023
5 Dezember, Ryan, Natural-Gas Prices Plunge, and Drillers Dial Back, The Wall Street Journal, February 23, 2023
6 PR Newswire, April 3, 2023, The Wall Street Journal, April 7, 2023
7 Baker Hughes; Data of December 31, 2022
INDICES
Bloomberg US Corporate High Yield Index represents the universe of fixed rate, non-investment grade debt. Eurobonds and debt issues from countries designated as emerging markets are excluded, but Canadian and global bonds (SEC registered) of issuers in non-EMG countries are included. The index includes the corporate sectors: Industrials, Utilities, and Finance, encompassing both U.S. and non-U.S. Corporations. See www.bloomberg.com for more information.
The Russell Indices are constructed by Russell Investment. There are a wide range of indices created by Russell covering companies with different market capitalizations, fundamental characteristics, and style tilts. See www.russellinvestments.com for more information.
The FTSE NAREIT Composite Index (NAREIT) includes only those companies that meet minimum size, liquidity and free float criteria as set forth by FTSE and is meant as a broad representation of publicly traded REIT securities in the U.S. Relevant real estate activities are defined as the ownership, disposure, and development of income-producing real estate. See www.ftse.com/Indices for more information.
The S&P 500 Index is capitalization-weighted index of 500 stocks. The S&P 500 Index is designed to measure performance of the broad domestic economy through changes in the aggregate market value of 500 stocks representing all major industries.
The NCREIF Property Index is a quarterly time series composite total rate of return measure of investment performance of a very large pool of individual commercial real estate properties acquired in the private market for investment purposes only.
HFRI ED: Distressed/Restructuring Index — Distressed/Restructuring strategies which employ an investment process focused on corporate fixed income instruments, primarily on corporate credit instruments of companies trading at significant discounts to their value at issuance or obliged (par value) at maturity as a result of either formal bankruptcy proceeding or financial market perception of near term proceedings. Managers are typically actively involved with the management of these companies, frequently involved on creditors' committees in negotiating the exchange of securities for alternative obligations, either swaps of debt, equity or hybrid securities. Managers employ fundamental credit processes focused on valuation and asset coverage of securities of distressed firms; in most cases portfolio exposures are concentrated in instruments which are publicly traded, in some cases actively and in others under reduced liquidity but in general for which a reasonable public market exists. In contrast to Special Situations, Distressed Strategies employ primarily debt (greater than 60%) but also may maintain related equity exposure.
Information on any indices mentioned can be obtained either through your advisor or by written request to information@feg.com.
DISCLOSURES
This report was prepared by Fund Evaluation Group, LLC (FEG), a federally registered investment adviser under the Investment Advisers Act of 1940, as amended, providing non-discretionary and discretionary investment advice to its clients on an individual basis. Registration as an investment adviser does not imply a certain level of skill or training. The oral and written communications of an adviser provide you with information about which you determine to hire or retain an adviser. Fund Evaluation Group, LLC, Form ADV Part 2A & 2B can be obtained by written request directly to: Fund Evaluation Group, LLC, 201 East Fifth Street, Suite 1600, Cincinnati, OH 45202, Attention: Compliance Department.
The information herein was obtained from various sources. FEG does not guarantee the accuracy or completeness of such information provided by third parties. The information in this report is given as of the date indicated and believed to be reliable. FEG assumes no obligation to update this information, or to advise on further developments relating to it. FEG, its affiliates, directors, officers, employees, employee benefit programs and client accounts may have a long position in any securities of issuers discussed in this report.
Index performance results do not represent any managed portfolio returns. An investor cannot invest directly in a presented index, as an investment vehicle replicating an index would be required. An index does not charge management fees or brokerage expenses, and no such fees or expenses were deducted from the performance shown.
Bloomberg Data Disclosure: Source- Bloomberg Index Services Limited. BLOOMBERG® is a trademark and service mark of Bloomberg Finance L.P. and its affiliates (collectively “Bloomberg”). Bloomberg or Bloomberg’s licensors own all proprietary rights in the Bloomberg Indices. Bloomberg does not approve or endorse this material or guarantee the accuracy or completeness of any information herein, nor does Bloomberg make any warranty, express or implied, as to the results to be obtained therefrom, and, to the maximum extent allowed by law, Bloomberg shall not have any liability or responsibility for injury or damages arising in connection therewith.
Neither the information nor any opinion expressed in this report constitutes an offer, or an invitation to make an offer, to buy or sell any securities.
Any return expectations provided are not intended as, and must not be regarded as, a representation, warranty or predication that the investment will achieve any particular rate of return over any particular time period or that investors will not incur losses.
Past performance is not indicative of future results.
Investments in private funds are speculative, involve a high degree of risk, and are designed for sophisticated investors.
An investor could lose all or a substantial amount of his or her investment. Private capital funds’ fees and expenses may offset private capital funds’ profits. Private capital funds are not required to provide periodic pricing or valuation information to investors except as defined in the fund documents. Private capital funds may involve complex tax structures and delays in distributing important tax information. Private capital funds are not subject to the same regulatory requirements as mutual funds. Private capital funds are not liquid and require investors to commit to funding capital calls over a period of several years; any default on a capital call may result in substantial penalties and/or legal action. Private capital fund managers have total authority over the private capital funds. The use of a single advisor applying similar strategies could mean lack of diversification and, consequently, higher risk.
All data is as of March 31, 2023 unless otherwise noted.