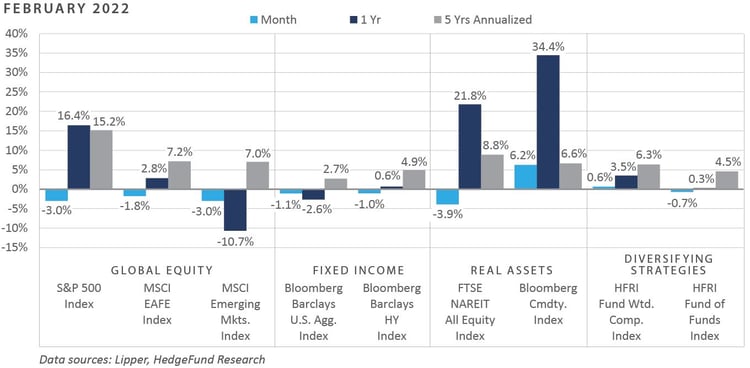
Russia’s invasion of Ukraine dominated the geopolitical backdrop in February, driving market volatility sharply higher and reigniting investor worries of a global systemic crisis. Assets which tend to perform best during periods of sharply rising energy prices, such as commodities and value-oriented equities, continued to generate relatively strong performance in February, as well as in the first few trading days in March. Across the global equity landscape, emerging market equities—which began the year with solid relative outperformance versus domestic equity in January—faced meaningful headwinds in the latter half of the month, with growing contagion risk sparked by the Russian attack of Ukraine weighing on investor sentiment. Bond returns were broadly negative in February, with rate-sensitive sectors facing headwinds in the way of a continued “hot” inflationary environment and credit-sensitive sectors encountering renewed volatility amid rising credit risk premiums. Performance across the real assets complex was mixed, with REITs continuing to face challenges in the way of increasing interest rates and renewed prospects for a turndown in economic growth. At the same time, commodities—particularly energy—generated substantially positive returns amid surging oil and natural gas prices.
Economic Update
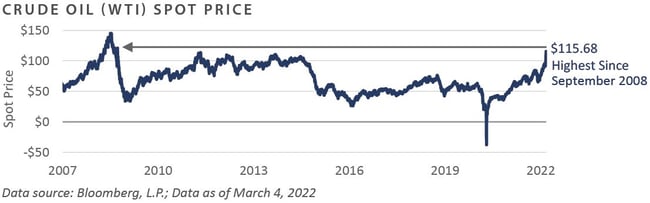
Russia’s Invasion of Ukraine Sends Oil Price to Highest Level Since Global Financial Crisis
News of Russia’s invasion of Ukraine in late February sent ripples across the globe, as fears of a destabilized geopolitical order amid a potential reassembling of the Soviet Union by Russian President Vladimir Putin provided a strong catalyst for the revival of financial market volatility.
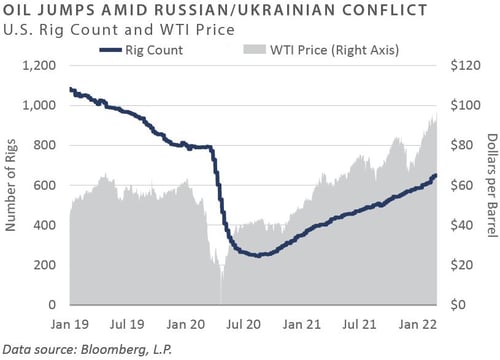
Already faced with an enduring energy crisis before the Russian invasion of Ukraine, concerns are mounting across Europe of a sharp slowdown in economic activity, which would have wide-ranging implications for broader global growth dynamics, including domestically. Oil prices, which increased more than 50% in 2021, have gained an additional 50%+ year-to-date through early March, with WTI spot prices now at their highest level since 2008.
Substantial economic sanctions on Russia and the seizing of Russian financial market activity have essentially made the country uninvestable, with some major index providers dropping Russia from their constituency altogether. Moreover, through premiums required to protect against a Russian sovereign default, global investors are demanding the highest compensation to hedge this risk since the Global Financial Crisis. The cost to protect against a Russian sovereign default over the coming 1-year period has surged to more than 6,000 basis points, compared to the previous peak of approximately 1,150 basis points in 2009.
The ongoing crisis across Eastern Europe puts the Federal Reserve (Fed) in a particularly difficult position. On the one hand, recent sharp price declines across risk assets add to the mounting uncertainty regarding financial market stability, which ordinarily would necessitate a cautious approach to guiding investors through a period of monetary tightening. Moreover, model-based estimates of first-quarter economic growth reflect the potential for a 0% real GDP print, and the slope of the Treasury yield curve continues to flatten–both of which serve as headwinds to an overly hawkish Fed.
On the other hand, with headline and core inflation at 40-year highs and likely to keep running meaningfully above the Fed’s target, as well as a labor market reflecting meaningful strength—including a sub-4% unemployment rate in February—the Fed risks harming their credibility if they fail to execute on their dual mandate, which has pointed to the need to tighten policy since last summer.
Bond market participants continue to price in nearly six 25 basis point rate hikes throughout 2022 and a potential hike in 2023. Still, they are discounting the Fed to reverse course in 2024, with policy easing implied by the eurodollar futures curve in the one year from March 2024 to March 2025. Growing sentiment for this policy reversal on the horizon has coincided with a sharp flattening of the Treasury yield curve, which has declined to approximately 20 basis points between the spread on 2-Year and 10-Year Treasury notes.
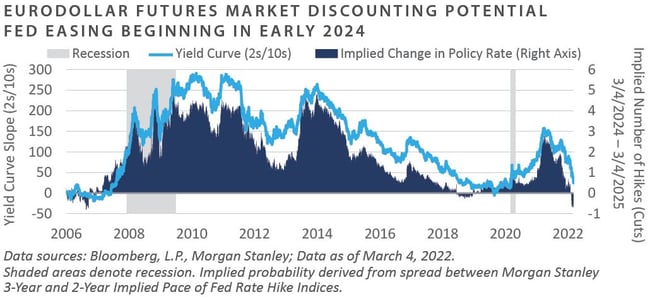
To conclude, Russia’s invasion of Ukraine in late February has put the world on edge, reviving fears of a broader military conflict and its potentially dire consequences. After entering the year with strong positive momentum, commodity prices have continued to increase—particularly across energy, where crude oil spot prices jumped to a 14-year high. Despite a modest shallowing of the Fed’s anticipated near-term tightening path, bond market participants continue to discount numerous increases to the federal funds rate in 2022, the tightening of which is expected to reverse potentially as soon as early 2024.
Market Returns
Global Equity
-
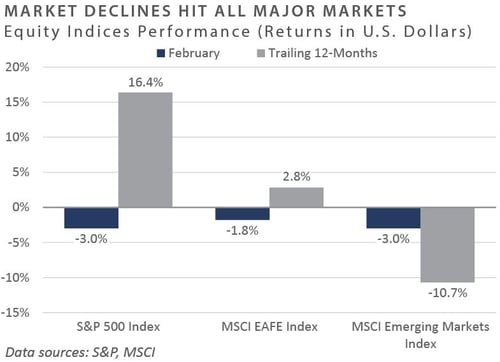
Global equity markets continued an inflationary and geopolitically induced sell-off in February. At the start of the month, investors retreated from risky assets as central banks across the world signaled tighter monetary policy, causing bond yields to rise and valuations to contract. Global equities continued their sell-off upon Russia’s invasion of Ukraine at the end of the month, which negatively impacted emerging market equities.
-
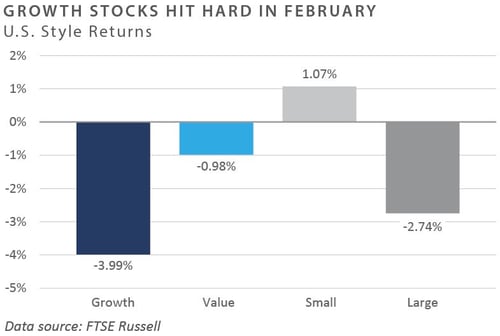
Equities continued to trade off macro-economic news causing a headwind for equity markets across the globe. Value continued to outperform growth, as energy and utility sectors drove performance due to rising oil, commodity, and energy prices.
-
Although rising inflation and interest rates have put pressure on the earnings outlook, fourth-quarter earnings results were strong. Of the 95% of S&P 500 companies that had reported their earnings for the previous quarter by the end of February, 76% reported a positive earnings surprise, and 78% reported a positive revenue surprise.
-
Europe ex-UK equities were especially hard hit due to the start of the Russia/Ukraine war. The European Union depends heavily on Russian commodity exports; approximately 25% of its crude oil imports and 40% of its natural gas imports come from Russia. Western nations’ quick sanctioning of Russian companies and oligarchs adversely impacted performance, as energy supply became more limited, prices climbed higher, and large European bank valuations fell. Meanwhile, UK equities were relatively flat for the month. The Bank of England started the month by raising interest rates 25 bps, as the UK economy continues to see a strong recovery with inflation more subdued than in the U.S. The region benefitted from minimal exposure to Russian energy, as UK oil and mining industries drove market performance.
-
Japanese equity returns were slightly negative, as Japan has minimal direct trading exposure to Russia. Thus, the Russian-Ukrainian conflict had only a marginal direct impact on the Japanese economy. However, the war implies a longer time frame of higher energy prices than previously expected, potentially increasing long-term inflationary expectations for the country, which has struggled with deflation.
-
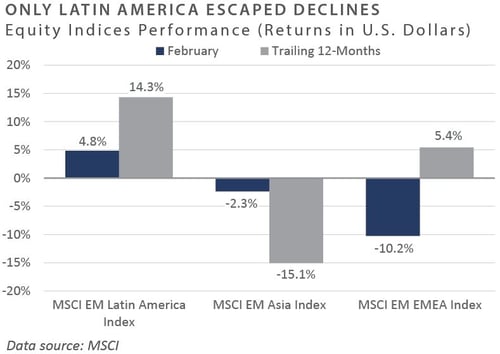
Emerging market (EM) equities were significantly affected by the actions of Russia, as Russian equities and the ruble plummeted to near zero. As the month came to an end, MSCI reported that Russia would be removed from the Emerging Markets Index and all other residual indices, putting even more downward pressure on Russian equities and currency. Although many EM import countries, such as India, were hindered by rising energy prices, some nations benefitted from rising commodity prices as net exporters.
Fixed Income
-
Interest rate volatility once again captured the rates market for the month. During February, the 10-year U.S. Treasury yield rose 4 bps to breach the critical psychological 2.0% level before retreating to 1.83% amidst a flight to quality. Although long rates rallied, short rates—as measured by the 2-year Treasury—sold off when the curve began pricing in a hawkish Fed amidst rising commodity prices and red-hot CPI readings. These opposing dynamics continue to pressure the 10-year/2-year Treasury spread, which finished the month at 39 bps, the lowest level since March 2020. This widely followed barometer for recession expectations continued its march towards 0 bps through the first week of March, reaching a new cycle low of 24 bps on March 4, 2022.
-
Fears of stagflation have begun to creep back into the market on the back of soaring headline and core CPI prints and concerns of prolonged economic expansion. The Atlanta Fed’s GDPNow tool estimates a 0.0% year-over-year first-quarter GDP growth as of March 1, 2022. Furthermore, the median sell-side estimate for February’s CPI print comes in at a staggering 7.9% increase on a year-over-year basis. However, sell-side estimates still project growth moderating to long-term trends near 2.0% through 2024.
-
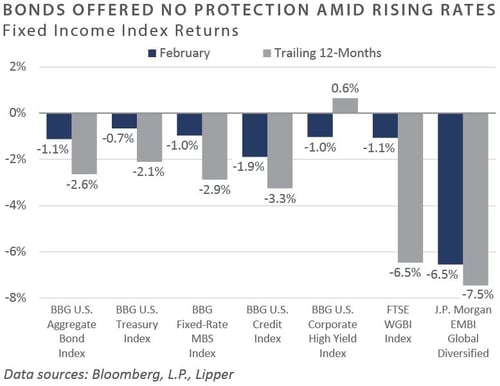
Corporate credit was not insulated from broader risk-off sentiment, with the Bloomberg Barclays U.S. Credit Index and Corporate High Yield Index returning -1.9% and -1.0%, respectively. High yield credit spreads were subject to volatile swings as Treasury yields and sentiment drove demand for credit. High yield funds have witnessed over $20 billion of outflows through the end of the first week of March, creating unfavorable liquidity within the asset class. Additionally, the new issue market remains weak, with issuers pulling deals due to market volatility. February marked a 23-month low in high yield issuance with only $9.3 billion of new paper coming to the market.
-
The average 30-year fixed-rate mortgage reached a cycle high of 3.9% as mortgage rates followed Treasury yields higher. Despite mortgage rates rising over 100 bps since December 2020, February’s S&P CoreLogic CS 20-City reading for December measured home price appreciation of 18.6%, 0.5% above the market expectation. However, pending home sales for January declined -9.1%, coming in below sell-side estimates of -1.8%. Cooling housing activity and rising mortgage rates have extended the effective duration of the Bloomberg US MBS (30Y) Index to roughly 5.0 years—markedly higher than the low reading of 1.3 years witnessed in March 2020. Given the movement in effective duration, extension and contraction risk have moved closer to parity, as extension risk had dominated the asset class over the past two years.
Real Assets
REAL ESTATE
-
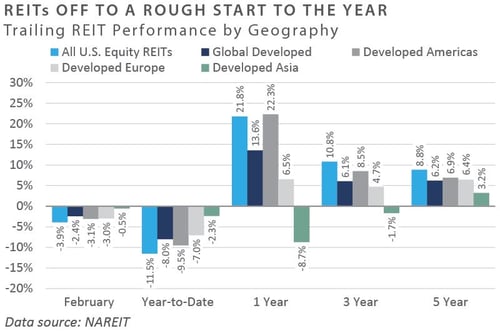
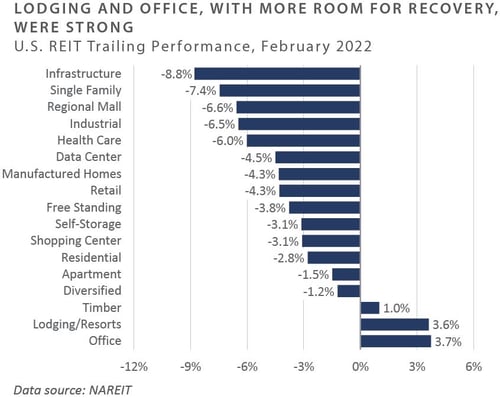
Publicly listed real estate continued to underperform through February 2022. Downward pressure during the beginning of the month came in the form of concerns over accelerated interest rate hikes, while geopolitical risks further pressured global markets. Infrastructure, single-family home rentals, regional malls, and industrial REITs posted the most significant declines, while office, lodging, and specialty REITs were the top performers for the month. The FTSE-NAREIT Index remained flat through the first week of March.
-
During the pandemic, office and lodging REITs have often underperformed relative to other REIT property types, including data centers, industrial, and cell towers. However, these sectors outperformed in February and year-to-date. Investor sentiment in these sectors improved on the decreased likelihood of pandemic-related government restrictions and lockdowns. Vacancy rates among the office and lodging sectors have remained below pre-pandemic levels, leaving room for both to catch up to the recoveries felt in other REIT sectors in 2021. In contrast, infrastructure and data center REITs continue to underperform in 2022.
NATURAL RESOURCES
-
Energy prices continued their strong trend of outperformance in February. After ending January at $88/barrel, crude oil prices rose 8.6% and finished the month at a multi-year high of nearly $96/barrel. Oil prices hovered in the low $90/barrel range for much of the month as the world assessed the growing threat of conflict in Eastern Europe and then reacted sharply to Russia’s invasion of Ukraine on February 24. Broad-based sanctions were imposed on Russia following the attack; however, as one of the largest exporters of crude oil, sanctions excluded oil and gas from Russia.
-
Sentiment changed through the first week of March, and markets began pricing in a more extensive embargo on Russian oil as of March 7, with future prices reaching $130/barrel with steep backwardation. Many multinational oil companies have announced severing ties to projects associated with Russia and Russian companies. Issues surrounding the actual spare capacity of OPEC and other oil-producing nations were already of concern, given steady demand increases over recent months.
-
Natural gas started the month at $4.85/MMBtu and experienced sharp volatility through the month, closing down 8.2% to $4.47/MMBtu, driven by warming weather across much of North America and Europe. However, European gas contracts remain elevated as the region grapples with the Russia-Ukraine conflict and its dependence on Russian-produced heating fuels.
-
Germany took decisive action in halting the certification of Nord Stream 2, the 750-mile pipeline running through the Baltic Sea that was completed in September 2021. The pipeline cannot move natural gas from Russia to Western Europe until certified. In the meantime, Germany announced on March 7 that it would not stop buying Russian natural gas through current pipelines, as Europe remains too dependent on Russian energy for power, heating, and industrial production to cut trade entirely.
-
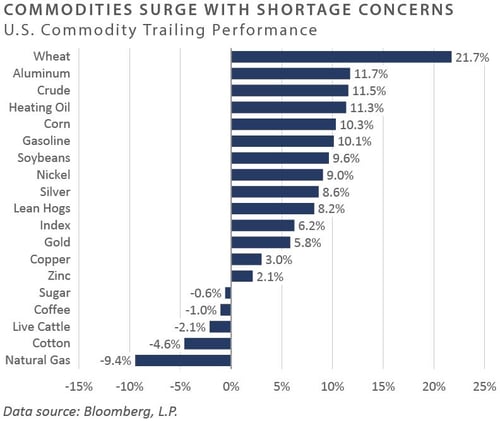
Commodity prices, as measured by the Bloomberg Commodity Index (BCOM), ended the month up 9.3% and up 15.6% year-to-date. Geopolitical events, strong consumer demand, supply chain disruptions, and short-labor supply contributed to solid demand for input materials and decreased the available production and supply of commodities. Demand for precious metals pushed prices higher, with gold seeing a gain of roughly 5.5% for the month and silver gaining approximately 8% over the same period.
INFRASTRUCTURE
-
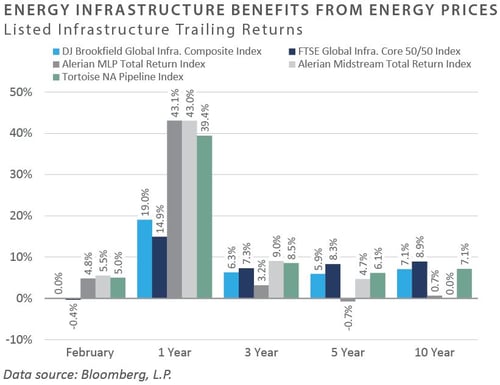
Midstream energy infrastructure, as measured by the Alerian MLP Index, outperformed the broader equity market on the back of rising energy prices and ended February with a gain of 4.8% after a strong January. North American-based midstream companies are expected to benefit from geopolitical concerns as the U.S. makes its way to becoming the world’s largest exporter of liquified natural gas (LNG) in 2022.
-
Listed infrastructure stocks, as measured by the FTSE Global Core Infrastructure 50/50 Index, ended the month roughly flat, falling just 0.4%. Pressure on growth-oriented equities continues to adversely impact renewable and technology-oriented listed equities further into 2022.
Diversifying Strategies
-
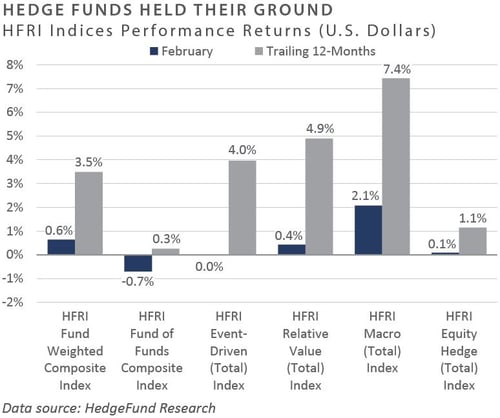
Broadly speaking, hedge funds have performed well in light of the market’s heightened level of volatility and uncertainty. The majority of hedge fund strategies saw flat to modest performance in February.
-
Global macro funds were beneficiaries of the recent commodity tailwind, with discretionary and systematic managers profiting from the supply/demand scarcity that caused prices to spike across several commodities, including oil and wheat.
-
Hedged equity managers navigated markets better in February than in January, as the broad index was essentially flat. Underlying performance was mixed, however, with energy sector specialists leading the positive performers while quantitative directional strategies struggled.
-
Event-driven managers held up reasonably well in the market swoon. The event-driven special situations strategy was the most significant outlier to the downside, but this strategy tends to be directional, emphasizing equity exposures.
INDICES
The Alerian MLP Index is a composite of the 50 most prominent energy Master Limited Partnerships that provides investors with an unbiased, comprehensive benchmark for this emerging asset class.
Barclays Capital Fixed Income Indices is an index family comprised of the Barclays Capital Aggregate Index, Government/Corporate Bond Index, Mortgage-Backed Securities Index, and Asset-Backed Securities Index, Municipal Index, High-Yield Index, and others designed to represent the broad fixed income markets and sectors within constraints of maturity and minimum outstanding par value. See https://ecommerce.barcap.com/indices/index.dxml for more information.
The CBOE Volatility Index (VIX) is an up-to-the-minute market estimate of expected volatility that is calculated by using real-time S&P 500 Index option bid/ask quotes. The Index uses nearby and second nearby options with at least 8 days left to expiration and then weights them to yield a constant, 30-day measure of the expected volatility of the S&P 500 Index. FTSE Real Estate Indices (NAREIT Index and EPRA/NAREIT Index) includes only those companies that meet minimum size, liquidity and free float criteria as set forth by FTSE and is meant as a broad representation of publicly traded real estate securities. Relevant real estate activities are defined as the ownership,
HFRI Monthly Indices (HFRI) are equally weighted performance indexes, compiled by Hedge Fund Research Inc. (HFX), and are used by numerous hedge fund managers as a benchmark for their own hedge funds. The HFRI are broken down into 37 different categories by strategy, including the HFRI Fund Weighted Composite, which accounts for over 2000 funds listed on the internal HFR Database. The HFRI Fund of Funds Composite Index is an equal weighted, net of
J.P. Morgan’s Global Index Research group produces proprietary index products that track emerging markets, government debt, and corporate debt asset classes. Some of these indices include the JPMorgan Emerging Market Bond Plus Index, JPMorgan Emerging Market Local Plus Index, JPMorgan Global Bond Non-US
Merrill Lynch high yield indices measure the performance of securities that pay interest in cash and have a credit rating of below investment grade. Merrill Lynch uses a composite of Fitch Ratings, Moody’s and Standard and Poor’s credit ratings in selecting bonds for these indices. These ratings measure the risk that the bond issuer will fail to pay interest or to repay principal in full. See www.ml.com for more information.
Morgan Stanley Capital International – MSCI is a series of indices constructed by Morgan Stanley to help institutional investors benchmark their returns. There
Russell Investments
S&P 500 Index consists of 500 stocks chosen for market size, liquidity and industry group representation, among other factors by the S&P Index Committee, which is a team of analysts and economists at Standard and Poor's. The S&P 500 is a market-value weighted index, which means each stock’s weight in the index is proportionate to its market value and is designed to be a leading indicator of U.S. equities, and meant to reflect the risk/return characteristics of the
Information on any indices mentioned can be obtained either through your advisor or by written request to information@feg.com.
DISCLOSURES
This report was prepared by FEG (also known as Fund Evaluation Group, LLC), a federally registered investment adviser under the Investment Advisers Act of 1940, as amended, providing non-discretionary and discretionary investment advice to its clients on an individual basis. Registration as an investment adviser does not imply a certain level of skill or training. The oral and written communications of an adviser provide you with information about which you determine to hire or retain an adviser. Fund Evaluation Group, LLC, Form ADV Part 2A & 2B can be obtained by written request directly to: Fund Evaluation Group, LLC, 201 East Fifth Street, Suite 1600, Cincinnati, OH 45202, Attention: Compliance Department.
The information herein was obtained from various sources. FEG does not guarantee the accuracy or completeness of such information provided by third parties. The information in this report is given as of the date indicated and believed to be reliable. FEG assumes no obligation to update this information, or to advise on further developments relating to it. FEG, its affiliates, directors, officers, employees, employee benefit programs and client accounts may have a long position in any securities of issuers discussed in this report.
Index performance results do not represent any managed portfolio returns. An investor cannot invest directly in a presented index, as an investment vehicle replicating an index would be required. An index does not charge management fees or brokerage expenses, and no such fees or expenses were deducted from the performance shown.
Bloomberg Index Services Limited. BLOOMBERG® is a trademark and service mark of Bloomberg Finance L.P. and its affiliates (collectively “Bloomberg”). Bloomberg or Bloomberg’s licensors own all proprietary rights in the Bloomberg Indices. Bloomberg does not approve or endorse this material or guarantee the accuracy or completeness of any information herein, nor does Bloomberg make any warranty, express or implied, as to the results to be obtained therefrom, and, to the maximum extent allowed by law, Bloomberg shall not have any liability or responsibility for injury or damages arising in connection therewith.
Neither the information nor any opinion expressed in this report constitutes an offer, or an invitation to make an offer, to buy or sell any securities.
Any return expectations provided are not intended as, and must not be regarded as, a representation, warranty or predication that the investment will achieve any particular rate of return over any particular time period or that investors will not incur losses.
Past performance is not indicative of future results.
Investments in private funds are speculative, involve a high degree of risk, and are designed for sophisticated investors.
All data is as of February 28, 2022 unless otherwise noted.