The goal of any successful community foundation is to make an impact. To achieve this consistently across different market environments, community foundations must keep abreast of any emerging investment and enterprise trends that can help them stay relevant and benchmark to peers. To help, FEG created the Community Foundation Survey, an annual survey open to all U.S. community foundations that solicits a wide range of information on their investment frameworks and decisions to provide much-needed insight on notable shifts in investment behaviors.
The details that follow are a high-level summary of the key trends from the 2023 survey. To learn more, watch the 2023 Community Foundation Survey webinar www.feg.com/CF.
About the Survey
The FEG Community Foundation Survey collects data on a variety of financial and enterprise topics to provide insight on issues affecting community foundations.
The survey was completed primarily by senior-level investment decision-makers and responses were accepted from January 25 to March 15, 2023. We would like to extend our thanks to all community foundations dedicated to serving the needs of their communities, and specifically to those who contributed to the survey.
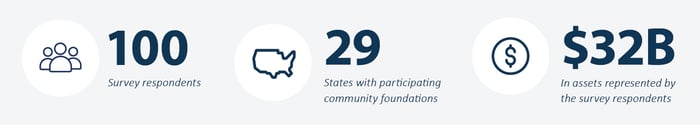
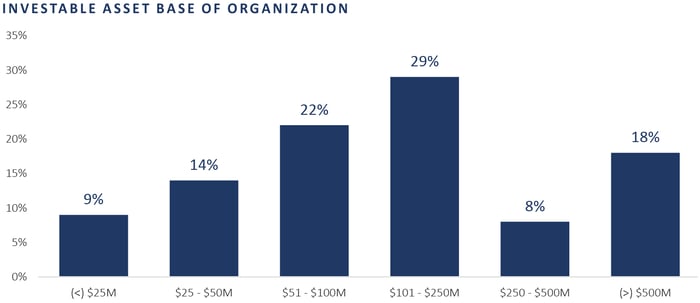
There were 100 survey respondents across 29 states, representing approximately $32 billion in assets.1 Asset sizes ranged from less than $25 million to greater than $1 billion, with 29% of respondents reporting assets between $101-$250 million.
1 Assets under advisement (AUA) were self-reported by respondents as of September 30, 2022.
A Look at Community Foundation Governance
Investment Service Model
While traditional consulting/non-discretionary models remain the most popular service model, there has been a noticeable increase in the number of community foundations with an Outsourced Chief Investment Officer (OCIO)/discretionary service model.
Approximately 35% of the respondents utilize an OCIO model, an increase of 10% points from last year’s survey. Traditional consulting is still the most popular model, however, with 49% of respondents adopting this approach.
When considering a service model adjustment, community foundations should reflect candidly on their governance and the roles and responsibilities of their investment committee, staff, and advisor(s). Community foundations should also take into consideration investment resources, either with how they utilize staff or their investment committee.
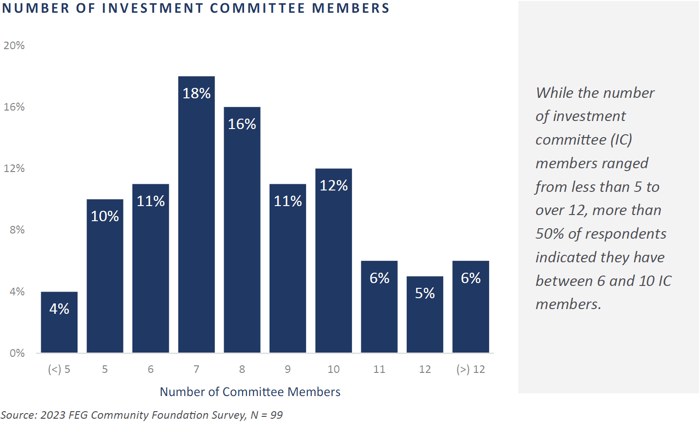
In this year’s survey, the trend of limited investment staff continued. Approximately 73% of respondents have one or less full-time equivalent (FTE) staff to administer the investment portfolio, and nearly 75% of respondents indicated they expect staffing levels to remain the same over the next five years.
To learn more about FEG's approach to governance, visit www.feg.com/governance.
Size Matters: Differences Between Small and Large Community Foundations
Asset Allocation
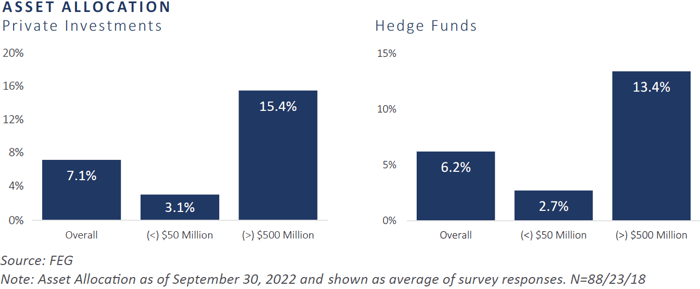
Similar to previous years, smaller community foundations (less than $50 million in AUA) indicated a stronger home country bias, with 46% allocated to U.S. equities. Larger community foundations (larger than $500 million in AUA) tended to have greater allocations to other categories, specifically private investments.
While every community foundation has unique factors that contribute to risk levels and liquidity needs, the survey has found consistently over the years that larger community foundations allocate more to alternatives. For example, larger community foundations have nearly five times the amount invested in private equity as smaller community foundations. Additionally, larger community foundations have more than four times the amount invested in hedge funds as smaller community foundations.
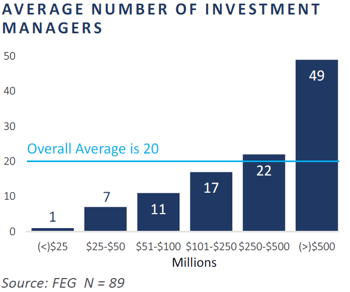
Number of Investment Managers
Another area in which there was a significant difference depending on the size of the community foundation was the number of investment managers. Overall, foundations reported an average of 20 investment managers in their primary pool, but the number of managers varied greatly depending on asset size. Community foundations with assets greater than $500 million averaged 49 managers, while those with assets less than $50 million only had approximately seven managers.
Responsive Investing (RI)
Interest and investment in responsive investing has increased since 2017. Over half of respondents (54%) indicated they have RI strategies within their portfolio, though actual dollars invested of the total portfolio remain limited.
A Growing Trend: Diverse Asset Managers
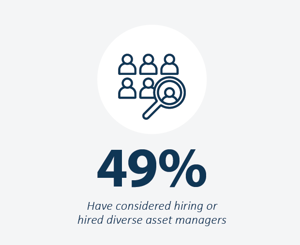
As community foundations further explore implementing diversity, equity, and inclusion (DEI) to align their missions with their investments, there has been increased interest and action related to diverse managers, with nearly 50% of respondents having hired or having considered hiring a diverse asset manager. Education and inventory are the major areas where community foundations are seeking further assistance regarding DEI and diverse managers. Furthermore, investing in diverse asset managers/DEI is among the top trends being discussed by investment committees.
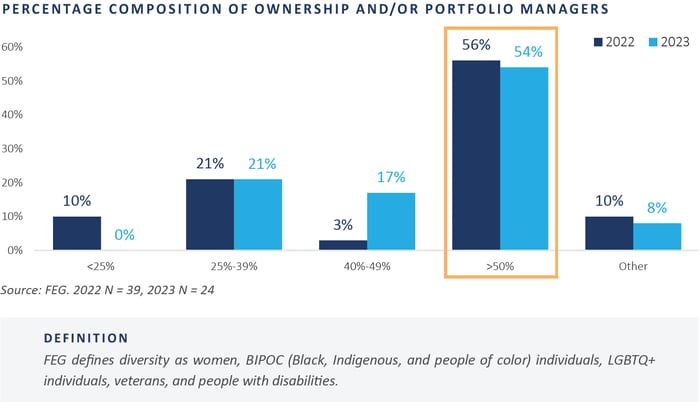
Defining Diverse
More than half of respondents indicated they define a diverse manager as one with more than 50% composition of ownership and/or portfolio managers who are described as women or persons of color. In the 2023 survey, there was a noticable increase in the number of respondents who define a diverse asset manager as one with 40-49% composition of ownership and/or portfolio managers.
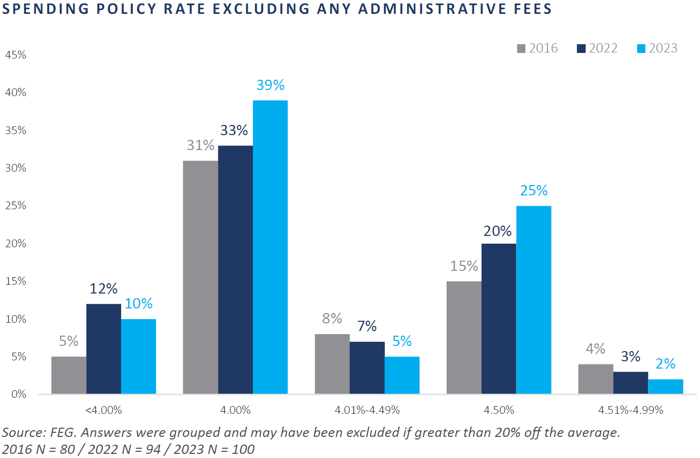
Factors of Spending Policy
Average and median community foundation spending rates slightly decreased year-over-year in a declining stock and bond market environment. The average and median spending rates for the 2023 survey are 4.3% and 4.1%, respectively. Notably, only 8% of respondents signaled an intent to change their spending rate in the coming year.
Closing Thanks
Thank you to all of the community foundations that participated in the survey and contributed to its content. FEG greatly appreciates the time and energy of those who have participated in the past, and we look forward to increasing the number of participants and improving the usefulness of the data in the future.
Should you have any ideas or feedback to incorporate into the 2024 survey, please email communications@feg.com.
Glossary
Investment Consulting Models
TRADITIONAL CONSULTING / NON-DISCRETIONARY
Traditional consulting is the use of a third party that advises a board/committee on investment decisions but does not have discretionary power— sometimes referred to as an investment advisor.
OCIO / DISCRETIONARY
An OCIO is a third party that manages an investment portfolio.
HYBRID CONSULTING MODEL
This model combines traditional consulting and OCIO. The consultant—a third-party advisor—advises the board/committee on investment decisions but might have some discretionary power.
INVESTMENT MANAGER
A mutual fund manager (e.g., Morgan Stanley).
Responsive Investing Terms
RESPONSIVE INVESTING (RI)
Any investment made by an organization that seeks to gain both financial and social benefit.
PROGRAM-REL ATED INVESTMENT (PRI)
Investments aligned with the mission of an organization that act as a component to their grant-making. A PRI may produce at-market, above-market, or below-market returns. The investment is eligible to count against the 5% payout that foundations are required to make each year to retain their tax-exempt status.2
MISSION-REL ATED INVESTMENT (MRI) / IMPACT INVESTMENT
MRIs or impact strategies are investments that support the mission of a foundation by generating a positive social or environmental impact. Impact investments for community foundations are often place-based— geographically constrained to the foundation’s region—and can be market-return-seeking or concessionary return. These investments are made from the foundation’s endowment corpus. MRI and impact opportunities exist across asset classes and can be through a fund or direct investment.3
SOCIALLY RESPONSIBLE INVESTMENT (SRI)
Considered socially responsible because of the nature of the business the company conducts. This could include negative exclusionary criteria, for example, the exclusion of “sin stocks.”4
ENVIRONMENTAL, SOCIAL, GOVERNANCE (ESG)
ESG is a holistic view of all aspects that can impact security value. ESG factors are a subset of non-financial performance indicators which include sustainable, ethical, and corporate governance issues—e.g., human rights issues, renewable energy. ESG criteria is integrated into financial decision-making and goes beyond simple issue exclusion.5
2 Adapted from the Internal Revenue Service
3 Adapted from Mission Investors Exchange
4 Adapted from Investopedia
5 Adapted from Financial Times Lexicon
Spending Policy Methodologies
MOVING AVERAGE
Spend a fixed percentage of the average market value over a set time period.
CONSTANT GROWTH
Increase spending each year by a constant growth rate or inflation.
CONSTANT GROWTH WITH BANDS
Spending is contained within a range +/- a percentage of the previous year’s market value.
GEOMETRIC
Weight given to inflation-adjusted spending and target spending of market value.
HYBRID
Custom combination of spending rules to meet the specific needs of an institution.
Fund Types
DONOR-ADVISED FUNDS
Separately identified funds or accounts comprised of contributions made by individual donors that are maintained and operated by a community foundation. Management by external advisors beyond the consultant or OCIO is occasionally allowed.
SCHOLARSHIP FUNDS
Established in situations where grant-making dollars are utilized to provide scholarships to students and managed completely by the community foundation.
SUPPORTING ORGANIZATIONS
Special types of charitable organizations that, based upon their relationship with the community foundation, are themselves classified as public charities. These organizations provide the flexibility desired by donors to meet their objectives.
AGENCY FUNDS
Established by specific non-profit organizations to provide a source of income for years to come.
ENDOWED F UNDS (UNRESTRICTED)
Set up to let a community foundation make regular withdrawals for operations, community needs, specific purposes, etc.
EXTERNALLY MANAGED FUNDS
Funds managed by an outside advisor or broker.
DISCLOSURES
This report was prepared by FEG (also known as Fund Evaluation Group, LLC), a federally registered investment adviser under the Investment Advisers Act of 1940, as amended, providing non-discretionary and discretionary investment advice to its clients on an individual basis. Registration as an investment adviser does not imply a certain level of skill or training. The oral and written communications of an adviser provide you with information about which you determine to hire or retain an adviser. Fund Evaluation Group, LLC, Form ADV Part 2A & 2B can be obtained by written request directly to: Fund Evaluation Group, LLC, 201 East Fifth Street, Suite 1600, Cincinnati, OH 45202, Attention: Compliance Department.
The data is obtained from the proprietary FEG 2023 Community Foundation Survey. The study includes a survey of 100 U.S. community foundations. The survey was open for responses online from January 25 – March 15, 2023. Participants also had the option to complete as a word document and email the results back to FEG. The data from this survey was grouped into between five and seven categories based on assets of the community foundation with assets ranging from less than $25 million to greater than $1 billion. The information in this study is based on the responses provided by the participants and is meant for illustration and educational purposes only.
Data in this presentation may also be obtained from the 2022, 2021, and 2016 proprietary FEG Community Foundation Surveys. To receive the full disclosures for these surveys, please email communications@feg.com. Index performance results do not represent any managed portfolio returns. An investor cannot invest directly in a presented index, as an investment vehicle replicating an index would be required. An index does not charge management fees or brokerage expenses, and no such fees or expenses were deducted from the performance shown. Neither the information nor any opinion expressed in this report constitutes an offer, or an invitation to make an offer, to buy or sell any securities.
Any return expectations provided are not intended as, and must not be regarded as, a representation, warranty or predication that the investment will achieve any particular rate of return over any particular time period or that investors will not incur losses.
Past performance is not indicative of future results.
Investments in private funds are speculative, involve a high degree of risk, and are designed for sophisticated investors.
This report is prepared for informational purposes only. It does not address specific investment objectives, or the financial situation and the particular needs of any person who may receive this report. Diversification or asset allocation does not assure or guarantee better performance and cannot eliminate the risk of investment loss.
The purchase of interests in private equity funds involves certain risks and is suitable only for persons of substantial financial means who have no need for liquidity in their investment, and who can bear the risk of the potential loss of their entire investment. No guarantee or representation is made that the investment will be successful, that the various underlying funds selected will produce positive returns, or that the fund will achieve its investment objectives. Various risks involved in investing may include market risk, liquidity risk, limited transferability, investment funds risk, non-registered investment funds risk, valuation risk, derivative risk, venture financing risk, distressed securities risk, interest rate risk, real estate ownership risk, currency risk, and financial risk, among others. Investors should refer to the applicable Private Placement Memorandum and Offering Documents for further information concerning risks.
The Chartered Financial Analyst® (CFA) designation is a professional certification issued by the CFA Institute to qualified financial analysts who: (i) have a bachelor’s degree and four years of professional experience involving investment decision making or four years of qualified work experience[full time, but not necessarily investment related]; (ii) complete a selfstudy program (250 hours of study for each of the three levels); (iii) successfully complete a series of three six‐hour exams; and (iv) pledge to adhere to the CFA Institute Code of Ethics and Standards of Professional Conduct.
The Chartered Alternative Investment Analyst Association® is an independent, not‐for‐profit global organization committed to education and professionalism in the field of alternative investments. Founded in 2002, the CAIA Association is the sponsoring body for the CAIA designation. Recognized globally, the designation certifies one's mastery of the concepts, tools and practices essential for understanding alternative investments and promotes adherence to high standards of professional conduct.