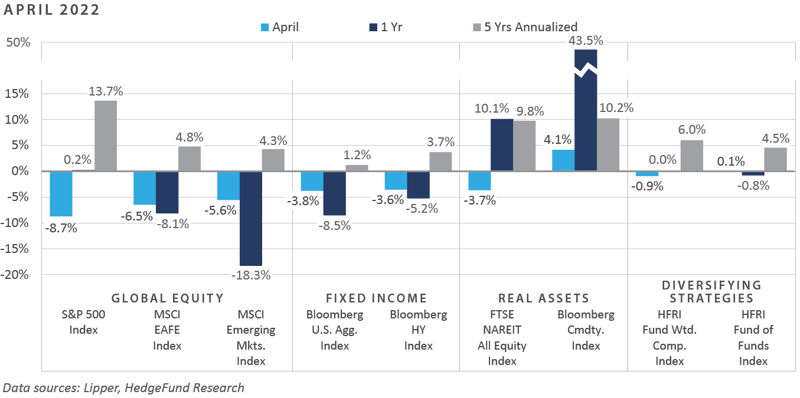
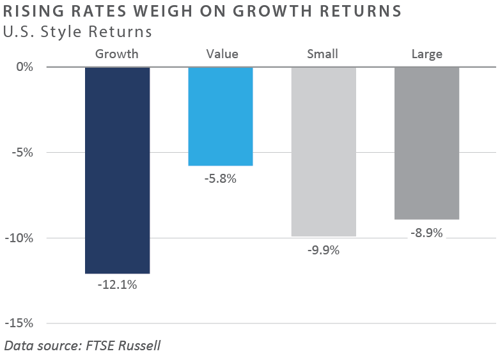
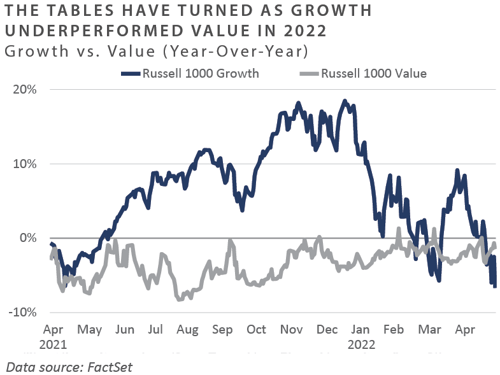
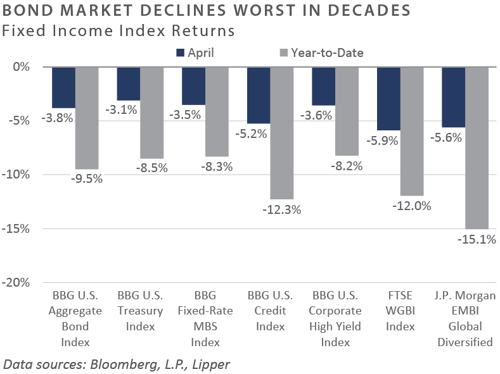
Volatility spiked meaningfully in April and continued into early May as the U.S. government reported an unexpected contraction in economic activity in the first quarter, and the Federal Reserve (Fed) hiked the federal funds rate (FFR) by 50 basis points (bps), the first hike of this size since 2000. Performance across the major asset classes and sub-asset categories was overwhelmingly negative, particularly among rate-sensitive sectors, a dominant theme across the financial markets since mid-2021. Global equities fared the worst—particularly growth-oriented sectors—as the Russell 1000 Growth Index declined by 12.1%, the weakest monthly performance since October 2008. Small and micro-cap equities underperformed large cap, while both international developed and emerging market stocks relatively outperformed domestic, the magnitude of which placed these regional indices ahead of their domestic counterparts year-to-date through April. Fixed income markets continued to face significant rising rate pressure, with core bonds, as proxied by the Bloomberg U.S. Aggregate Bond Index, posting the weakest monthly return (-3.8%) since February 1980, when the index dropped 5.9%. High yield credit also suffered, matching the decline witnessed in core bonds. In real assets, rate-sensitive sectors such as real estate investment trusts (REITs) declined sharply, while commodities were among the few major sectors to see positive performance during the month.
Economic Update
Fed Hikes Policy Rate 50 bps Despite Contraction in U.S. Growth
Following a broadly risk-on bias in March, most major global risk sectors retreated meaningfully in April and early May. Several macro headwinds weighed on market sentiment, including a 50-basis-point hike to the policy rate by the Fed, COVID-19 lockdowns across China, the ongoing Russia-Ukraine war, and an unanticipated contraction in first-quarter U.S. growth.
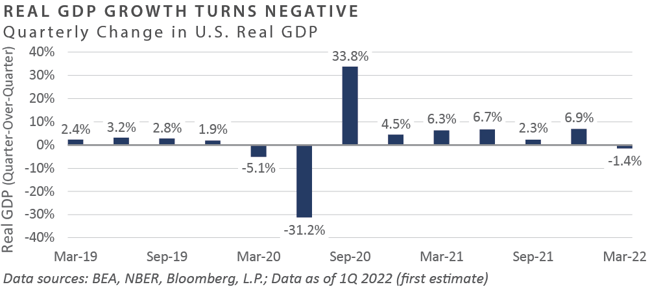
For the first three months of the year, the Bureau of Economic Analysis (BEA) estimated that on an inflation-adjusted and annualized basis, the U.S. economy contracted 1.4%, according to the advance estimate of first-quarter growth released on April 28. The 1.4% decline juxtaposed to an optimistic sell-side median estimate of 1.0%, according to Bloomberg, and was the first negative quarterly GDP print since the spring of 2020.
Despite an increasingly challenging economic situation—which appears to have taken on a stagflationary tone in recent months—the Fed decided to increase the FFR by 50 bps at their early May meeting, placing the targeted upper bound at 1.00%. While largely anticipated by investors due to the ongoing inflationary issue and in light of recent bond market-implied policy path gauges, the 50 bps increase to the policy rate was the first such bps hike since 2000.
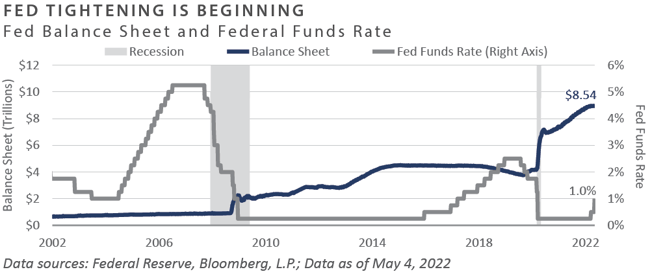
In addition to the 50 bps rate hike, the Fed provided forward guidance pointing to a reduction in the size of their nearly $9 trillion balance sheet by allowing $30 billion of Treasuries and $17.5 billion of mortgage-backed securities to begin rolling off in June, with expectations to increase the pace of this shrinkage three months later. Looming declines in the size of the Fed’s balance sheet paired with an expected steep policy rate path over the next two years represents one of the most critical headwinds facing risky asset prices in the coming quarters.
Immediately following the Fed’s announcement of the adjustments to their policy stance on May 5, most major risk assets moved sharply higher. Presumably, this was because investors breathed a momentary sigh of relief that the Fed did not hike rates by 75 bps—a potential move that Chairman Powell has suggested is off the table—or perhaps it was because the Fed failed to set forth even more hawkish forward guidance related to balance sheet reduction.
The following trading day, however, saw a pronounced move lower across risk assets as investors digested the evolving macro landscape, which appears fraught with a growing number of headwinds—most notably aggressive actions by global policymakers to slow the highest inflation rate in 40 years while grappling with an early-cycle growth slowdown amid continued elevated valuation levels across many key financial market sectors.
In summary, the month of April and early trading days of May presented global asset allocators with numerous volatility-inducing macro forces, which, when paired with an enduring inflationary impulse, helped send both risky assets and safe-haven sectors—such as core bonds—decidedly lower. In the months ahead, global policymakers will need to walk a delicate tightrope to slow the rapidly accelerating pace of inflation without sacrificing the ongoing economic expansion, which, while immature by historical comparison, is already exhibiting late-cycle characteristics, including a mostly flat Treasury yield curve, inflationary pressures, tightening monetary conditions, and a historically tight labor market.
Market Returns
Global Equity
-
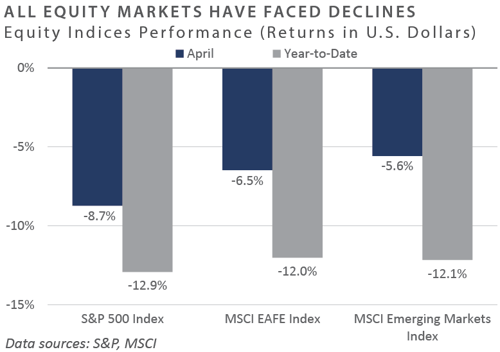
Equity markets continued to face significant selling pressure in April as global markets struggled to digest different factors that caused investor sentiment to weaken, such as the war in Ukraine, a zero-COVID policy in China leading to the lockdown of several important cities, relentless supply chain disruptions, and rising global interest rates paired with persistent inflation. U.S. equity markets continued this year’s sell-off as some market-leading, high-growth technology companies announced disappointing earnings expectations. The currency trade challenged international markets as rising U.S. interest rates have strengthened the dollar.
-
The weakness in the U.S. equity market was widespread. Almost all sectors declined for the month, although the defensive consumer staples sector showed positive returns. Growth areas of the market have continued to drive the sell-off, while value areas of the market have better protected capital.
-
Despite global selling pressures, UK equity returns were slightly positive in April in local currency but negative in U.S. dollars. Many large pharmaceutical and consumer staples companies in the UK benefitted from investor demand for defensive areas of the market. However, fears for domestic economic growth weighed on small and mid-cap UK companies. European returns were slightly negative in local currency as the war in Ukraine waged on. Sectors with higher supply chain risks, such as information technology, consumer discretionary, and industrials, underperformed relative to communication services and energy.
-
The currency markets drove Japanese equity market performance. In April, the yen weakened considerably against the U.S. dollar, rising to 130 for the first time in 20 years. The Bank of Japan confirmed that there would be no change in policy; they will maintain a target rate of 25 bps for the 10-year bond yield. The increasing differential between the interest rates has weighed on Japan’s currency.
-
Emerging market equity returns were also down for the month. China and Russia contributed significantly to poor equity performance in the region. China’s zero-COVID policy has dampened the economic outlook for the country, negatively impacting industrial metal performance. This caused industrial metals net exporter economies like Peru and Brazil to suffer for the month. By contrast, net energy exporters like Turkey, Saudi Arabia, and Kuwait benefited from strong demand and constrained supply.
Fixed Income
-
Rates did not find relief in April, as all segments of the yield curve were subject to the relentless move higher. The 2-year U.S. Treasury yield rose 36 bps to 2.70% during the month, while the 10-year U.S. Treasury yield rose 54 bps to 2.89%. The 10-year/2-year Treasury spread closed in negative territory for the first time since August 2019 before rapidly steepening through the end of the month. By month-end, the widely followed metric rose 15 bps to 0.19%. Bond and stock prices moved in the same direction, so bonds did not offer protection from April’s general risk-off sentiment.
-
While there was no Fed meeting in April, the market focused on the CPI release. March’s print, released in April, saw headline and core rise to 8.5% and 6.5% on a year-over-year basis. Early May’s release of April inflation showed inflationary persistence with an 8.3% headline measure. Fueled by the war in Ukraine, food and energy dominated the month-over-month increases. Energy, which comprises less than 10% of the index, increased a staggering 11% versus February and 32% since March 2021. Uncertainty surrounding the longevity of the war in Europe only served to stoke the inflationary embers.
-
Corporate credit underperformed duration-matched Treasuries as spreads widened across the sector. During the month, the Bloomberg U.S. Credit Index (IG) and Corporate High Yield Index (HY) returned -5.2% and -3.6%, respectively. In a continuation of year-to-date trends, lower-quality credits outperformed higher quality. This counterintuitive dynamic is driven by lower durations and higher yields within lower-rated securities. New issue markets remained open but saw limited activity. Investment-grade concessions reached levels not witnessed since 2020 as market issuers enticed investors by offering 10-15 bps concessions to place new deals, significantly higher than the negative to low-single-digit levels present in 2021.
-
Securitized sector performance mirrored that of corporates, with sectors underperforming duration-matched Treasuries. ABS, investment-grade CMBS, and MBS pass-throughs declined 0.8%, 2.3%, and 3.5%, respectively. The average 30-year fixed-rate mortgage increased 0.4% in April to 5.1%. This represents a year-to-date increase of over 60% through the end of the month. With the movement in borrowing costs, mortgage application activity collapsed 71% compared to April 2021, representing a four-year low. Infamous adjustable-rate mortgages (ARMs), popularized in the lead-up to the Great Financial Crisis, represented 17% of application activity on a dollar volume basis as borrowers sought to take advantage of the lower teaser fixed rate. As of April 28, a 5-year ARM offered a rate 1.3% lower than a comparable 30-year fixed-rate mortgage.
Real Assets
REAL ESTATE
-
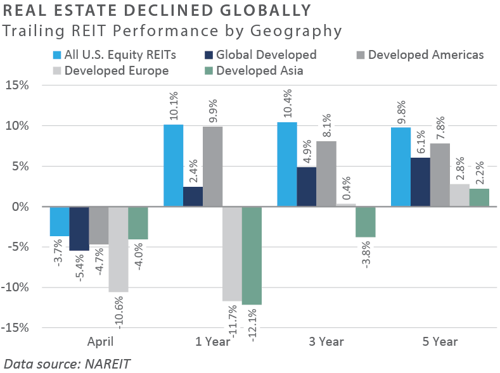
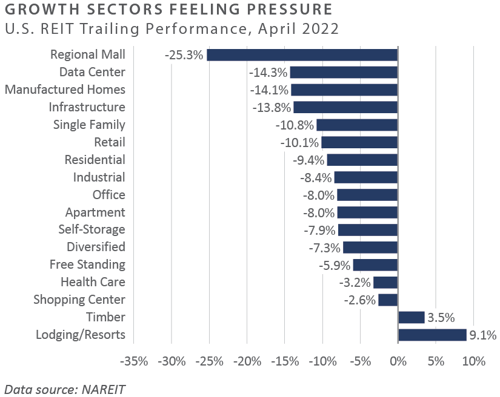
REITs declined in April on concerns related to the potential impact of higher interest rates on real estate values. Before their May meeting, the Fed signaled its intentions to raise interest rates by 50 bps as inflation readings continued to climb. Nearly all REIT sectors posted negative monthly returns, with regional malls, office, health care, and self-storage underperforming. At the same time, timber, lodging, and manufactured housing were the only sectors to post positive performance for the month. As of the end of April, the yield on REITs stood at 3.0%.
-
Similar to the broader market, growth-oriented REITs—including the data center, cell tower, and industrial sectors—underperformed year-to-date through April, driven by valuations concerns, the potential impact of slower economic growth, and investors rotating into more value-oriented property types. Sectors exposed to consumer spending, including regional malls and retail, also underperformed year-to-date as consumer confidence weakened, most notably on discretionary items. Through April, however, hotel REITs outperformed and benefited partly from their potential to offer an inflation hedge due to their ability to reset rates daily.
NATURAL RESOURCES
-
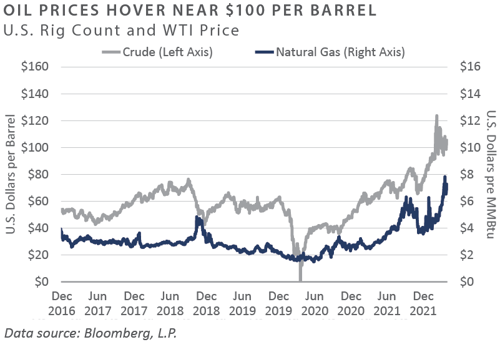
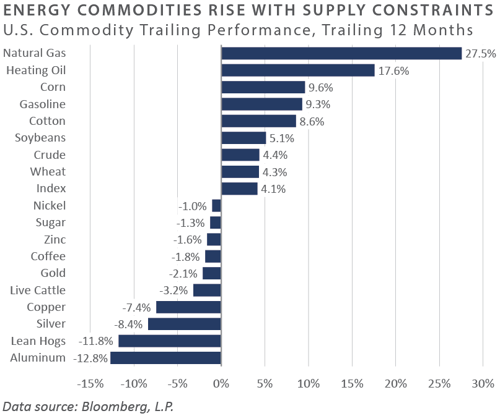
Energy prices continued their volatile upward momentum during April, with oil closing at just under $105/barrel, a multi-year high. Ongoing geopolitical concerns related to the Russia-Ukraine war were the critical factor driving higher prices. Natural gas prices rose roughly 27% on the month, closing at $7.20/MMBtu for a total gain of over 100% year-to-date as inventories remain well below their five-year averages. In the public markets, the S&P 500 Energy sector finished the month down modestly while outperforming all other sectors in the index on a monthly and year-to-date basis. Europe, which has become heavily reliant on Russia for oil and natural gas, is now seeking alternative sources, including U.S. energy. In the global oil market, spare production capacity and inventories are at all-time lows.
-
After broad-based gains in commodities during the first quarter, April saw greater performance disparity between individual commodities. While unprecedented geo-political events in Europe and stretched supply chains have continued to drive commodity prices upward, falling consumer sentiment, GDP expectations, and lockdowns in major Chinese cities have dampened demand. Commodities most impacted by the Russia-Ukraine war, including energy and soft commodities—specifically corn and wheat—outperformed during the month. Conversely, industrial and precious metals underperformed during April on the back of weakened forward-looking demand from major consuming countries, most notably China, as COVID-19-induced lockdowns have limited the country’s domestic demand and backed up ports.
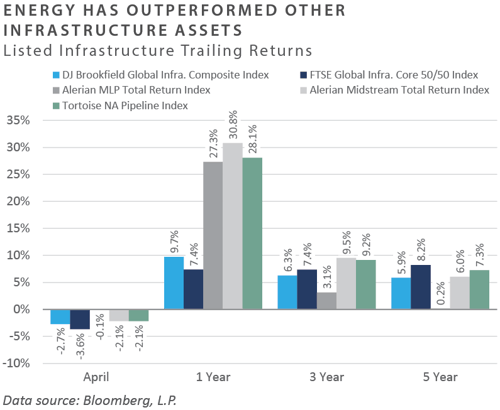
INFRASTRUCTURE
-
Midstream energy outperformed the broader equity markets in April and year-to-date. The Alerian MLP Index (AMZ) posted a slight decline in April but gained 19% year-to-date through April. Midstream energy continues to benefit from higher oil and natural gas prices and growing global demand for LNG exports.
-
Listed infrastructure stocks, as measured by the FTSE Global Core Infrastructure 50/50 Index, declined in April under the backdrop of rising rates. Transportation and renewable infrastructure assets were the core detractors for the month as railroads erased all of their gains from the previous month, and utilities and renewables underperformed.
Diversifying Strategies
-
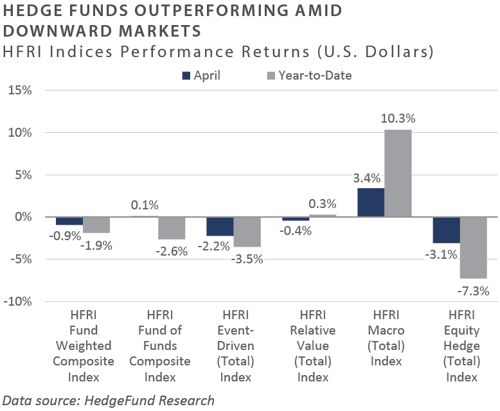
Hedge fund returns were broadly negative as strategies with a heavier equity beta led the drawdown for the month. Even with the decline in April, hedge funds have continued to provide significant downside protection, while equities and bonds have declined substantially in tandem.
-
Global macro trend following strategies continued their strong performance in April. Similar trends drove performance from the previous quarter, including currencies, fixed income, and commodities. Specifically, long U.S. dollar and short fixed income positions generated strong gains, as did long positions in the energy complex.
-
Hedge equity managers experienced the largest declines, led by healthcare and technology-focused strategies. Growth-oriented equities have significantly underperformed in 2022. The only positive underlying strategy within the equity hedge universe was equity market neutral.
-
Event-driven managers also faced a challenging environment, with most underlying strategies lower for the month. Activist strategies were the largest detractor for the month.
INDICES
The Alerian MLP Index is a composite of the 50 most prominent energy Master Limited Partnerships that provides investors with an unbiased, comprehensive benchmark for this emerging asset class.
Barclays Capital Fixed Income Indices is an index family comprised of the Barclays Capital Aggregate Index, Government/Corporate Bond Index, Mortgage-Backed Securities Index, and Asset-Backed Securities Index, Municipal Index, High-Yield Index, and others designed to represent the broad fixed income markets and sectors within constraints of maturity and minimum outstanding par value. See https://ecommerce.barcap.com/indices/index.dxml for more information.
The CBOE Volatility Index (VIX) is an up-to-the-minute market estimate of expected volatility that is calculated by using real-time S&P 500 Index option bid/ask quotes. The Index uses nearby and second nearby options with at least 8 days left to expiration and then weights them to yield a constant, 30-day measure of the expected volatility of the S&P 500 Index. FTSE Real Estate Indices (NAREIT Index and EPRA/NAREIT Index) includes only those companies that meet minimum size, liquidity and free float criteria as set forth by FTSE and is meant as a broad representation of publicly traded real estate securities. Relevant real estate activities are defined as the ownership,
HFRI Monthly Indices (HFRI) are equally weighted performance indexes, compiled by Hedge Fund Research Inc. (HFX), and are used by numerous hedge fund managers as a benchmark for their own hedge funds. The HFRI are broken down into 37 different categories by strategy, including the HFRI Fund Weighted Composite, which accounts for over 2000 funds listed on the internal HFR Database. The HFRI Fund of Funds Composite Index is an equal weighted, net of
J.P. Morgan’s Global Index Research group produces proprietary index products that track emerging markets, government debt, and corporate debt asset classes. Some of these indices include the JPMorgan Emerging Market Bond Plus Index, JPMorgan Emerging Market Local Plus Index, JPMorgan Global Bond Non-US
Merrill Lynch high yield indices measure the performance of securities that pay interest in cash and have a credit rating of below investment grade. Merrill Lynch uses a composite of Fitch Ratings, Moody’s and Standard and Poor’s credit ratings in selecting bonds for these indices. These ratings measure the risk that the bond issuer will fail to pay interest or to repay principal in full. See www.ml.com for more information.
Morgan Stanley Capital International – MSCI is a series of indices constructed by Morgan Stanley to help institutional investors benchmark their returns. There
Russell Investments
S&P 500 Index consists of 500 stocks chosen for market size, liquidity and industry group representation, among other factors by the S&P Index Committee, which is a team of analysts and economists at Standard and Poor's. The S&P 500 is a market-value weighted index, which means each stock’s weight in the index is proportionate to its market value and is designed to be a leading indicator of U.S. equities, and meant to reflect the risk/return characteristics of the
Information on any indices mentioned can be obtained either through your advisor or by written request to information@feg.com.
DISCLOSURES
This report was prepared by FEG (also known as Fund Evaluation Group, LLC), a federally registered investment adviser under the Investment Advisers Act of 1940, as amended, providing non-discretionary and discretionary investment advice to its clients on an individual basis. Registration as an investment adviser does not imply a certain level of skill or training. The oral and written communications of an adviser provide you with information about which you determine to hire or retain an adviser. Fund Evaluation Group, LLC, Form ADV Part 2A & 2B can be obtained by written request directly to: Fund Evaluation Group, LLC, 201 East Fifth Street, Suite 1600, Cincinnati, OH 45202, Attention: Compliance Department.
The information herein was obtained from various sources. FEG does not guarantee the accuracy or completeness of such information provided by third parties. The information in this report is given as of the date indicated and believed to be reliable. FEG assumes no obligation to update this information, or to advise on further developments relating to it. FEG, its affiliates, directors, officers, employees, employee benefit programs and client accounts may have a long position in any securities of issuers discussed in this report.
Index performance results do not represent any managed portfolio returns. An investor cannot invest directly in a presented index, as an investment vehicle replicating an index would be required. An index does not charge management fees or brokerage expenses, and no such fees or expenses were deducted from the performance shown.
Bloomberg Index Services Limited. BLOOMBERG® is a trademark and service mark of Bloomberg Finance L.P. and its affiliates (collectively “Bloomberg”). Bloomberg or Bloomberg’s licensors own all proprietary rights in the Bloomberg Indices. Bloomberg does not approve or endorse this material or guarantee the accuracy or completeness of any information herein, nor does Bloomberg make any warranty, express or implied, as to the results to be obtained therefrom, and, to the maximum extent allowed by law, Bloomberg shall not have any liability or responsibility for injury or damages arising in connection therewith.
Neither the information nor any opinion expressed in this report constitutes an offer, or an invitation to make an offer, to buy or sell any securities.
Any return expectations provided are not intended as, and must not be regarded as, a representation, warranty or predication that the investment will achieve any particular rate of return over any particular time period or that investors will not incur losses.
Past performance is not indicative of future results.
Investments in private funds are speculative, involve a high degree of risk, and are designed for sophisticated investors.
All data is as of April 30, 2022 unless otherwise noted.