


-01.webp?width=400)


Investors in fixed income securities should comprehend that coupon payments contribute to stability during times of significant interest rate fluctuations. Higher coupon rates correspond to a rise in interest income, which may assist investors in offsetting potential losses from mark-to-market price reductions in their bond holdings. One year ago, fixed income investors felt the hangover from the first-ever back-to-back calendar year declines for the Bloomberg U.S. Aggregate Bond Index (BAGG) in 2021 and 2022. Adding insult to injury, the bond market started that period with a paltry index coupon of less than 3%, not nearly enough cushion to offset the coming price declines as the market shifted to a higher interest rate regime.
THE COUPON IS ALWAYS KING!
In 2021, the BAGG lost 1.5%, which investors found unpleasant but tolerable; however, in 2022, the BAGG saw an unthinkable decline of 13%. The worst calendar year decline prior to 2022 was the Great Bond Massacre of 1994, when the Federal Reserve (Fed) materially increased overnight borrowing costs to fight inflation, the 10-year U.S. Treasury rose more than 200 basis points, and the BAGG fell almost 3%. Had the index coupon in 1994 been less than 3%, as it was in 2021-2022, the Great Bond Massacre would have been considerably worse. Instead, the healthy index coupon of 7.5% offset much of the price decline that year.
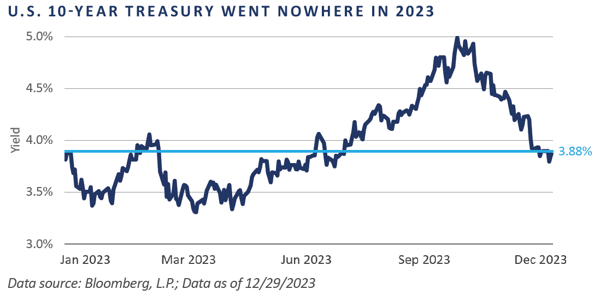
Heading into 2023, fixed income managers—still smarting from the prior two years of losses—strongly believed 2023 was set up for a positive calendar year. After all, yields were higher and prices lower than they had been the two years prior, leading to an increase in the use of the words “positive convexity,” meaning bonds had more potential for gains if interest rates fell than potential for losses in the face of an equal rise in rates. Unfortunately, interest rates continued their ascent, creating more positive convexity at the cost of more negative returns. This situation reached a crescendo in October when the U.S. 10-year Treasury reached a 16-year high of 5%. Until then, the BAGG was careening toward its third consecutive negative calendar year, down 2.8%.
What a difference two months can make. At the October 31 to November 1, 2023 Federal Open Market Committee (FOMC) meeting, the Fed opted to hold steady the federal funds target rate. With inflationary pressures seemingly moving to the rearview, the bond market—and stock market—began to price in the “pause to pivot” narrative of easing in 2024 and the U.S. 10-year Treasury yield fell. The highly interest rate sensitive BAGG rallied, with an impressive return of 4.5% for the month. And with this move, traditional fixed income managers breathed a sigh of relief, as fears of a third consecutive negative calendar year subsided.
With the market viewing the Fed commentary following the December FOMC as dovish, the 10-year U.S. Treasury rallied throughout the month to close the year at 3.88%—the precise level at which it began the year. The BAGG followed suit, producing a 3.8% gain in December, bringing the 2023 calendar year return to an impressive 5.5%, marking an 8.3% return in just two months. The potential of a third consecutive negative calendar year for the BAGG had been averted.
At times when the yield curve is inverted, as it has been since March 31, 2022, investors often consider parking money in a government money market fund—i.e., cash—as opposed to maintaining exposures to core fixed income strategies. For those who have a cash requirement, a plan to optimize this exposure is paramount. However, experience indicates that investors cannot find long-term success through making interest rate bets. The risk of moving to the short-term certainty of cash is too great, as it is nearly impossible to determine the exact timing of a move lower in rates. Indeed, the 8.3% return from November to December speaks directly to those who suggested the move to cash. Those who moved to cash missed out on the reversal, giving credence to the rationale for maintaining a long-term strategic allocation to core fixed income.
The 2024 Fixed Income Outlook
Leonardo da Vinci wrote that a poet would be “overcome by sleep and hunger before being able to describe with words what a painter is able to depict in an instant.” This was the origination of the phrase “A picture is worth a thousand words.” This is the case for Bloomberg U.S. Aggregate Index chart, which highlights some of the key elements of bonds—price, coupon, and yield—using the BAGG as a proxy for the U.S. traditional bond market.
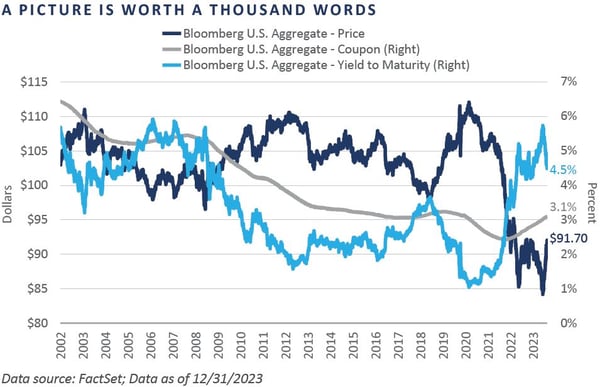
Few investors look at the BAGG from this perspective, although perhaps they should, as it crystallizes what should theoretically be an easy contrarian asset allocation decision when the broad domestic bond market reaches extremes.
In July 2020, the yield-to-maturity for the index had never been lower at just 1%, and the price never higher at $112, with a par of $100. Adding in the paltriest of coupons at 2.4% created a recipe for fixed income return disappointment, which is exactly what investors experienced. By October 2023, a massive reversal had taken place, as the yield-to-maturity rose to 5.7% in October 2023 while the dollar price sunk to a low of $84.20, nearly 20 points below its average price of $103.30.
Despite higher interest rates, new bond issuance takes time, and 2023 ended with coupons at a historically low 3.1%. This is due to the prolonged zero interest rate policy (ZIRP) following the Global Financial Crisis (GFC), which enabled issuers to extend their debt with low coupons.
Entering 2024, BAGG coupons are less than half of their pre-GFC high of 6.4%, indicating a recovering traditional fixed income market. The broad fixed income markets present a “stressed” investment opportunity with potential for price appreciation, albeit with low coupons.
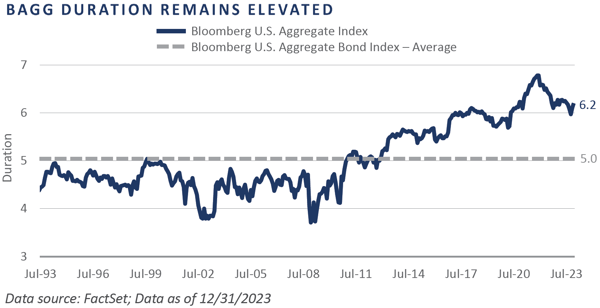
FEG’s recent outlooks highlighted the BAGG’s decade-long duration1 extension to nearly seven years, surpassing its historical average of five years. We advised investors to align their portfolio duration with the Bloomberg Intermediate Aggregate Bond Index, which had a duration closer to the BAGG’s historical average. Following the 2023 interest rate reversal, the BAGG duration dropped to 6.2 years, still above average but with a more reasonable level of interest rate sensitivity for core fixed income investors. Most of FEG’s recommended active core fixed income managers adjusted their portfolio durations to match the benchmark. Given the BAGG’s adjustments and market conditions, a neutral duration stance is now suitable.
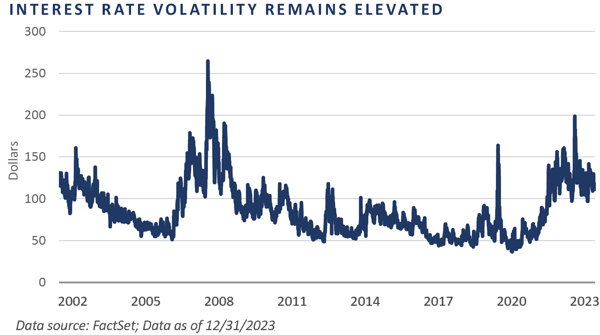
Interest rate volatility remained elevated throughout 2023. With the Fed’s recent pivot from a hiking cycle to a pause—and perhaps, as believed by the market, to the beginning of an easing cycle—FEG expects interest rate volatility to remain elevated. Assuming there are no exogenous events in 2024, we believe investors should anticipate a gradual decline in the MOVE Index to more normal levels as interest rates settle to a new normal.
PUBLIC CREDIT
2023 saw double-digit returns for the broadly syndicated loan (BSL) market and the high yield bond market, as credit risk rallied along with the S&P 500 Index. The BSL market returned 13% as measured by the Credit Suisse Leveraged Loan Index (CSLL), while the ICE BofA U.S. High Yield Index (BHY) gained a comparable 13.4%. These returns were solid when compared with most other risk assets, all of which were unable to keep up with the Magnificent Seven stocks.2 Of course, fixed income has no magnificent issuers. For fixed income investors, magnificence is found in the timely repayment of principal and interest at contractually stated terms.
By the end of 2023, the BSL market had a yield to maturity of just over 9%, while the BHY yield was slightly below 8%. Should the Fed ease more slowly than what was priced in during the last two months of 2023, the BSL market, benefiting from a higher Secured Overnight Funding Rate (SOFR), may become more attractive than the high yield market. However, higher floating rate costs increase the overall debt cost, pressuring companies’ profitability and raising default risk. The BSL market also suffers from weaker covenant protection due to “covenant-lite” deals issued at lower rates.
The high yield bond market, on the other hand, had a higher relative credit quality than the BSL market. However, investors considering high yield bonds must weigh their value against lower risk fixed income or less liquid private credit investments. The preference for private over public credit has grown, likely due to the illiquidity premium.
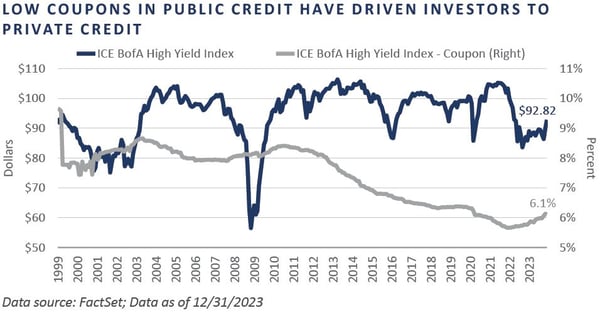
Like the BAGG, high yield bond coupons at 6.1% are still 1.3 percentage points below the BHY’s 7.4% average coupon rate since 1999. In the words of former Citibank CEO Walter Wriston: “Capital goes where it’s welcome and well-treated.” The low coupons in public credit markets have driven investors towards higher income in private markets.
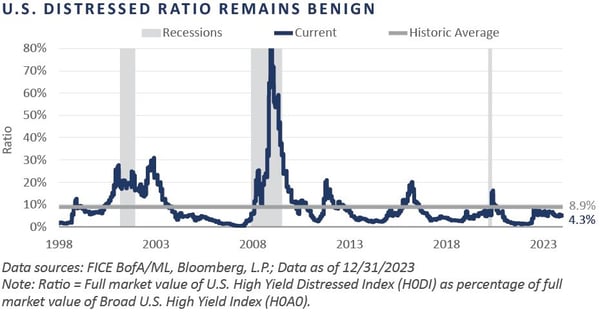
The 2023 year-end option-adjusted spread (OAS) for high yield bonds was 339 basis points, suggesting a soft-landing market scenario was being priced in, as credit risk premiums shrink under the market’s assumption that all is well with the economy. The high yield market’s higher relative quality makes a distressed OAS widening to 1,000 basis points or more unlikely. The credit-oriented managers FEG has spoken with generally anticipate a 600-750 basis points OAS for the wide point of this cycle. Recent trends suggest a reduced likelihood of a near-term, broad-based distressed opportunity, with the distressed ratio at 4.3%, significantly below its 8.9% long-term average.
PRIVATE DEBT
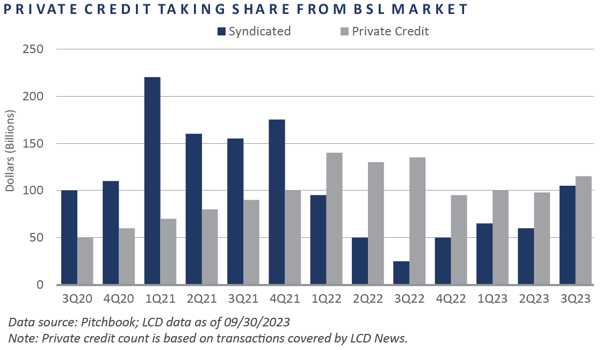
The higher interest rate environment of the last two years further increased the attractiveness of private lending, as higher base rates drove senior secured private loan yields to the low double digits. Private lending has been taking market share from the BSL market in recent years, a trend that is expected to continue as large corporate issuers look for capital in both formats.
Corporations may favor issuing in the private credit markets due to advantages in flexibility, ease of execution, and potentially lower costs compared to public credit markets. Private loans also offer more customization, involve fewer intermediaries, and remain accessible even during market disruptions. The cost of a private loan has the potential to be more favorable to an issuer based on the borrower’s credit profile and market competition among private lenders.
The market’s gravitation toward private lending has led more asset managers to join the sector, including traditional fixed income managers and credit-oriented hedge funds. Existing private lenders are also continuously looking to build market share.
However, as private lending continues its growth trajectory, it is beginning to resemble a form of private credit beta, particularly in the U.S. upper-middle market. Private equity sponsors struggled in 2023 to determine the right price to buy or sell a company, but with considerable dry powder and a need to put money to work, the market is expecting more deals in 2024.
FEG remains supportive of private lending strategies and anticipates continued growth in the asset class. With starting yields in the low double digits and recent vintage deals performing well, private lending offers an excellent risk-adjusted return profile.
While higher interest rates increase credit risk for all companies and negatively impact key financial metrics, this risk can be mitigated through careful manager or lender selection and broad diversification. We believe one of FEG’s core strengths is the ability to differentiate among private lending options.
CONCLUSION
The 2024 construction of the BAGG reflects a still-recovering traditional fixed income market priced at stressed levels, with a reasonable yield and an uncomfortably low coupon. The BAGG’s duration started the year at 6.2 years, still well above its historical average, but more in line with a reasonable level of interest rate sensitivity, leading to a recommendation for a more neutral duration posture for investors benchmarking against the BAGG. FEG expects interest rate volatility to remain elevated, albeit with a gradual decline, barring any exogenous events.
Following mid-teens returns in 2023, the BSL market appears relatively more attractive than the high yield market, particularly if investors believe the Fed will be slower to ease than the markets anticipate coming into the year. Higher floating rate coupons naturally attract the interest of income-seeking investors, but higher debt servicing costs lead to additional pressure on companies’ profit margins and increase default risk. To the extent the Fed does begin to ease in 2024, this will help lower the overall debt service costs of corporate issuers, reducing default risk. The current dynamics of the BSL market are quite interesting. The high yield bond market was of higher credit quality than the BSL market at the start of 2024, but the asset class suffers from low fixed rate coupons of only 6.1%. OAS for high yield bonds and the distressed ratio suggest a market priced for continued strength.
With the recent shift in sentiment toward a higher probability of a soft landing, the expectation of a broad-based distressed opportunity in the near term has lessened. To Wriston’s point on capital going where it is well-treated, investors have become enamored with the low double-digit yields found in the private lending markets, where coupons, as always, are king.
FOOTNOTES
1Duration is a function of yield (coupon) and maturity. Think of it as the weighted average time to get principal repaid. Rates (yield or coupon) up—duration down; maturities up—duration up. BAGG duration declined in 2022, with maturities unchanged but rates up. Bloomberg Intermediate Aggregate Index (BIAGG) duration extended due to an overweight in RMBS, which saw maturities extend. This offset the effect of higher yields. The convexity component plays into the BAGG versus BIAGG duration convergence as well, as RMBS’ typically have negative convexity–although they became positive in 2022—compared to investment-grade corporate bonds and Treasuries, which are positively convex.
Example: Time to maturity: The longer the maturity, the higher the duration, and the greater the interest rate risk. Consider two bonds that each yield 5% and cost $1,000 but have different maturities. A bond that matures faster (1 year) would repay principal and interest faster than a bond that matures in 10 years. Consequently, the shorter-maturity bond would have a lower duration and comparably less interest rate risk.
Coupon rate: A bond’s coupon rate is a key factor in the duration calculation. If there are two bonds that are identical with the exception of their coupon rates, the bond with the higher coupon rate will pay back its original costs faster than the bond with a lower yield. The higher the coupon rate, the lower the duration, and the lower the interest rate risk.
2Apple (AAPL), Microsoft (MSFT), Alphabet (GOOGL), Amazon (AMZN), Nvidia (NVDA), Meta Platforms (META), and Tesla (TSLA).
DISCLOSURES
This report was prepared by FEG (also known as Fund Evaluation Group, LLC), a federally registered investment adviser under the Investment Advisers Act of 1940, as amended, providing non-discretionary and discretionary investment advice to its clients on an individual basis. Registration as an investment adviser does not imply a certain level of skill or training. The oral and written communications of an adviser provide you with information about which you determine to hire or retain an adviser. Fund Evaluation Group, LLC, Form ADV Part 2A & 2B can be obtained by written request directly to: Fund Evaluation Group, LLC, 201 East Fifth Street, Suite 1600, Cincinnati, OH 45202, Attention: Compliance Department.
The information herein was obtained from various sources. FEG does not guarantee the accuracy or completeness of such information provided by third parties. The information in this report is given as of the date indicated and believed to be reliable. FEG assumes no obligation to update this information, or to advise on further developments relating to it. FEG, its affiliates, directors, officers, employees, employee benefit programs and client accounts may have a long position in any securities of issuers discussed in this report.
Neither the information nor any opinion expressed in this report constitutes an offer, or an invitation to make an offer, to buy or sell any securities.
Past performance is not indicative of future results.
This report is prepared for informational purposes only. It does not address specific investment objectives, or the financial situation and the particular needs of any person who may receive this report.