For the third consecutive quarter, traditional asset classes and categories endured significant volatility, with most corners of the financial markets suffering performance losses amid a tense geopolitical backdrop, weakening economic fundamentals, and further tightening actions by the Federal Reserve (Fed). In response to a historically tight labor market, stubbornly high inflation, and a persistent imbalance between aggregate demand and available supply, the Fed doubled the pace of quantitative tightening in September and issued two 75-basis-point hikes to the federal funds rate, formally placing this key policy rate above the “neutral” level and into restrictive territory.
Global equities posted negative returns for the third consecutive quarter, with domestic equities witnessing relative outperformance versus international developed and emerging markets, and smaller cap companies relatively outperforming their larger cap counterparts. Stylistically, the longer duration and rate-sensitive growth sectors modestly outperformed value, despite a meaningful rise in Treasury interest rates.
Similar to global equity, core bonds suffered a third consecutive quarterly decline, pressured lower by a relentless rise in interest rates, with the floating-rate bank loan sector being one of the few areas within the fixed income markets to eke out a positive return on the quarter. Against a backdrop that included stubbornly high inflation and aggressive Fed rate hikes, the yield on the benchmark 10-Year Treasury Note surge a staggering 82 basis points on the quarter to 3.83%, placing this key interest rate at the highest level since 2010. The upward momentum of the 10-Year Treasury Note has carried over into the fourth quarter, with the yield now measuring over 4%.
Real asset returns were also pressured lower during the quarter, the downward momentum of which was primarily concentrated in September, as the strengthening U.S. dollar (USD), rising interest rates, and ongoing concerns of a loss of global economic growth momentum weighed on the asset class. Among the primary real asset categories, real estate investment trusts (REITs), global listed infrastructure, and commodity futures each declined by double-digit margins, while some pockets of relative strength were witnessed within the energy infrastructure sector.
KEY MARKET THEMES AND DEVELOPMENTS
PERSISTENT INFLATIONARY PRESSURES PROMPT FED TO TIGHTEN POLICY FURTHER, DESPITE WEAKENING FUNDAMENTALS
“More of the same” could casually describe the third quarter of 2022, as most key traditional asset classes and categories suffered through a third consecutive bumpy quarter, with performance losses blanketing the landscape. Central to the theme of elevated volatility and negative performance was stubbornly high inflation, both domestically and abroad, with policymakers in the United States and Europe taking further action to help bring aggregate demand and available supply more closely into balance.
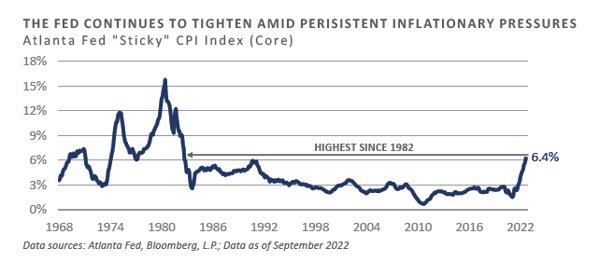
In the U.S., both headline and core measures of inflation remained uncomfortably high versus the Fed’s 2% desired level through the quarter, despite meaningful year-to-date progress to tighten monetary and broader financial conditions. The Atlanta Fed’s measure of the “stickiness” of inflation has appeared unrelenting in its rise throughout 2022, despite a less linear ascent across actual core inflation. Through September, this gauge stood at 6.4%—a 40-year high—and does not appear to be moderating its trajectory.
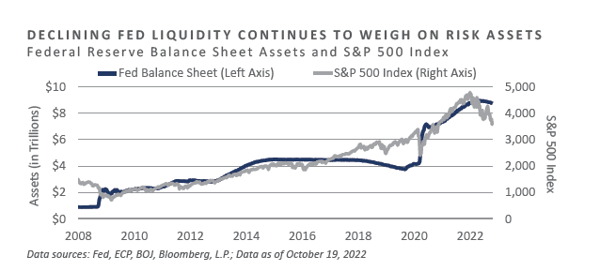
In the third quarter, the Fed not only hiked the policy rate by 75 basis points on two separate occasions—once in July and another in September—but also ramped up the pace of quantitative tightening through an acceleration of their balance sheet winddown. After peaking at just shy of $9 trillion in April, the Fed’s balance sheet has since declined approximately $200 billion. Interestingly, despite inflation running well above target at the time, the Fed was still purchasing both Treasury and agency mortgage-backed securities this past spring, albeit at a moderated pace.
The dual forces of a higher policy rate and incremental declines in the size of the balance sheet have weighed on investor risk appetites throughout 2022, placing meaningful downward pressure on risky asset prices.
Tighter domestic monetary conditions have not only served as a headwind to risk assets, they have also transmitted into the broader financial markets through higher market interest rates, increasing credit risk premiums, and a sharp rise in the exchange rate value of the US.
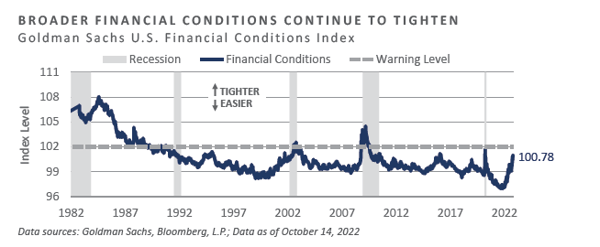
The commonly-refenced Goldman Sachs U.S. Financial Conditions Index helps highlight this linkage, as the abrupt pivot from an ultra-accommodative policy stance to one of incremental tightening over the trailing year has coincided with a meaningful tightening in financial conditions. Importantly, Goldman Sachs’ gauge remains modestly below levels that have historically signaled cyclical slowdown pressures, implying further Fed tightening is likely in order to slow the economy and tamp inflation.
Headline and core inflation is still running strongly above both the Fed’s desired long-run level of 2.0% and the upper bound on the federal funds rate (3.25%). With more space to tighten broader financial conditions further, the Fed is anticipated to remain active on their tightening campaign through the duration of 2022 and into the early months of 2023, despite growing concerns the economy is headed for a hard landing.
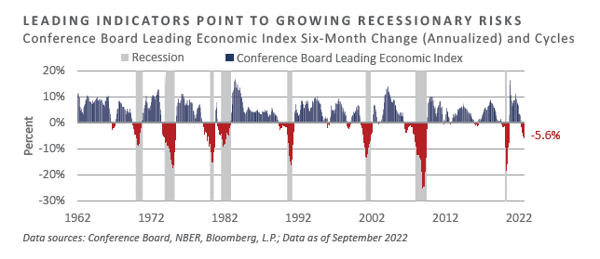
One of the key cyclical indicators that maintains a solid historical track record of identifying inflection points in the business cycle has started to flash warning signs. The Conference Board’s Leading Economic Index (LEI), a composite of economic factors that—according to the Conference Board—in aggregate, lead turning points in the business cycle by an estimated seven months, has witnessed a marked deceleration over the trailing six months. Through September, the LEI had declined 2.8% over the preceding six-month period, representing a 5.6% annualized decline and a pace that has historically coincided with imminent recessionary conditions.
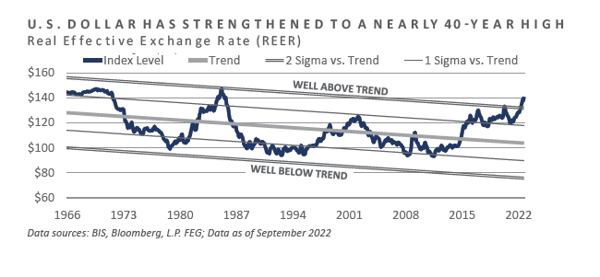
In addition to applying downward pressure on economic fundamentals, the significant tightening initiatives detailed above helped underpin a meaningful appreciation of the USD during the quarter, with associated weakness felt across developed and emerging market currencies alike. The euro, British pound, Japanese yen, and liquid emerging market currencies each slumped to multi-decade low levels versus the USD in the third quarter, prompting interventionist market responses by both the UK government and the Bank of Japan in a bid to help stem further declines.
Through September, on an inflation-adjusted and trade-weighted basis, the Bank for International Settlements’ Real Effective Exchange Rate (REER) for the USD stood at an index level of 140.66, 35% above the historical average, 2.5 standard deviations above the long-run trend, and the highest level since 1985.
Ultimately, it appears the more persistent inflationary pressures remain, the harder the Fed will have to hit the brakes. This would, in turn, support a further rise in the exchange rate value of the USD and, unfortunately, a likely additional increase in global risk premia that would weigh on asset prices.
OUTLOOK AND CONCLUDING THOUGHTS
Both risk-seeking and high quality-oriented global investors suffered through a third consecutive quarter of elevated financial market volatility and broad-based performance losses across key global asset classes and categories. Persistent positive inflationary momentum in conjunction with a historically tight labor market supported the need for additional tightening measures by the Fed, despite mounting evidence of developing broad-based economic weakness.
In the coming months, the anticipated Fed path implied by the bond market points to further monetary restraint in a quest to restore both price stability and a balance in supply and demand. While steep losses have plagued the financial markets year-to-date, further downside volatility may be in order, should inflation fail to smoothly subside and evidence of a hard landing become more abundant.
DISCLOSURES
Bloomberg Data Disclosure: Source- Bloomberg Index Services Limited. BLOOMBERG® is a trademark and service mark of Bloomberg Finance L.P. and its affiliates (collectively “Bloomberg”). Bloomberg or Bloomberg’s licensors own all proprietary rights in the Bloomberg Indices. Bloomberg does not approve or endorse this material or guarantee the accuracy or completeness of any information herein, nor does Bloomberg make any warranty, express or implied, as to the results to be obtained therefrom, and, to the maximum extent allowed by law, Bloomberg shall not have any liability or responsibility for injury or damages arising in connection therewith.
This report was prepared by Fund Evaluation Group, LLC (FEG), a federally registered investment adviser under the Investment Advisers Act of 1940, as amended, providing non-discretionary and discretionary investment advice to its clients on an individual basis. Registration as an investment adviser does not imply a certain level of skill or training. The oral and written communications of an adviser provide you with information about which you determine to hire or retain an adviser. Fund Evaluation Group, LLC, Form ADV Part 2A & 2B can be obtained by written request directed to: Fund Evaluation Group, LLC, 201 East Fifth Street, Suite 1600, Cincinnati, OH 45202 Attention: Compliance Department.
The information herein was obtained from various sources. FEG does not guarantee the accuracy or completeness of such information provided by third parties. The information in this report is given as of the date indicated and believed to be reliable. FEG assumes no obligation to update this information, or to advise on further developments relating to it. FEG, its affiliates, directors, officers, employees, employee benefit programs and client accounts may have a long position in any securities of issuers discussed in this report.
Diversification or Asset Allocation does not assure or guarantee better performance and cannot eliminate the risk of investment loss.
Index performance results do not represent any managed portfolio returns. An investor cannot invest directly in a presented index, as an investment vehicle replicating an index would be required. An index does not charge management fees or brokerage expenses, and no such fees or expenses were deducted from the performance shown.
Neither the information nor any opinion expressed in this report constitutes an offer, or an invitation to make an offer, to buy or sell any securities.
Any return expectations provided are not intended as, and must not be regarded as, a representation, warranty or predication that the investment will achieve any particular rate of return over any particular time period or that investors will not incur losses.
Past performance is not indicative of future results.
This report is intended for informational purposes only. It does not address specific investment objectives, or the financial situation and the particular needs of any person who may receive this report.
Published July 2022
INDICES
The Alerian MLP Index is a composite of the 50 most prominent energy Master Limited Partnerships that provides investors with an unbiased, comprehensive benchmark for this emerging asset class.
The HFRI Monthly Indices (HFRI) are equally weighted performance indexes, compiled by Hedge Fund Research Inc., and are utilized by numerous hedge fund managers as a benchmark for their own hedge funds. The HFRI are broken down into 37 different categories by strategy, including the HFRI Fund Weighted Composite, which accounts for over 2000 funds listed on the internal HFR Database. The HFRI Fund of Funds Composite Index is an equal weighted, net of fee, index composed of approximately 800 fund of funds which report to HFR. See www.hedgefundresearch.com for more information on index construction.
The MSCI ACWI (All Country World Index) Index is a free float-adjusted market capitalization weighted index that is designed to measure the equity market performance of developed and emerging markets. The MSCI ACWI consists of 46 country indexes comprising 23 developed and 24 emerging market country indexes. The developed market country indexes included are: Australia, Austria, Belgium, Canada, Denmark, Finland, France, Germany, Hong Kong, Ireland, Israel, Italy, Japan, Netherlands, New Zealand, Norway, Portugal, Singapore, Spain, Sweden, Switzerland, the United Kingdom and the United States. The emerging market country indexes included are: Brazil, Chile, China, Colombia, Czech Republic, Egypt, Greece, Hungary, India, Indonesia, Korea, Malaysia, Mexico, Peru, Philippines, Poland, Qatar, Saudi Arabia, South Africa, Taiwan, Thailand, Turkey, and United Arab Emirates.
The S&P 500 Index is a capitalization-weighted index of 500 stocks. The S&P 500 Index is designed to measure performance of the broad domestic economy through changes in the aggregate market value of 500 stocks representing all major industries.
Information on any indices mentioned can be obtained either through your advisor or by written request to information@feg.com.
Market Commentary: Third Quarter 2022
For the third consecutive quarter, traditional asset classes and categories endured significant volatility, with most corners of the financial markets suffering performance losses amid a tense geopolitical backdrop, weakening economic fundamentals, and further tightening actions by the Federal Reserve (Fed). In response to a historically tight labor market, stubbornly high inflation, and a persistent imbalance between aggregate demand and available supply, the Fed doubled the pace of quantitative tightening in September and issued two 75-basis-point hikes to the federal funds rate, formally placing this key policy rate above the “neutral” level and into restrictive territory.
Global equities posted negative returns for the third consecutive quarter, with domestic equities witnessing relative outperformance versus international developed and emerging markets, and smaller cap companies relatively outperforming their larger cap counterparts. Stylistically, the longer duration and rate-sensitive growth sectors modestly outperformed value, despite a meaningful rise in Treasury interest rates.
Similar to global equity, core bonds suffered a third consecutive quarterly decline, pressured lower by a relentless rise in interest rates, with the floating-rate bank loan sector being one of the few areas within the fixed income markets to eke out a positive return on the quarter. Against a backdrop that included stubbornly high inflation and aggressive Fed rate hikes, the yield on the benchmark 10-Year Treasury Note surge a staggering 82 basis points on the quarter to 3.83%, placing this key interest rate at the highest level since 2010. The upward momentum of the 10-Year Treasury Note has carried over into the fourth quarter, with the yield now measuring over 4%.
Real asset returns were also pressured lower during the quarter, the downward momentum of which was primarily concentrated in September, as the strengthening U.S. dollar (USD), rising interest rates, and ongoing concerns of a loss of global economic growth momentum weighed on the asset class. Among the primary real asset categories, real estate investment trusts (REITs), global listed infrastructure, and commodity futures each declined by double-digit margins, while some pockets of relative strength were witnessed within the energy infrastructure sector.
KEY MARKET THEMES AND DEVELOPMENTS
PERSISTENT INFLATIONARY PRESSURES PROMPT FED TO TIGHTEN POLICY FURTHER, DESPITE WEAKENING FUNDAMENTALS
“More of the same” could casually describe the third quarter of 2022, as most key traditional asset classes and categories suffered through a third consecutive bumpy quarter, with performance losses blanketing the landscape. Central to the theme of elevated volatility and negative performance was stubbornly high inflation, both domestically and abroad, with policymakers in the United States and Europe taking further action to help bring aggregate demand and available supply more closely into balance.
In the U.S., both headline and core measures of inflation remained uncomfortably high versus the Fed’s 2% desired level through the quarter, despite meaningful year-to-date progress to tighten monetary and broader financial conditions. The Atlanta Fed’s measure of the “stickiness” of inflation has appeared unrelenting in its rise throughout 2022, despite a less linear ascent across actual core inflation. Through September, this gauge stood at 6.4%—a 40-year high—and does not appear to be moderating its trajectory.
In the third quarter, the Fed not only hiked the policy rate by 75 basis points on two separate occasions—once in July and another in September—but also ramped up the pace of quantitative tightening through an acceleration of their balance sheet winddown. After peaking at just shy of $9 trillion in April, the Fed’s balance sheet has since declined approximately $200 billion. Interestingly, despite inflation running well above target at the time, the Fed was still purchasing both Treasury and agency mortgage-backed securities this past spring, albeit at a moderated pace.
The dual forces of a higher policy rate and incremental declines in the size of the balance sheet have weighed on investor risk appetites throughout 2022, placing meaningful downward pressure on risky asset prices.
Tighter domestic monetary conditions have not only served as a headwind to risk assets, they have also transmitted into the broader financial markets through higher market interest rates, increasing credit risk premiums, and a sharp rise in the exchange rate value of the US.
The commonly-refenced Goldman Sachs U.S. Financial Conditions Index helps highlight this linkage, as the abrupt pivot from an ultra-accommodative policy stance to one of incremental tightening over the trailing year has coincided with a meaningful tightening in financial conditions. Importantly, Goldman Sachs’ gauge remains modestly below levels that have historically signaled cyclical slowdown pressures, implying further Fed tightening is likely in order to slow the economy and tamp inflation.
Headline and core inflation is still running strongly above both the Fed’s desired long-run level of 2.0% and the upper bound on the federal funds rate (3.25%). With more space to tighten broader financial conditions further, the Fed is anticipated to remain active on their tightening campaign through the duration of 2022 and into the early months of 2023, despite growing concerns the economy is headed for a hard landing.
One of the key cyclical indicators that maintains a solid historical track record of identifying inflection points in the business cycle has started to flash warning signs. The Conference Board’s Leading Economic Index (LEI), a composite of economic factors that—according to the Conference Board—in aggregate, lead turning points in the business cycle by an estimated seven months, has witnessed a marked deceleration over the trailing six months. Through September, the LEI had declined 2.8% over the preceding six-month period, representing a 5.6% annualized decline and a pace that has historically coincided with imminent recessionary conditions.
In addition to applying downward pressure on economic fundamentals, the significant tightening initiatives detailed above helped underpin a meaningful appreciation of the USD during the quarter, with associated weakness felt across developed and emerging market currencies alike. The euro, British pound, Japanese yen, and liquid emerging market currencies each slumped to multi-decade low levels versus the USD in the third quarter, prompting interventionist market responses by both the UK government and the Bank of Japan in a bid to help stem further declines.
Through September, on an inflation-adjusted and trade-weighted basis, the Bank for International Settlements’ Real Effective Exchange Rate (REER) for the USD stood at an index level of 140.66, 35% above the historical average, 2.5 standard deviations above the long-run trend, and the highest level since 1985.
Ultimately, it appears the more persistent inflationary pressures remain, the harder the Fed will have to hit the brakes. This would, in turn, support a further rise in the exchange rate value of the USD and, unfortunately, a likely additional increase in global risk premia that would weigh on asset prices.
OUTLOOK AND CONCLUDING THOUGHTS
Both risk-seeking and high quality-oriented global investors suffered through a third consecutive quarter of elevated financial market volatility and broad-based performance losses across key global asset classes and categories. Persistent positive inflationary momentum in conjunction with a historically tight labor market supported the need for additional tightening measures by the Fed, despite mounting evidence of developing broad-based economic weakness.
In the coming months, the anticipated Fed path implied by the bond market points to further monetary restraint in a quest to restore both price stability and a balance in supply and demand. While steep losses have plagued the financial markets year-to-date, further downside volatility may be in order, should inflation fail to smoothly subside and evidence of a hard landing become more abundant.
DISCLOSURES
Bloomberg Data Disclosure: Source- Bloomberg Index Services Limited. BLOOMBERG® is a trademark and service mark of Bloomberg Finance L.P. and its affiliates (collectively “Bloomberg”). Bloomberg or Bloomberg’s licensors own all proprietary rights in the Bloomberg Indices. Bloomberg does not approve or endorse this material or guarantee the accuracy or completeness of any information herein, nor does Bloomberg make any warranty, express or implied, as to the results to be obtained therefrom, and, to the maximum extent allowed by law, Bloomberg shall not have any liability or responsibility for injury or damages arising in connection therewith.
This report was prepared by Fund Evaluation Group, LLC (FEG), a federally registered investment adviser under the Investment Advisers Act of 1940, as amended, providing non-discretionary and discretionary investment advice to its clients on an individual basis. Registration as an investment adviser does not imply a certain level of skill or training. The oral and written communications of an adviser provide you with information about which you determine to hire or retain an adviser. Fund Evaluation Group, LLC, Form ADV Part 2A & 2B can be obtained by written request directed to: Fund Evaluation Group, LLC, 201 East Fifth Street, Suite 1600, Cincinnati, OH 45202 Attention: Compliance Department.
The information herein was obtained from various sources. FEG does not guarantee the accuracy or completeness of such information provided by third parties. The information in this report is given as of the date indicated and believed to be reliable. FEG assumes no obligation to update this information, or to advise on further developments relating to it. FEG, its affiliates, directors, officers, employees, employee benefit programs and client accounts may have a long position in any securities of issuers discussed in this report.
Diversification or Asset Allocation does not assure or guarantee better performance and cannot eliminate the risk of investment loss.
Index performance results do not represent any managed portfolio returns. An investor cannot invest directly in a presented index, as an investment vehicle replicating an index would be required. An index does not charge management fees or brokerage expenses, and no such fees or expenses were deducted from the performance shown.
Neither the information nor any opinion expressed in this report constitutes an offer, or an invitation to make an offer, to buy or sell any securities.
Any return expectations provided are not intended as, and must not be regarded as, a representation, warranty or predication that the investment will achieve any particular rate of return over any particular time period or that investors will not incur losses.
Past performance is not indicative of future results.
This report is intended for informational purposes only. It does not address specific investment objectives, or the financial situation and the particular needs of any person who may receive this report.
Published July 2022
INDICES
The Alerian MLP Index is a composite of the 50 most prominent energy Master Limited Partnerships that provides investors with an unbiased, comprehensive benchmark for this emerging asset class.
The HFRI Monthly Indices (HFRI) are equally weighted performance indexes, compiled by Hedge Fund Research Inc., and are utilized by numerous hedge fund managers as a benchmark for their own hedge funds. The HFRI are broken down into 37 different categories by strategy, including the HFRI Fund Weighted Composite, which accounts for over 2000 funds listed on the internal HFR Database. The HFRI Fund of Funds Composite Index is an equal weighted, net of fee, index composed of approximately 800 fund of funds which report to HFR. See www.hedgefundresearch.com for more information on index construction.
The MSCI ACWI (All Country World Index) Index is a free float-adjusted market capitalization weighted index that is designed to measure the equity market performance of developed and emerging markets. The MSCI ACWI consists of 46 country indexes comprising 23 developed and 24 emerging market country indexes. The developed market country indexes included are: Australia, Austria, Belgium, Canada, Denmark, Finland, France, Germany, Hong Kong, Ireland, Israel, Italy, Japan, Netherlands, New Zealand, Norway, Portugal, Singapore, Spain, Sweden, Switzerland, the United Kingdom and the United States. The emerging market country indexes included are: Brazil, Chile, China, Colombia, Czech Republic, Egypt, Greece, Hungary, India, Indonesia, Korea, Malaysia, Mexico, Peru, Philippines, Poland, Qatar, Saudi Arabia, South Africa, Taiwan, Thailand, Turkey, and United Arab Emirates.
The S&P 500 Index is a capitalization-weighted index of 500 stocks. The S&P 500 Index is designed to measure performance of the broad domestic economy through changes in the aggregate market value of 500 stocks representing all major industries.
Information on any indices mentioned can be obtained either through your advisor or by written request to information@feg.com.
Recent posts
Subscribe to blog